Posted on

Part 2: What Happens If the Yen Carry Trade Unwinds?

The yen carry trade has survived because one fundamental condition has persisted for decades: money has been comparatively cheap to borrow in Japan.  Investors could borrow yen at low interest rates, exchange those funds for foreign currencies and invest in higher-yielding bonds, equities and other assets overseas.  As examined in the first part of this series, the exact size of the trade is impossible to determine because yen-funded exposure exists across banks, hedge funds, pension funds, insurers, institutional investors and derivatives markets alike.  What is clear is that the strategy has become deeply embedded in global finance.  This creates an uncomfortable problem for policymakers.  Japan needs a stronger yen to control imported inflation, but if the currency strengthens too rapidly, the very process of unwinding decades of yen-funded investment could create instability both domestically and internationally.  This creates the type of uncertainty that precious metals can traditionally thrive in.  Currently, gold trades at AUD $6,471, silver at AUD $96.16, and platinum at AUD $2,633.


What would unwinding the yen carry trade mean for Japan?

The first consequences would be felt at home.  Japan’s economy has been shaped by decades of exceptionally low interest rates.  Businesses have become accustomed to inexpensive credit, households have adapted to minimal returns on savings, banks have constructed balance sheets around low borrowing costs and the Japanese Government has accumulated one of the largest public debt burdens in the developed world. The International Monetary Fund (IMF) expects gross government debt to remain around 200% of GDP in 2026, meaning even gradual increases in borrowing costs have significant long-term implications for government finances.

The Bank of Japan therefore cannot simply raise interest rates aggressively to rescue the yen.  While this would address the fundamental issues that are depreciating the yen, higher rates would also increase financing costs throughout the economy with smaller and more highly leveraged businesses particularly vulnerable.  It would also increase Japanese government bond yields which would assist in unwinding the yet carry trade faster.

This is why the speed of monetary tightening matters as much as its direction.  Gradual increases (such as 25 basis points over six months) give banks, businesses and government finances time to adjust.  Rapid tightening designed primarily to defend the currency (such as 25 basis points or more over three months) would be much more disruptive.  The IMF itself has advocated gradual monetary normalisation rather than an abrupt change in policy, reflecting the delicate balance facing the Bank of Japan.


What would unwinding the yen carry trade mean for international markets?

The international consequences potentially become much larger because the carry trade issue does not end simply by not borrowing from Japan in the future.  Existing positions must also be closed.  Consider an investor who borrowed yen and used the proceeds to purchase US technology shares.  If the yen rises significantly, the amount of USD required to repay the Japanese loan increases.  If the movement is sufficiently large, the investor may be forced to sell those shares, convert the proceeds back into yen and repay the debt before the currency appreciates further.  As this progresses that process can accelerate because lenders may demand additional collateral or force positions to be closed.  One institution doing this is irrelevant.  Thousands of institutional investors attempting to do it simultaneously can become a market event.

The mechanism is self-reinforcing.  Investors sell overseas assets to obtain cash, then purchase yen to repay their loans.  Selling places downward pressure on the assets they are exiting, while purchasing yen pushes the Japanese currency higher.  A stronger yen then creates larger losses for other carry traders encouraging or forcing them to unwind as well.  What begins as currency appreciation can therefore become simultaneous deleveraging across equities, bonds and other risk assets, world-wide.

Markets received a reminder of this vulnerability in August of 2024, when Japan raised rates and the US moved toward lowering rates and the differential between the two narrowed.  Under these circumstances, even relatively modest changes in exchange rates could eliminate the narrow returns available from conventional yen-dollar carry trades forcing leveraged investors to reduce positions elsewhere.  The important point is that carry trades are sensitive not just to simple interest rates and interest rate changes but equally to changes in currency.


Why do US treasuries matter so much?

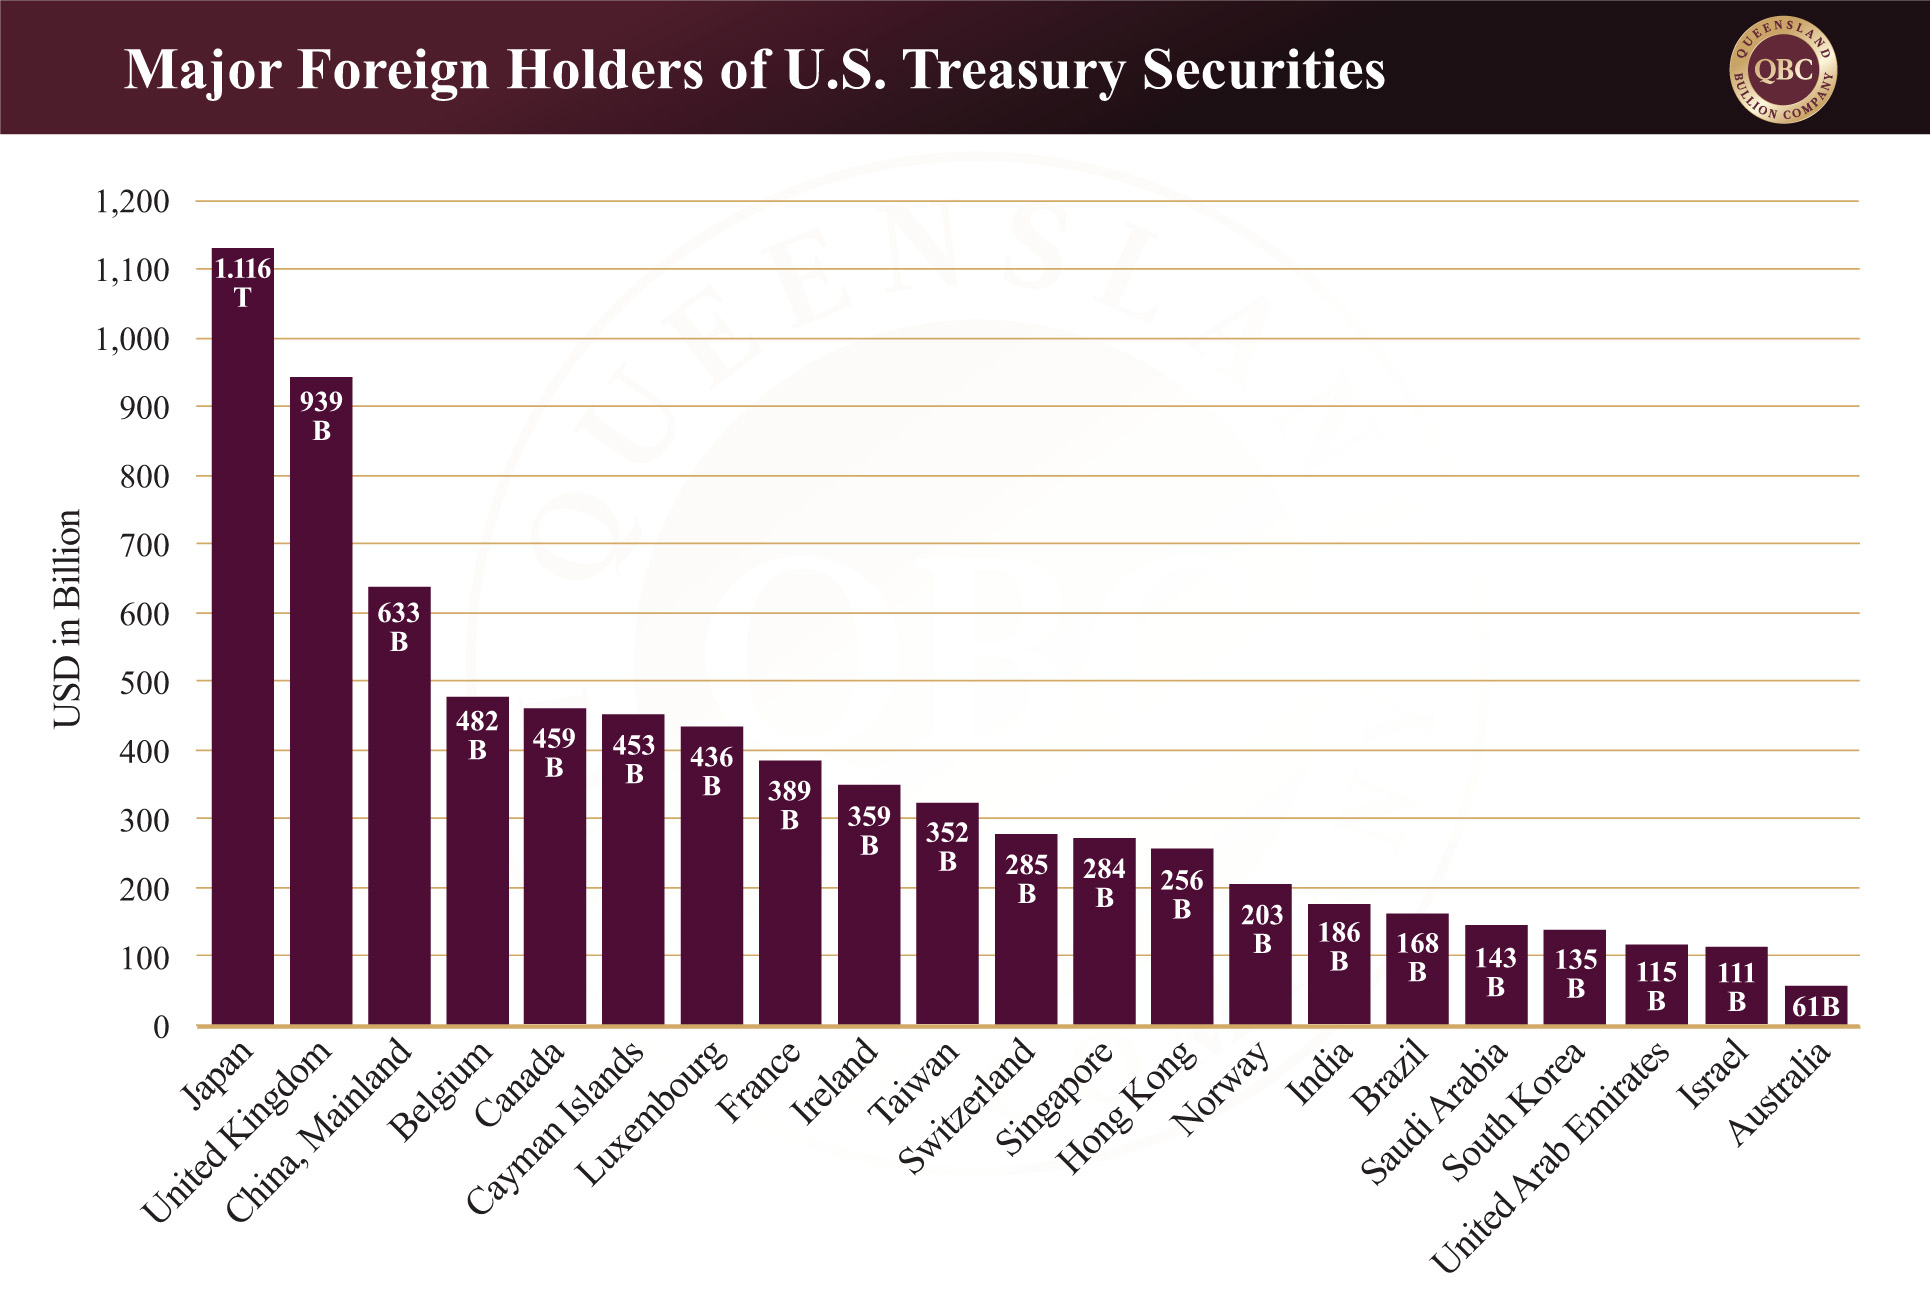
The US Treasury market sits near the centre of the problem.  Japan holds more than USD $1 trillion of US government debt and has historically accumulated foreign assets partly because domestic Japanese yields offered comparatively poor returns.  A sustained increase in Japanese interest rates changes that calculation.  If Japanese government bonds begin offering more attractive returns, Japanese institutions have less incentive to accept currency risk by investing overseas.  Significant capital could therefore return home even without a disorderly carry trade unwind.

Currency intervention creates another source of pressure.  As covered in Part 1, if the Japanese government needed to strengthen a weakening yen they could potentially need to sell some of their holding in U.S bonds.  More U.S. bonds on the market means higher bond yields.  Higher bond yields would then flow through to mortgages, corporate borrowing, government refinancing costs and the discount rates used to value equities.  This is one reason the United States has an interest in helping Japan stabilise the yen without forcing Tokyo to liquidate large quantities of US government debt.

Could a yen carry trade unwind trigger forced selling?

This is perhaps the greatest international risk.  The carry trade has not simply funded U.S. government bonds.  Cheap yen has been deployed across equities, corporate debt and a range of higher-risk international investments in various countries.  The precise exposure cannot be measured which is part of the problem.  Analysts can observe bank lending, foreign portfolio investment and disclosed institutional holdings, but leveraged derivatives and hedge fund positions make the full network considerably less transparent.

The narrowest estimates have previously identified approximately USD $350 billion in short-term external loans by Japanese banks that could potentially be associated with yen-funded strategies.  Japan’s broader foreign portfolio holdings have been measured to the tune of USD $20 trillion.  Neither figure represents the definitive size of the carry trade, but together they illustrate the amount of capital potentially influenced by Japanese interest rates and currency movements.

Leveraged investors may be forced to liquidate whichever assets can be sold most easily, rather than simply those directly connected with Japan.  This is how financial stress can move between apparently unrelated markets.  A problem beginning with the yen could theoretically produce selling in US equities, government bonds or other liquid assets because those are the markets investors can access quickly when they need cash.  That does not mean a stronger yen automatically causes a global market crash.  The size, speed and positioning behind the move would determine the outcome.  However, it does mean the yen represents an important source of global leverage (and potential liability) that investors can easily overlook when concentrating exclusively on American or European markets.


Why can’t Japan simply allow the yen to keep falling?

If a rapidly rising yen creates these risks, allowing it to depreciate indefinitely might appear to be the easier option.  Unfortunately, that creates a different set of problems.  Japan depends heavily on imports, particularly for energy.  A weaker yen increases the domestic cost of goods priced internationally in US dollars, importing inflation directly into the Japanese economy therefore rates would need to increase.  The U.S.-Israel-Iran War demonstrated the problem clearly as higher oil prices combined with a weaker yen to create a substantial terms-of-trade shock for an economy that imports almost all of its oil.  To this end, the country’s petroleum bill increased by 59% as at this June.

Excessive depreciation could also affect Japan’s neighbours.  A dramatically cheaper yen makes Japanese exports more competitive against products manufactured in China, South Korea and elsewhere in Asia.  Other countries may then face pressure to tolerate weaker currencies of their own to preserve export competitiveness as they are exporters and not importers, potentially creating a broader cycle of currency depreciation way beyond Japan.

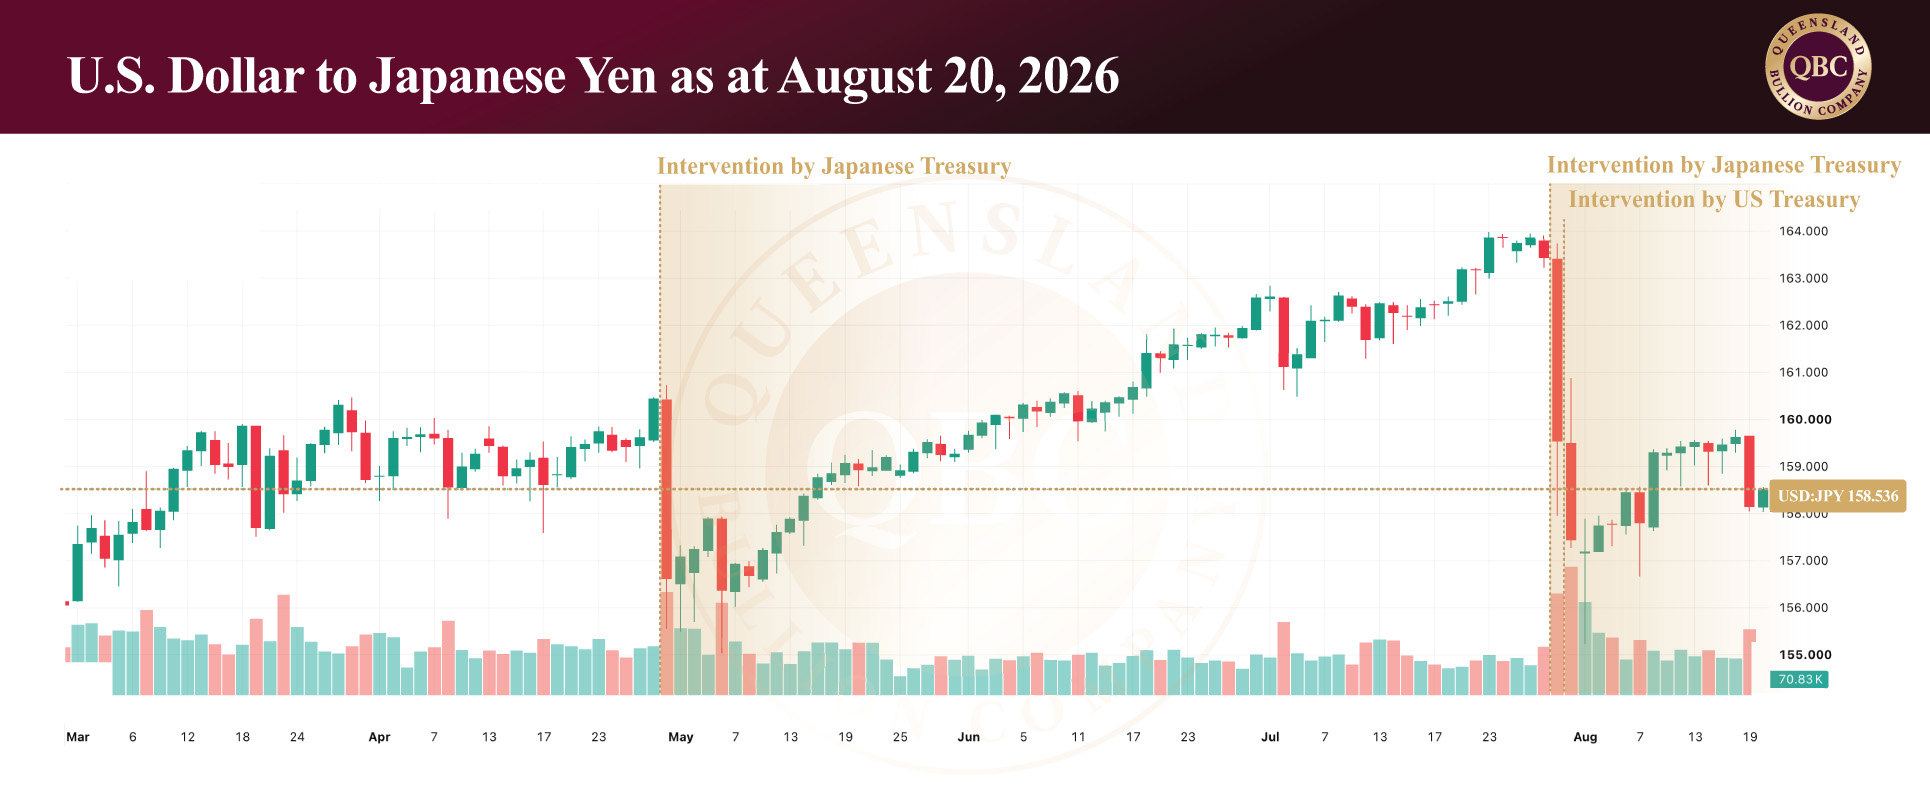
There is also a political threshold.  The ¥160 region against the US dollar has increasingly become an important psychological level for markets because Japanese authorities have repeatedly demonstrated a willingness to intervene around or beyond it.  The recent joint intervention pushed the yen from approximately ¥164 to around ¥155 before the currency began weakening again.  By mid-August it had already surrendered approximately half of that improvement.  This helps explain why intervention should be viewed less as an attempt to establish a permanently stronger yen and more as a guardrail against disorderly depreciation.


Why does Japan need the yen to be neither too weak nor too strong?

 Japan is effectively trying to keep the currency within a range that avoids two very different financial problems.  If the yen becomes too weak, domestic pressures build via imported inflation and higher interest rates.  Additionally other exporting nations experience pressure to lower their own currencies.  If the yen becomes too strong, the carry trade becomes less profitable with investors potentially facing significant losses and consequences rippling throughout global investment markets.  The ideal outcome is therefore neither collapse nor rapid appreciation.  Japan needs an orderly adjustment that allows the yen to strengthen sufficiently to contain imported inflation while avoiding the kind of sudden currency movement that could destabilise domestic borrowers and force international carry trades to unwind simultaneously.

That is an extraordinarily difficult balancing act because policymakers do not control every variable.  The Bank of Japan controls Japanese monetary policy, but it does not control Federal Reserve rates, Middle Eastern oil prices, US fiscal policy or the behaviour of leveraged international investors.  The recent intervention illustrates the limits of national monetary policy in a financial system where capital can move around the world almost instantaneously.


Is the yen carry trade a global financial liability?

This does not mean the yen carry trade is destined to collapse or that a global financial crisis is inevitable.  Policymakers have substantial tools available to manage liquidity, and gradual adjustment could allow positions to unwind without systemic disruption.  However, the recent interventions demonstrate that the margin for error has narrowed.  An interest-rate decision in Tokyo can influence a currency trade, which can influence Treasury yields, which can influence American borrowing costs, equity valuations and financial conditions throughout the world.

For investors, this interconnectedness reinforces the value of diversification beyond purely financial assets.  Physical gold and silver remain exposed to market prices and currency changes, but the assets themselves do not represent another institution’s liability.  In a global financial system increasingly dependent on governments balancing one market against another, that independence remains one of the fundamental reasons physical precious metals continue to serve as a form of financial insurance.  Taking Part 1 and Part 2 of this report into consideration, we firmly believe that the fundamental reasons for holding precious metals long term has never been stronger.
Posted on

Part 1: Why Are the US and Japan Trying to Prop Up the Yen?

The Japanese yen is the third most actively traded currency in the world, but its importance extends well beyond foreign exchange markets.  For decades, exceptionally low Japanese interest rates have allowed investors to borrow cheaply in yen and deploy that money into higher-yielding assets overseas, creating what is known as the yen carry trade.  The strategy has helped channel enormous amounts of capital into global bond, equity and other financial markets, but changes in interest rates and persistent weakness in the yen is now creating problems for Japan and, increasingly, the United States.  After falling to its weakest level in approximately forty years, Japan intervened heavily to support its currency before the US took the extraordinary step of joining the effort in August.  The intervention initially strengthened it by 5.8%, although it has since surrendered roughly half those gains.  At the time of writing, gold trades at approximately AUD $6,352 per ounce, silver at AUD $95.72 and platinum at AUD $2,590, placing renewed focus on precious metals as governments intervene to manage instability across currencies and sovereign debt markets.


What is the yen carry trade?

A carry trade is relatively simple in principle.  An investor borrows money in a country where interest rates are low and invests those funds somewhere offering a higher return.  The difference between the cost of borrowing and the return generated by the investment is known as the “carry”.  For decades, Japan has provided almost ideal conditions for this strategy because interest rates remained close to zero while rates elsewhere were considerably higher.

A traditional yen carry trade might therefore involve borrowing Japanese yen, converting the funds into US dollars and purchasing US Treasury securities.  The investor pays the comparatively low Japanese interest rate while receiving the higher return available in the United States.  The same principle can be applied to equities, corporate bonds and other assets, meaning yen-funded capital has found its way into everything from US technology stocks to more speculative markets such as cryptocurrency.

The strategy becomes even more profitable when the yen depreciates.  If an investor borrows yen, converts it into US dollars and the yen subsequently falls against the dollar, fewer US dollars are required to purchase the yen needed to repay the original loan.  However, the opposite is equally important.  A rapidly appreciating yen can turn a profitable carry trade into a loss, forcing leveraged investors to sell assets and repurchase yen to meet their obligations.  It is this reversal that makes the carry trade important well beyond Japan.


How large is the yen carry trade worldwide?

The most accurate answer is that nobody knows exactly.  There is no central register recording every yen-funded investment around the world.  A Japanese bank lending yen overseas may be facilitating a conventional commercial transaction rather than a speculative carry trade, while hedge funds can establish leveraged positions through derivatives that are considerably harder to observe.  Japanese households, insurers, pension funds and institutions also own enormous portfolios of foreign assets that may share characteristics with the carry trade without fitting its narrowest meaning.

Using a strict definition, analysts have previously pointed to approximately USD $350 billion in short-term external lending by Japanese banks as one indication of the size of yen-funded trades.  Even this figure could simultaneously overstate and understate the true exposure.  Some loans may have nothing to do with carry trading, while leverage and positions established outside the banking system could make the real financial exposure considerably larger.  Japanese foreign portfolio investment alone stood at approximately ¥666.86 trillion, or USD $4.54 trillion at the time of the calculation, with more than half invested in interest-rate-sensitive debt securities.

Deutsche Bank has approached the question from an even broader perspective.  Currency strategist George Saravelos combined the balance sheets of the Japanese Government, Bank of Japan (BOJ), Government Pension Investment Fund and state-owned banks to examine Japan as though these institutions formed one consolidated financial entity.  The analysis characterised approximately USD $20 trillion of Japanese government debt and associated assets as an enormous form of carry trade: low-cost, short-term yen liabilities supporting assets that include higher-returning investments abroad.

Importantly, Deutsche Bank’s USD $20 trillion figure should not be interpreted as an estimate that speculative traders have USD $20 trillion invested in conventional yen carry trades.  It is a conceptual analysis of Japan’s consolidated public-sector balance sheet.  Its significance lies in demonstrating how deeply decades of inexpensive yen funding have become embedded in Japan’s financial system.  There is therefore no credible single figure for the total yen carry trade.  Depending on the definition used, the identifiable exposure ranges from hundreds of billions of dollars to trillions, while Deutsche Bank’s broader analysis demonstrates that the same underlying interest-rate dynamic extends across an approximately USD $20 trillion public-sector balance sheet.  The inclusion of the private sector would only add to these figures.


Why Is the Japanese Yen Falling?

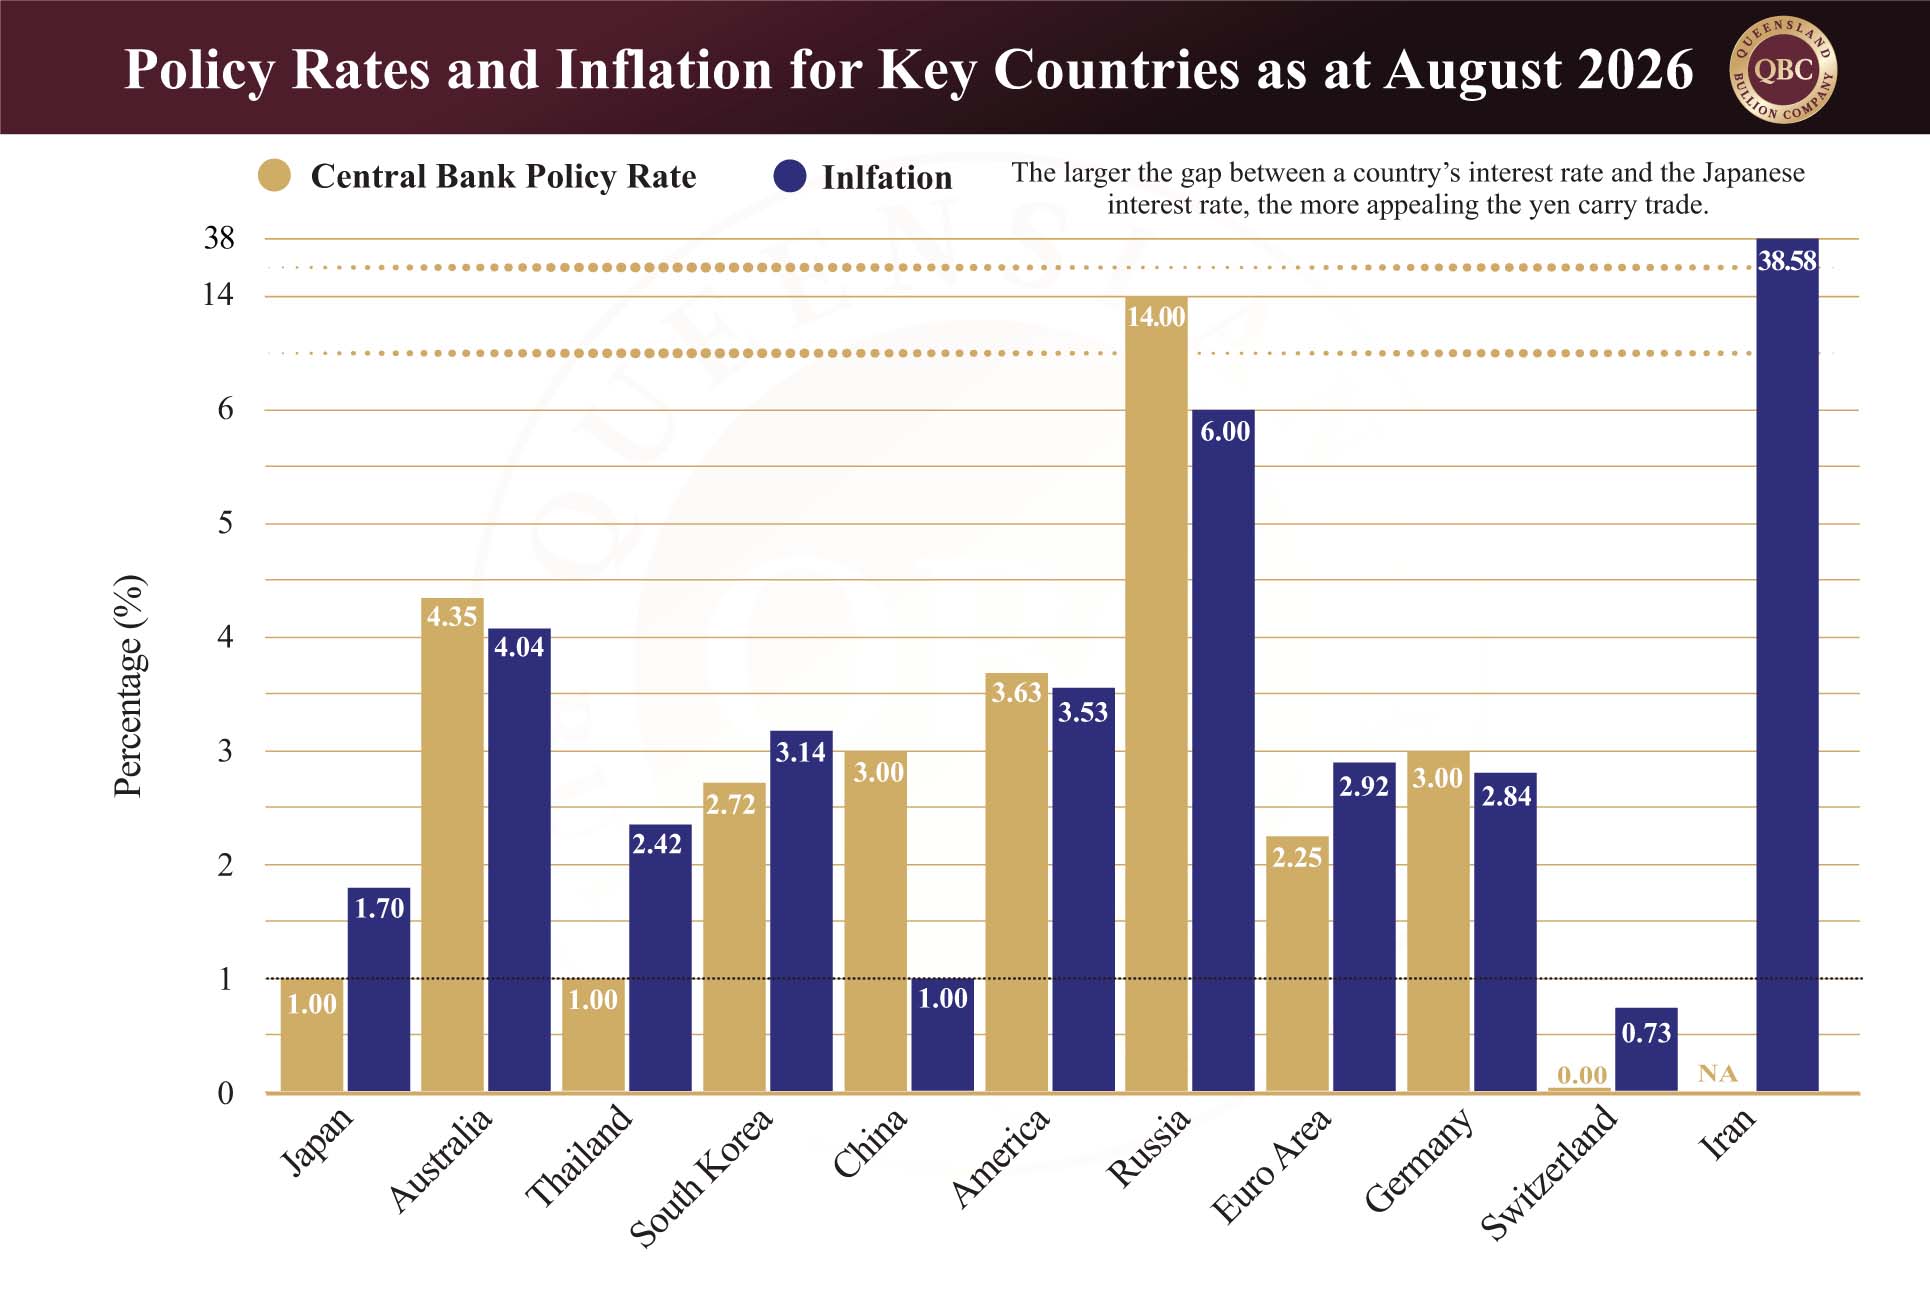
The fundamental problem is the difference between Japanese and overseas interest rates.  The Bank of Japan’s policy rate remains around 1%, compared with the US federal funds target range of 3.50% to 3.75%.  That difference gives investors a financial incentive to sell yen and purchase US dollars to access higher-yielding American assets.  As more investors make that transaction, additional yen enters foreign exchange markets while demand for dollars increases, placing downward pressure on the Japanese currency.  The recent US-Japan intervention changed market psychology, but it did not eliminate this underlying interest-rate differential.

Japan’s fiscal position adds another complication.  The International Monetary Fund (IMF) estimates gross government debt at approximately 204% of GDP in 2026, leaving policymakers with limited room to increase borrowing costs aggressively without consequences elsewhere in the economy.  After decades of exceptionally low rates, households, businesses, financial institutions and the Japanese Government itself have adapted to inexpensive money.  Raising interest rates may support the yen, but doing so too quickly risks creating problems for borrowers, banks, asset prices and government finances.

Why does Japan need to support the yen?

A weaker currency is not inherently bad for Japan.  Historically, depreciation supported major exporters by making Japanese products cheaper overseas and increasing the yen value of foreign earnings.  However, the structure of the Japanese economy has changed as many large companies shifted production overseas, while the country remains heavily dependent on imported energy, food, raw materials and industrial inputs.

At some point, currency weakness therefore becomes inflationary rather than beneficial.  Every barrel of oil, shipment of raw materials or imported component priced in US dollars becomes more expensive when translated back into yen.  Those costs eventually reach Japanese businesses and households, eroding purchasing power and placing political pressure on the government.

Japan has consequently become increasingly willing to intervene directly.  Between 28 April and 27 May 2026 alone, Japanese authorities spent approximately ¥11.7 trillion, equivalent to about USD $73.5 billion at the time, supporting the yen after it moved beyond ¥160 against the US dollar.  The more recent joint intervention was larger again in strategic significance because Washington participated directly.  Japan reportedly deployed approximately ¥8.45 trillion, or USD $53 billion, while the US also purchased yen.

The difficulty is that intervention can influence price without necessarily changing the conditions producing that price.  Selling foreign reserves and purchasing yen reduces the amount of yen circulating and demonstrates that authorities are prepared to defend the currency; however, as long as investors can borrow more cheaply in Japan than in the United States, the incentive underlying the carry trade remains.  Intervention can therefore slow speculation and establish psychological boundaries, but without changes to interest rates it may struggle to permanently reverse the trend.


Why is the United States supporting the Japanese yen?

This is where a Japanese currency problem becomes an American bond market problem.  Japan is one of the largest foreign holders of US government debt, with Treasury holdings exceeding USD $1 trillion.  Those assets provide Japan with a substantial pool of US dollars that can be accessed when it needs to intervene in currency markets.  To strengthen the yen, Japan can sell foreign assets such as US Treasuries, receive US dollars and use those dollars to purchase yen.  Evidence suggests Japan drew heavily on foreign securities during its intervention earlier this year, with holdings falling by approximately USD $75.6 billion during May, broadly matching the scale of its currency intervention.

For Washington, that creates an uncomfortable problem.  If both Japan and America concurrently sell large quantities of U.S. bonds the market can become flooded.  Greater supply can push bond prices lower and yields higher, increasing borrowing costs throughout the American economy and potentially making it more expensive for Washington itself to service and refinance debt.

The US therefore has an interest in preventing Japan from becoming a forced seller of American government bonds.  During the latest intervention, the United States reportedly sold euros from its reserves to purchase yen rather than selling US dollars, helping support the Japanese currency without directly adding pressure to the Treasury market or materially weakening the dollar.

This helps explain why an apparently domestic Japanese currency problem warranted direct American involvement.  Washington is not simply supporting an ally.  It is also protecting the stability of the world’s largest sovereign bond market and, by extension, its own cost of borrowing.

What does the yen intervention mean for global financial markets?

The joint intervention achieved something important.  It demonstrated that Japan and the United States are prepared to act together and temporarily changed the psychology surrounding the yen.  What it has not done is remove the underlying incentive driving the carry trade.  Less than two weeks later, the yen had already surrendered approximately half of the gains achieved through intervention, with markets once again testing the willingness of policymakers to defend the currency.

More importantly, the episode demonstrates just how interconnected modern financial markets have become.  Japanese interest rates influence the yen carry trade.  The carry trade directs capital towards American bonds and equities.  Yen weakness increases Japanese inflation.  Defending the yen can require bond sales.  Bond sales can push American bond yields higher, affecting borrowing costs, equity valuations and ultimately monetary policy throughout the world’s largest economy.  Increased borrowing costs can stall economic growth.  A currency problem that begins in Tokyo can therefore quickly become a financial problem in Washington and, from there, spread throughout global markets.

For precious metals investors, this interconnectedness is precisely what makes physical assets relevant.  Gold and silver do not depend on the solvency of a bank, the repayment of a government bond or the maintenance of an interest-rate differential between two countries.  Their prices will still fluctuate with currencies, yields and investor sentiment, but physical bullion itself exists outside the network of liabilities connecting governments and financial institutions.  The recent intervention does not prove that a wider financial crisis is imminent, but it does seem to be hurtling in this direction.

That raises the more important question.  If the yen carry trade is large enough to connect Japanese monetary policy with trillions of dollars of international assets, what happens if investors are eventually forced to unwind it?  In the second part of this series, we examine how a rising yen could affect Japan, US Treasuries, international equity markets and the enormous pool of leveraged capital built around decades of inexpensive Japanese money.

Posted on

Why Did Gold Rise Overnight? Four Forces Driving the Rally

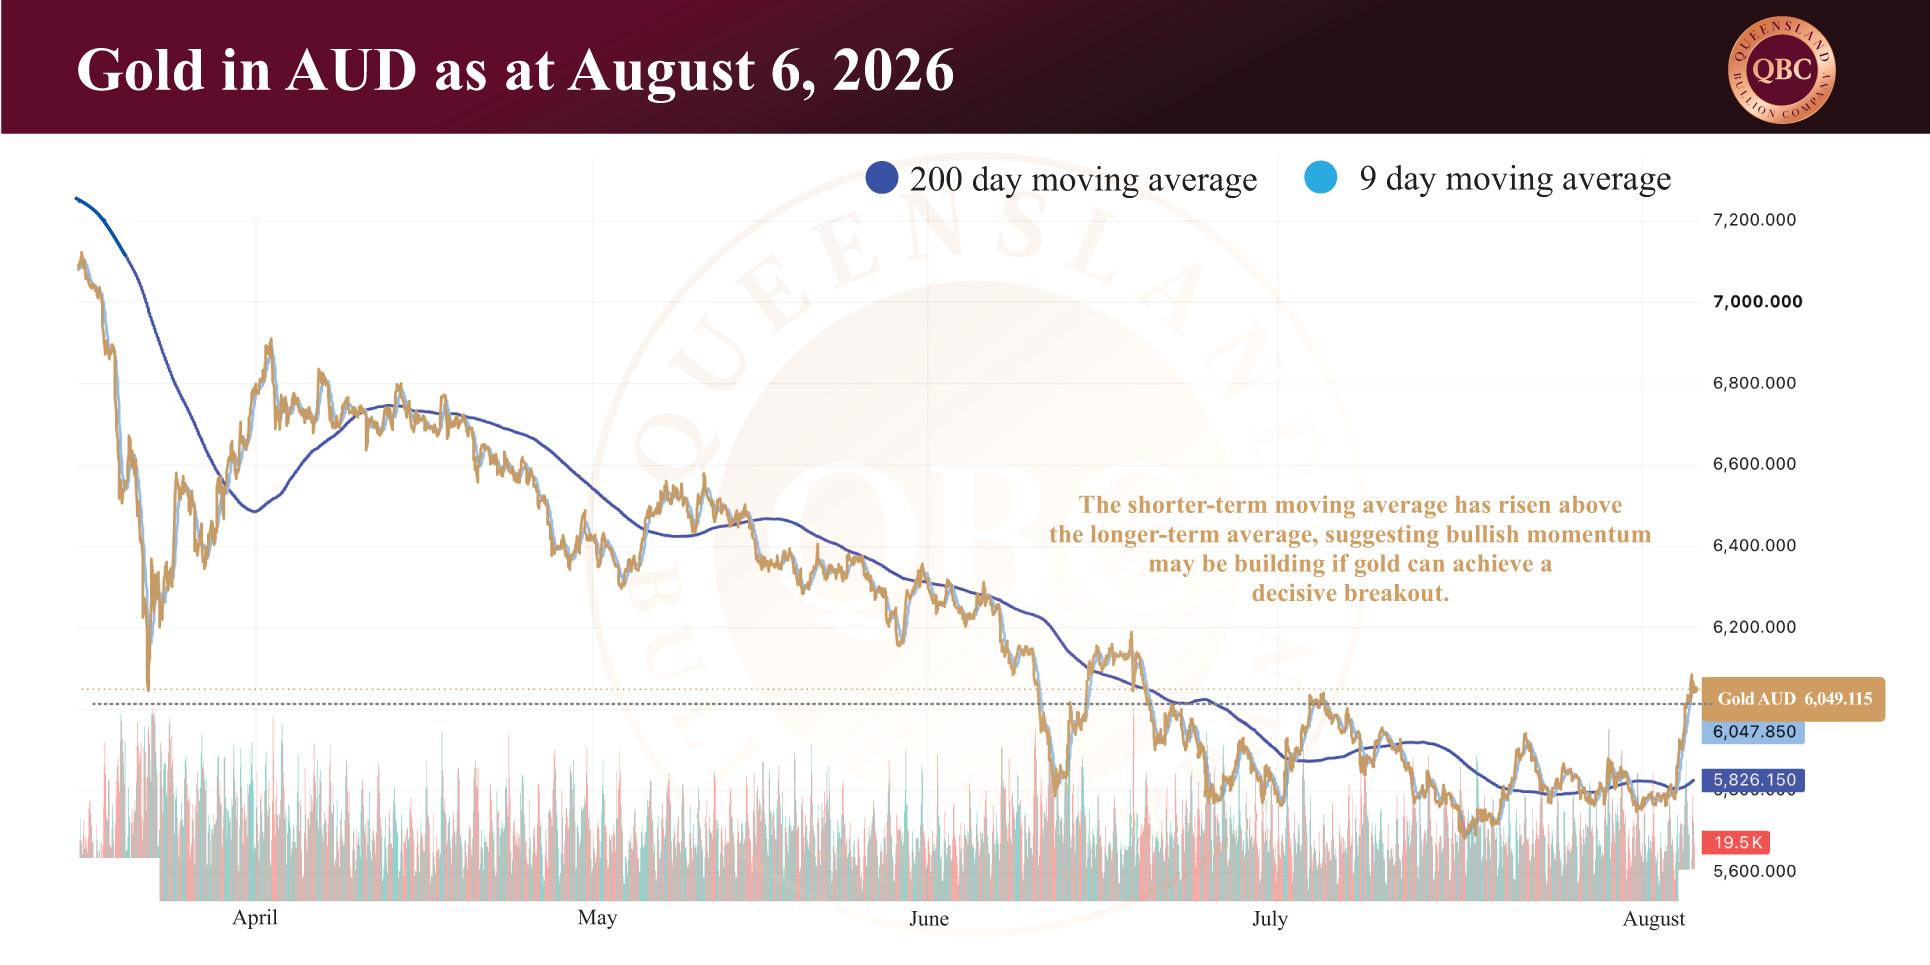
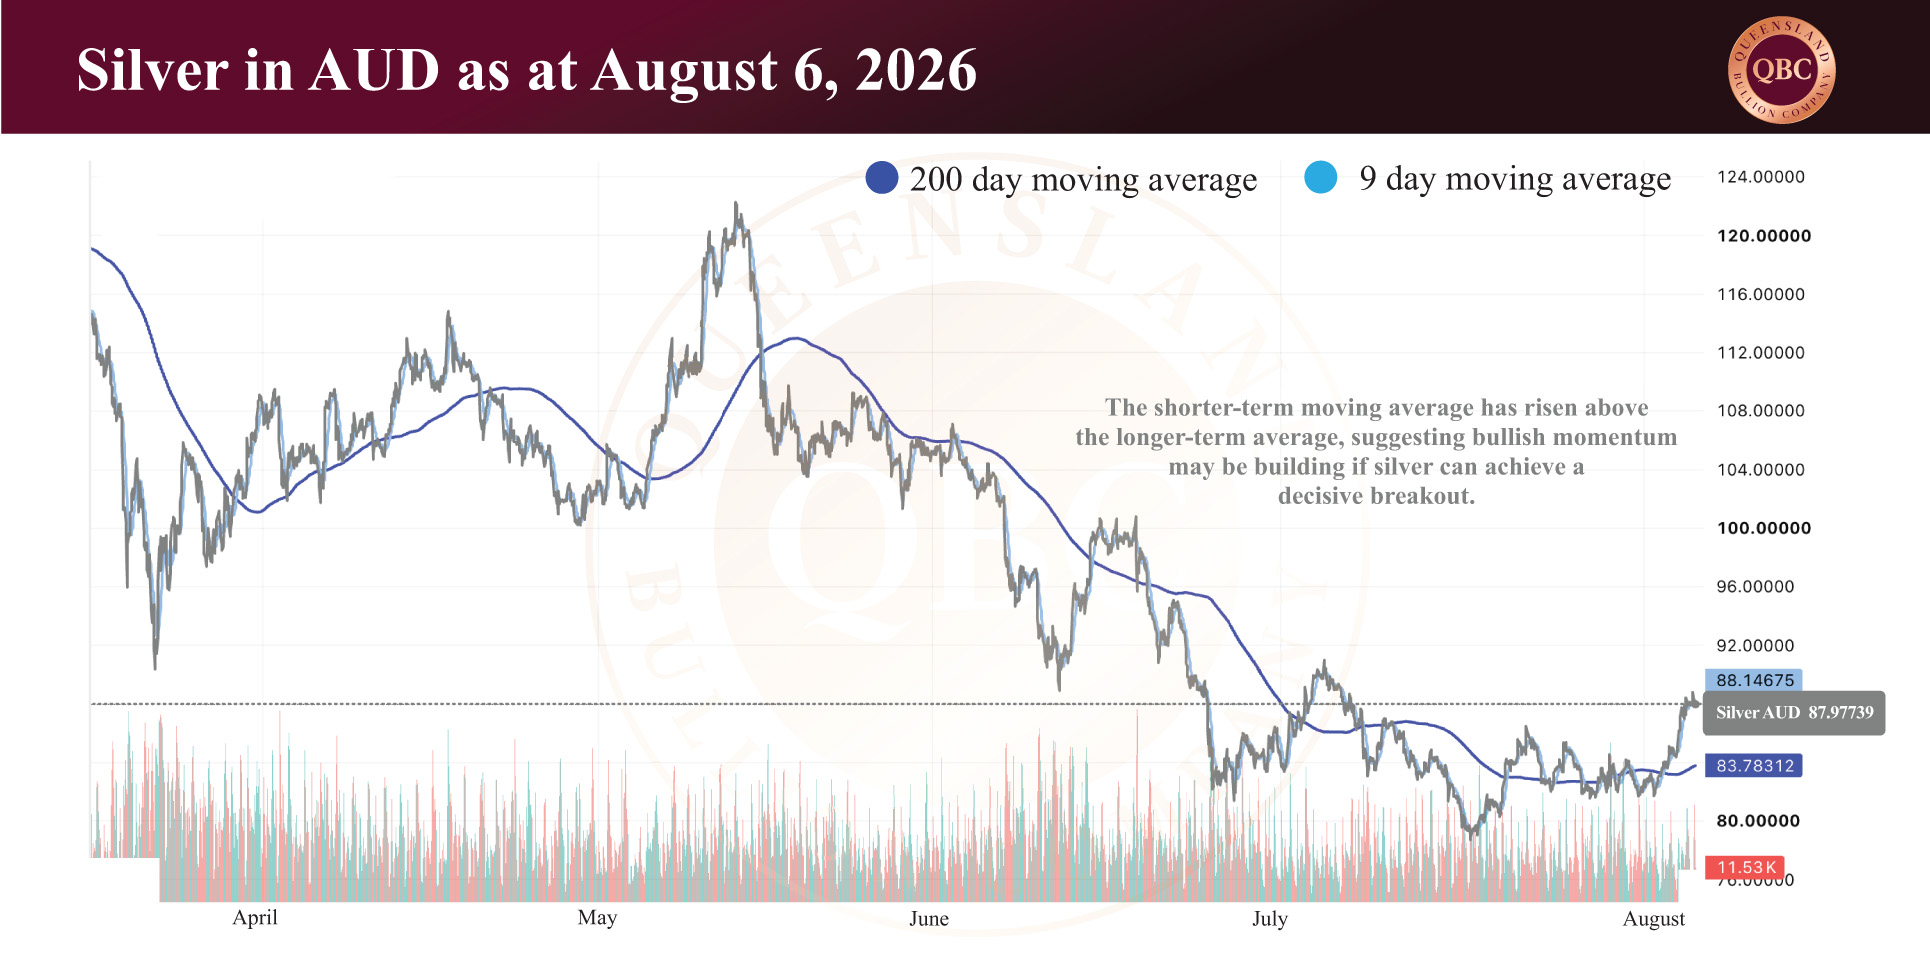
Only days after entering August on uncertain footing, gold and silver delivered one of their strongest single-day advances in weeks.  The move surprised many investors given that precious metals had spent much of the past six months correcting from the extraordinary highs reached earlier this year; however, overnight price action was driven less by any single headline and more by a convergence of monetary policy, economic data and geopolitical developments.  While gold trades at approximately AUD $6,068 per ounce, silver at AUD $88.34 and platinum at AUD $2,509, these developments have eased several of the short-term headwinds that had weighed on precious metals since the beginning of the year.


Has the Federal Reserve become less certain about raising interest rates?

The most significant catalyst remains the US Federal Reserve.  At its July meeting, the Federal Open Market Committee (FOMC) voted to leave the federal funds rate unchanged at 3.50% to 3.75%. While the decision itself was widely anticipated, the voting breakdown was not.  The committee voted nine to three, with Cleveland Fed President Beth Hammack, Minneapolis Fed President Neel Kashkari and Dallas Fed President Lorie Logan all favouring an immediate rate increase.

Three dissents are uncommon in modern Federal Reserve history and typically signal genuine disagreement within the committee rather than minor differences in opinion.  Until recently, financial markets interpreted this division as increasing the likelihood of another rate hike later this year.  Higher interest rates generally support higher bond yields, increasing the opportunity cost of holding non-income-producing assets such as gold and silver.  As a result, expectations of further monetary tightening have remained one of the principal reasons precious metals have struggled to regain the momentum seen throughout 2025.  Importantly, investors are now questioning whether that hawkish outlook remains justified.


Did the latest U.S. jobs data reduce the chances of another rate hike?

The first major test arrived with the latest Job Openings and Labour Turnover Survey (JOLTS).  Job openings declined modestly from 7.6 million to around 7.44 million.  The softer labour market data reinforced evidence that demand for workers is gradually easing, reducing confidence that the economy could withstand a more restrictive monetary environment brought about by higher interest rates.  Because the Federal Reserve has repeatedly emphasised the importance of labour market conditions when setting monetary policy, the report immediately prompted investors to reassess the probability of another rate increase.  The significance of the report lies less in the absolute number and more in its timing.  Following a divided Federal Reserve meeting, the weaker labour data reduced confidence that policymakers will ultimately decide another increase is necessary.  As expectations for tighter monetary policy softened, bond yields have eased (especially the 10 Year Treasury bond) and gold responded positively.

Financial markets are currently treating each major economic release as evidence either for or against another rate rise.  Rather than reacting to individual data points in isolation, investors are attempting to determine whether inflationary pressures continue to justify additional tightening.  For precious metals, every report that reduces those expectations removes another short-term headwind.


Are falling oil prices also supporting gold?

While monetary policy dominated investor attention geopolitics provided a second catalyst.  Oil prices moved lower following comments from US Treasury Secretary Scott Bessent suggesting that an agreement to reopen commercial shipping through the Strait of Hormuz could be reached within days.  Brent crude subsequently declined as investors anticipated that any reduction in regional tensions would improve oil supply and reduce inflationary pressures.

The situation remains far from straightforward.  Within hours of those comments, UK Maritime Trade Operations confirmed that a commercial vessel had been struck by an unidentified projectile in the Strait of Hormuz.  Iran also denied engaging in direct negotiations with Washington, although reports suggest it is the discussion involving Iran and Oman over future shipping arrangements that could be finalised imminently.  The Iran-Oman agreement would see each country controlling different parts of the strait, thus leaving considerable control with Iran.  While the U.S. administration was not directly involved, it and its European counterparts had place considerable pressure on Oman to reach an agreement with Iran.

Despite these contradictions, financial markets responded primarily to the possibility that oil supplies may normalise.  The connection to gold is indirect but important.  Lower oil prices reduce inflation expectations, easing pressure on central banks to continue raising interest rates.  If inflation moderates more quickly than previously expected the case for additional Federal Reserve tightening weakens.  Once again, this reduces upward pressure on bond yields and improves the investment environment for precious metals.


Did a weaker US dollar add further support?

Outside America gold also benefited from renewed weakness in the US dollar.  The US Dollar Index recently traded near its lowest level in almost seven weeks, driven primarily by the Federal Reserve’s decision to leave interest rates unchanged and a decline in U.S. Treasury yields.  Coordinated efforts to support the Japanese yen occurred at the same time, adding to broader shifts in currency markets.  Because gold is priced globally in US dollars, any decline in the currency effectively reduces the purchase price for international buyers using euros, yen, yuan or Australian dollars.

A weaker dollar therefore tends to broaden global demand for physical gold, particularly among central banks and long-term investors already seeking greater diversification away from US financial assets.  While currency movements rarely determine the direction of gold in isolation, they often amplify existing trends already developing elsewhere in financial markets.


Are the short-term headwinds beginning to fade?

No single development explains gold’s overnight rally.  Rather, the move reflects several independent factors beginning to align.  Expectations of another Federal Reserve rate increase have softened following weaker labour market data.  Bond yields have eased accordingly.  Lower oil prices have reduced immediate inflation concerns, while a weaker US dollar has improved purchasing power for international buyers.

From a technical perspective, the recent price action is also becoming more constructive.  After correcting for much of the past seven months and spending July consolidating within a relatively narrow trading range, both gold and silver have begun showing signs that downside momentum may be easing.  Short-term moving averages have strengthened relative to their longer-term counterparts, a development technical analysts often interpret as an early indication that buying interest is improving.  Whether this ultimately develops into a sustained rally will depend on incoming economic data, Federal Reserve expectations and the evolution of geopolitical events.  For now, however, several of the factors that constrained precious metals throughout the first half of 2026 appear to be becoming less restrictive, providing a more supportive backdrop than investors have seen for some time.

Posted on

Why are Central Banks Still Buying Gold at Record Prices?

Only recently we examined the latest gold price forecasts from many of the world’s largest institutional banks.  While several expect a period of consolidation or modest weakness in the short term, they all maintain a forecast between USD $4,800 and $6,000 by year end.  At first glance, this appears contradictory.  If gold is expected to soften over the coming months, why do these same institutions remain so confident about its longer-term prospects?  The answer lies less with private investors and speculative traders, and more with the world’s central banks.  Unlike retail investors, central banks do not buy gold in response to short-term price movements.  They accumulate gold as part of a long-term reserve management strategy, often with investment horizons measured in decades rather than months.  As a result, their buying has become one of the most important structural forces supporting the gold market today.  Currently gold trades at AUD $5,828, silver at $82.80, and platinum at $2,307.72.


Central banks continue to buy gold at record levels

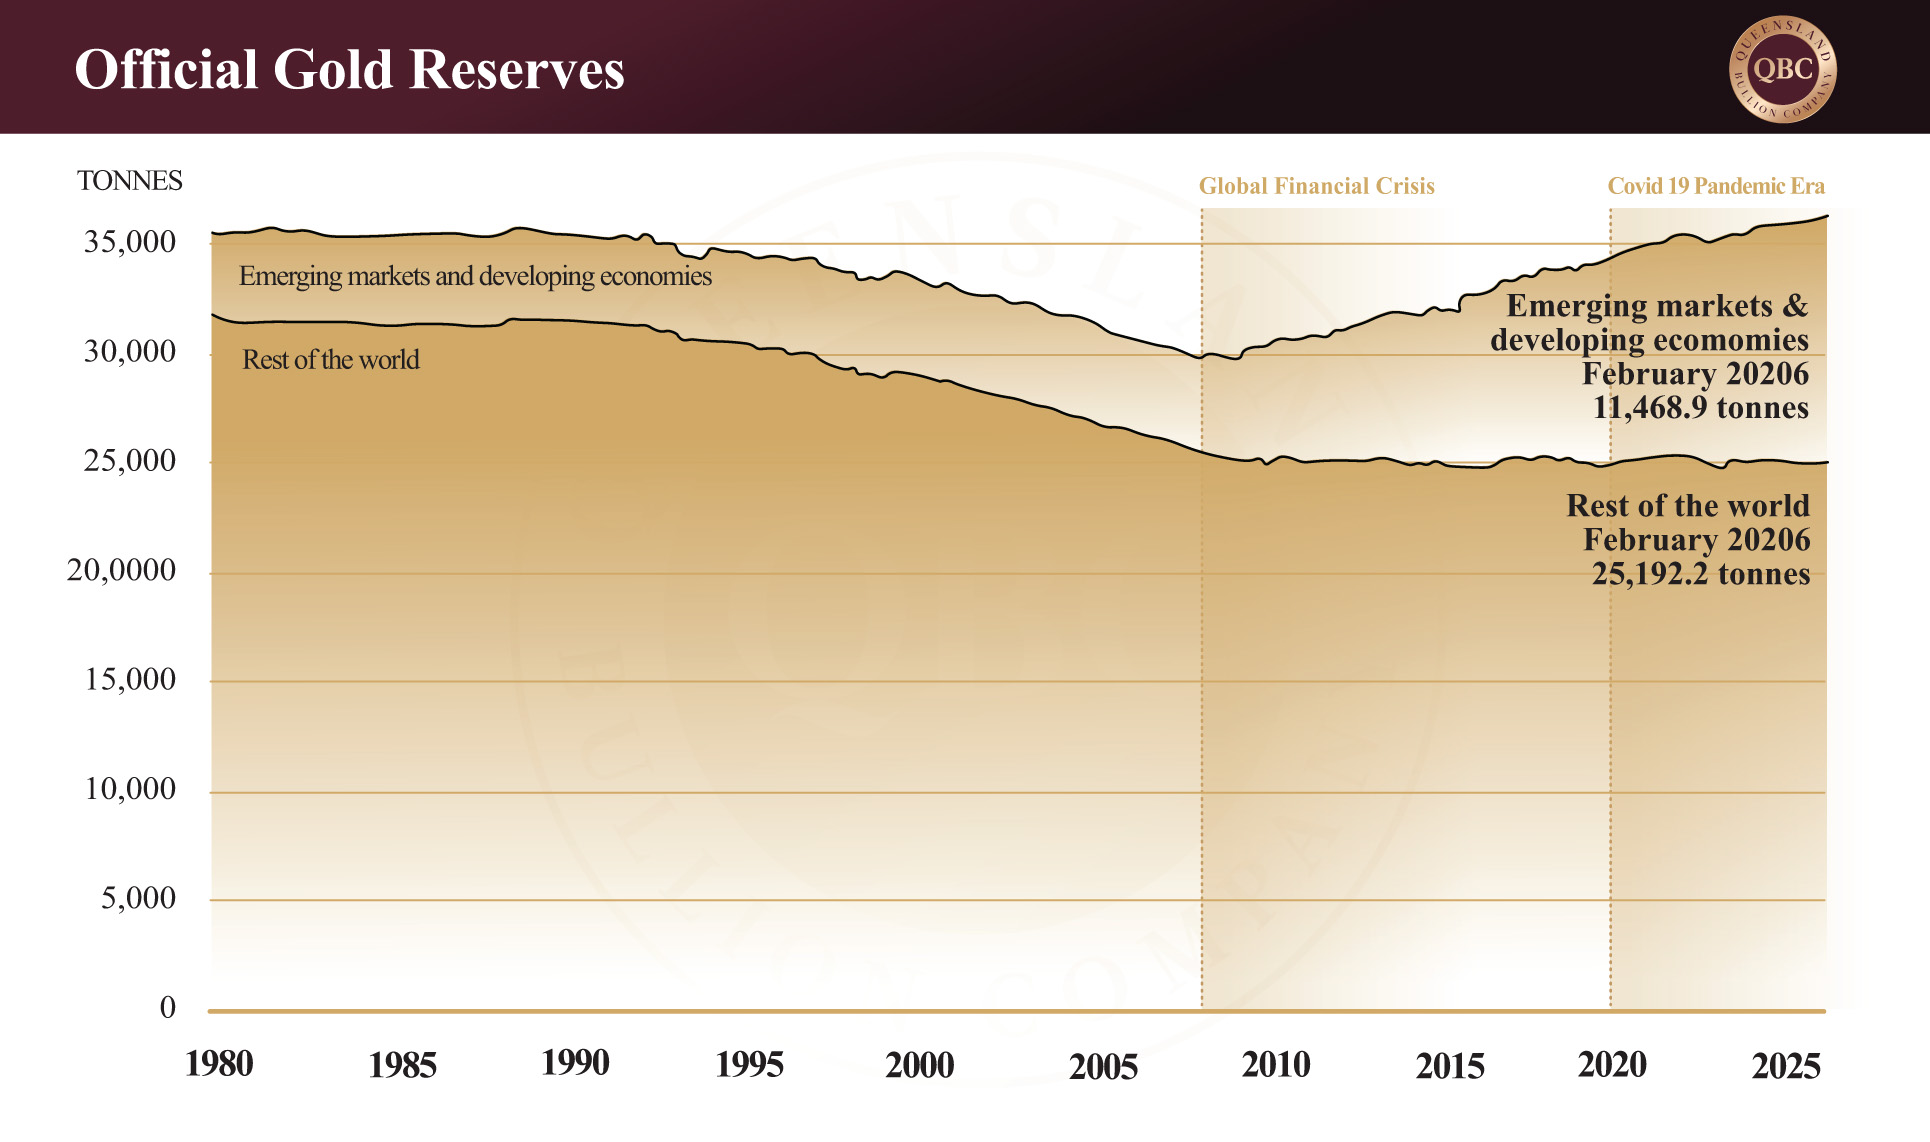
Central banks are among the largest holders of physical gold in the world.  Collectively, they own around one fifth of all the gold ever mined throughout history, making them one of the single largest sources of demand for the precious metal.  Far from reducing their holdings after gold reached record prices, central banks have continued to accumulate bullion at historically elevated levels.  According to the World Gold Council (WGC), central banks purchased a net 244 tonnes of gold during the first quarter of 2026 alone, a 3% increase over the same period last year despite significantly higher prices.

This follows several years of extraordinary buying.  Over the past four years, central banks have purchased an average of approximately 1,000 tonnes of gold each year, around double the annual average recorded during the previous decade.  This sustained demand has coincided with one of the strongest bull markets in gold’s modern history.  In 2025, total global gold demand exceeded 5,000 tonnes for the first time on record.  During the same year, gold recorded 53 new all-time highs and generated an unprecedented market value of approximately USD $555 billion.

While jewellery, investment and industrial demand all contributed to this outcome, central banks have increasingly become the market’s most consistent long-term buyers.

Gold has overtaken US treasuries as a reserve asset

Perhaps the clearest indication of changing attitudes toward gold comes from the composition of official reserve assets.  For decades, governments around the world relied heavily on US Treasury securities as one of the primary stores of national wealth.  Treasury bonds offered liquidity, security and the backing of the world’s largest economy.  That relationship is now changing.  According to the European Central Bank, gold accounted for 27% of official global reserve assets at the end of 2025 (central banks combined), overtaking US Treasuries which represented 22% of reserves.  The euro accounted for approximately 15%, while the US dollar itself continued to represent around 57% of global foreign exchange reserves.

Importantly, this is not a story about central banks abandoning the US dollar altogether.  Rather, it reflects an increasing desire to diversify reserve assets away from instruments that carry counterparty risk and toward assets that exist outside the global financial system.  Gold occupies a unique position in this regard.  Unlike government bonds, physical gold is no one’s liability.  The physical asset cannot be printed, defaulted upon or diluted through monetary policy.  For reserve managers seeking long-term stability, these characteristics have become increasingly valuable.


Why the weaponisation of the US dollar is changing Reserve Bank asset management

One of the most significant catalysts for central bank buying emerged following Russia’s invasion of Ukraine in 2022.  After Western governments imposed sanctions on Russia approximately USD $300 billion of Russian central bank reserves held overseas were frozen.  At the same time, Russia was excluded from the SWIFT international payments network, severely limiting its access to the global financial system.

While these actions were directed at a specific geopolitical event, they also demonstrated an important reality to reserve managers around the world.  Foreign exchange reserves held within another country’s financial system may not always remain accessible during periods of political conflict.  Physical gold is fundamentally different.  Gold stored within a country’s own borders cannot be frozen by another government, sanctioned by a foreign central bank or restricted through international payment systems.  For many countries, particularly emerging economies, this reinforced gold’s role as a strategic reserve asset rather than simply an investment.

The World Gold Council’s latest Central Bank Gold Reserves Survey reflects this changing mindset.  The survey found that concerns surrounding geopolitical instability, reserve diversification and sanctions have become increasingly important considerations when central banks determine the composition of their reserves.  Of the survey participants, 81% expected gold to hold a larger portion of the collective asset pool, while 74% expect the US dollar’s share of global reserves to lower over the next five years.


Emerging economies are driving central bank gold buying

Although central bank buying has become a global phenomenon, Emerging Markets and Developing Economies (EMDE) central banks have been among the most active purchasers.  Around 37% of EMDE central banks (surveyed by the WGC) reported “concerns about sanctions” or the “anticipation of changes in the international monetary system” as factors behind their decision to hold gold.  Since the 2022 Russia Ukraine War broke out, China has added more than 350 tonnes of gold to its reserves.  Poland has purchased approximately 320 tonnes, while India has added around 130 tonnes.  Türkiye also accumulated hundreds of tonnes before reducing holdings in early 2026 to assist with domestic economic pressures after the price moved higher.

The motivations behind these purchases become even clearer when further examining the World Gold Council’s survey data.  Among central banks in emerging and developing economies, 95% identified geopolitical instability as an important factor influencing reserve management decisions.  Inflation concerns were cited by 84% of respondents, while 60% highlighted the growing significance of trade conflicts and tariffs.  Each of these figures was materially higher than those reported by advanced economies.  These nations are not simply reacting to today’s gold price.  They are responding to a world that appears increasingly fragmented, where geopolitical relationships, trade policies and reserve management strategies are becoming more complex than at any time in recent decades.

Could central bank buying push gold to USD $8,000?

The influence of central bank buying can perhaps best be illustrated by Deutsche Bank, Germany’s leading international investment bank.  Rather than publishing a conventional price forecast, the bank modelled a scenario in which gold’s share of global central bank reserves increases from around 30% today to 40% over the next five years.  Under this assumption, Deutsche Bank estimated that gold could reach approximately USD $8,000 per ounce, representing almost 80% upside from current prices.  Importantly, the bank stressed that this is not an official price forecast, but a conceptual exercise demonstrating the potential impact of continued reserve diversification.  Since the Global Financial Crisis (GFC), central banks have accumulated more than 225 million ounces of gold, while official buying has expanded well beyond traditional purchasers such as China, Russia, India and Türkiye to include countries such as Kazakhstan, Saudi Arabia, Qatar, Egypt and the United Arab Emirates.  Add to this the fact that many European banks continue to accrue despite the phenomenal amount of legacy gold reserves already held.  Whether gold ultimately reaches USD $8,000 is almost beside the point.  The significance of the analysis lies in illustrating how continued central bank demand could become one of the most powerful long-term drivers of the gold market.


What central bank gold buying means for investors

Considering these circumstances many institutional banks continue to publish bullish long-term gold forecasts despite expecting periods of short-term weakness.  Short-term price movements are influenced by a wide range of factors, including interest rate expectations, inflation data, employment figures, currency movements and investor sentiment.  These influences can easily push gold higher or lower over periods of weeks or months.

However, central bank buying operates on an entirely different timeframe.  Reserve managers are making strategic decisions that may influence portfolios for decades.  Their purchases are driven by diversification, geopolitical considerations, financial stability and the preservation of national wealth rather than short-term market volatility.  While central bank purchases may moderate from the record levels seen in recent years, they are still expected to remain the market’s most reliable source of demand because concerns surrounding fiscal deterioration, currency credibility and reserve diversification remain firmly in place.

What does this mean for investors?  Short-term pullbacks should not necessarily be confused with deteriorating long-term fundamentals.  Daily market movements often reflect changing sentiment, while central bank buying reflects structural shifts occurring within the global financial system.  If the world’s largest and most sophisticated reserve managers continue increasing their exposure to physical gold despite record prices, it suggests they see the role of gold becoming more important, not less, over the years ahead.

That does not mean gold will rise in a straight line.  Markets rarely do; however, it does help explain why many of the world’s largest institutional banks remain comfortable forecasting periods of short-term volatility while simultaneously maintaining a constructive outlook over the next twelve months.  Sometimes the most important signal isn’t found in tomorrow’s price action, but in what the world’s central banks are quietly doing behind the scenes.

Posted on

The Everything Bubble: Why History Suggests Preparation Matters More Than Prediction

Every major financial bubble has its own story.  The Roaring Twenties were fuelled by electricity, the late 1990s by the internet, and the Global Financial Crisis (GFC) by an unsustainable housing boom.  Despite their different catalysts, each was driven by the same belief: this time is different.  Today, investors are embracing artificial intelligence (AI) with similar enthusiasm.  AI promises to reshape industries, boost productivity and transform the global economy.  At the same time, government debt has reached record levels, property prices are elevated once again, and financial markets have become increasingly concentrated in a handful of technology companies.

Gold currently trades at approximately AUD $5,811 per ounce, while silver sits near AUD $83.64 and platinum at AUD $2,318.67 per ounce.  Although metals have softened as bond yields and the US dollar strengthened, the broader economic backdrop raises an important question: are today’s markets resembling the conditions that preceded previous financial crashes?


How concentrated are today’s financial markets?

One feature shared by many financial bubbles is the growing concentration of wealth into a small number of market leaders.  Investors increasingly focus on first-generation companies expected to shape the future, often pushing valuations well beyond underlying fundamentals.  Today’s AI boom has produced similar conditions.  Amazon, Alphabet (Google’s parent company), SpaceX, Anthropic, OpenAI, in addition other heavy hitters such as Microsoft, and Oracle, have attracted hundreds of billions of dollars as investors position for what many believe will be the next industrial revolution.

Approximately one hundred years after the Roaring Twenties boom there are still echoes in the stock market sector for those who care to listen.  In October 2025, the ten largest US companies accounted for 37.7% of the entire stock market, surpassing the previous record of 37.3% reached in 1932.  Importantly, note that the previous record was not set during the boom itself but after the Wall Street Crash that caused the Great Depression.  The largest companies of the era did not collapse immediately.  As smaller initiatives failed investors sought the relative safety of established market leaders, increasing their share of the overall market before they too eventually succumbed to broader economic conditions.  If history offers any guide today’s concentration in the technology sector could become even more pronounced before the cycle ultimately turns.

Combined with elevated property prices, record government debt and expensive equity valuations, some analysts have begun referring to today’s environment as the Everything Bubble.


What can the Roaring Twenties teach us about today’s AI boom?

Nearly a century ago, electricity inspired the same excitement that surrounds artificial intelligence today.  Companies such as General Electric (appliances), RCA (radio) and AT&T (telecommunications) were viewed as the architects of a new economic era, transforming manufacturing, communications and everyday life.  As investors borrowed heavily on margin, valuations became detached from earnings and confidence replaced caution.  When sentiment finally turned in October 1929, the Dow Jones fell 25% in just four trading days.  The market continued to lose almost half its value by mid-November before ultimately declining 89% between September 1929 and July 1932.

The technology endured; the speculative excess did not.  AI is here to stay, but will its pioneering companies endure?


Are today’s AI leaders repeating the Dot-Com Bubble?

The internet boom (also known as the dot-com bubble) followed a remarkably similar path to the consumer euphoria experienced in the 1920s.  Investors abandoned traditional valuation metrics in favour of growth and market share, convinced that the internet had rewritten the rules of investing.  Between 1995 and March 2000, the Nasdaq increased fivefold before collapsing 76.8% over the following two and a half years.  Of the companies that dominated the market at the time currently only three remain relevant: Microsoft lost approximately 64% in the subsequent crash, Amazon almost 95%, and Oracle 80%.  Other companies such as Cisco, Intel, Dell, and eBay are still household names but they no longer command the same market influence as they did in the late 1990s.

One of the more striking parallels between the internet boom and today involves corporate confidence.  Near the peak of the dot-com bubble, Motorola issued USD $300 million of 100-year bonds, a decision now viewed as emblematic of peak optimism.  More than two decades later, Alphabet issued its own 100-year corporate bonds, attracting approximately USD $9.5 billion in investor demand.  Just as capital once flooded into companies expected to build the internet, today’s investment is concentrated in businesses building AI infrastructure.  The technology may change the world, but history suggests transformative innovation and speculative excess often arrive together.


Does banking and real estate still pose a threat to financial stability?

While technology stocks struggled after 2000, another bubble was developing elsewhere.  Between 2001 and 2005, roughly 40% of new private sector jobs in the United States were linked to housing as the real estate industry boomed.  Household mortgage debt rose from 61% of GDP in 1998 to 97% by 2006 as easy credit fuelled rapidly rising property prices.  When defaults began, liquidity disappeared and banks with loose lending and investment practices were put under strain.  When investment bank Bear Stearns collapsed in March of 2008 JPMorgan acquired it with the assistance of the Federal Reserve; next, Lehman Brothers filed for bankruptcy in September (traditionally “crash month” in the stock market), and immediately thereafter governments were forced into unprecedented bailouts to prevent a broader financial collapse.  When American real estate failed, it took the already shaky banking industry with it by default.

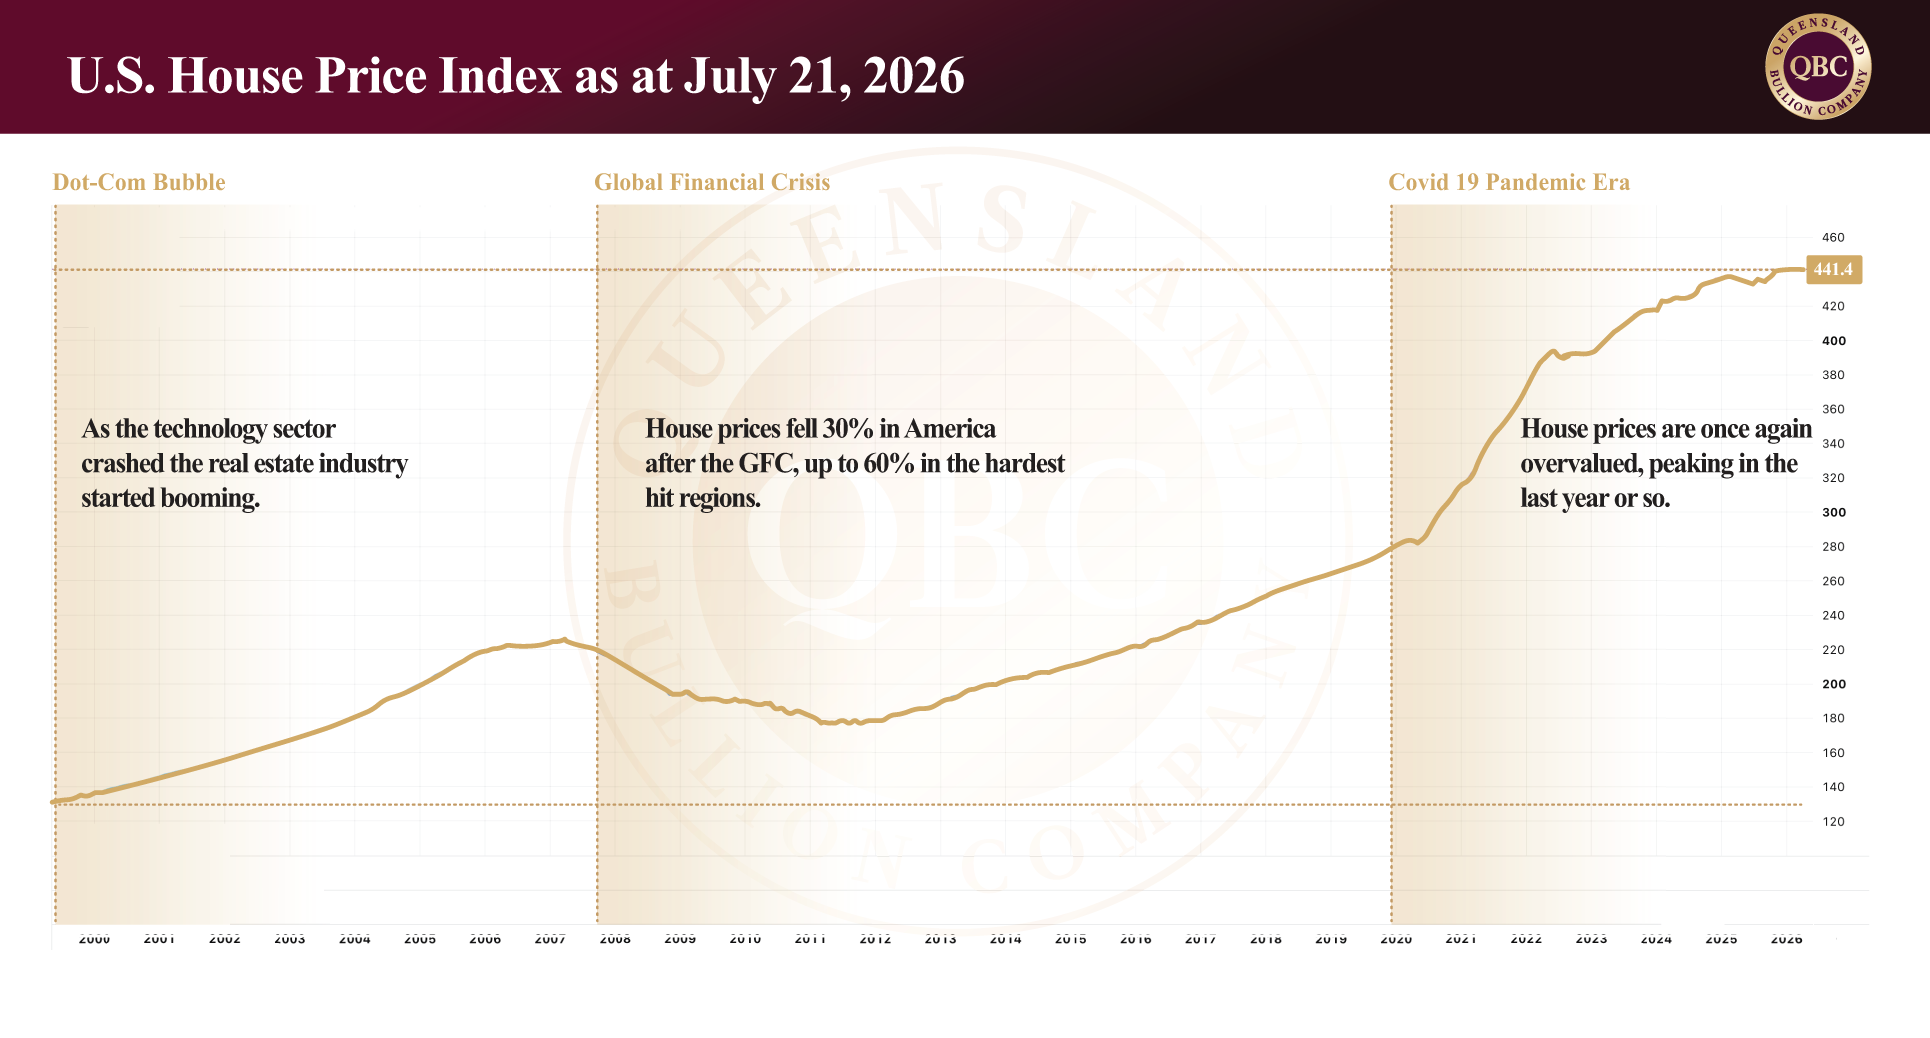
Once again, real estate appears overvalued.  In the United States, the median price of a single-family home is now more than double its 2007 level while all forms of income have contracted in 2026.*  Meanwhile, inflation has also steadily eroded purchasing power.  What cost USD $1.00 before the GFC now costs approximately USD $1.62.

Australia tells a similar story.  Since 2000, average wages have increased by around 40%, while residential property prices have risen by approximately 390%.  During the GFC, US housing prices fell between 30% and 60%, while Australia’s property market declined by just 8.5%, largely due to government intervention; however, with Australian property values having so significantly outpaced wage growth over the past two decades, questions remain about how sustainable current valuations are should economic conditions deteriorate.  Read more about Australian real estate and gold here.

Unlike 2008, however, today’s risks extend beyond housing and private banking to include record public debt, elevated equity valuations and slowing global growth.


Why are bond markets flashing warning signs?

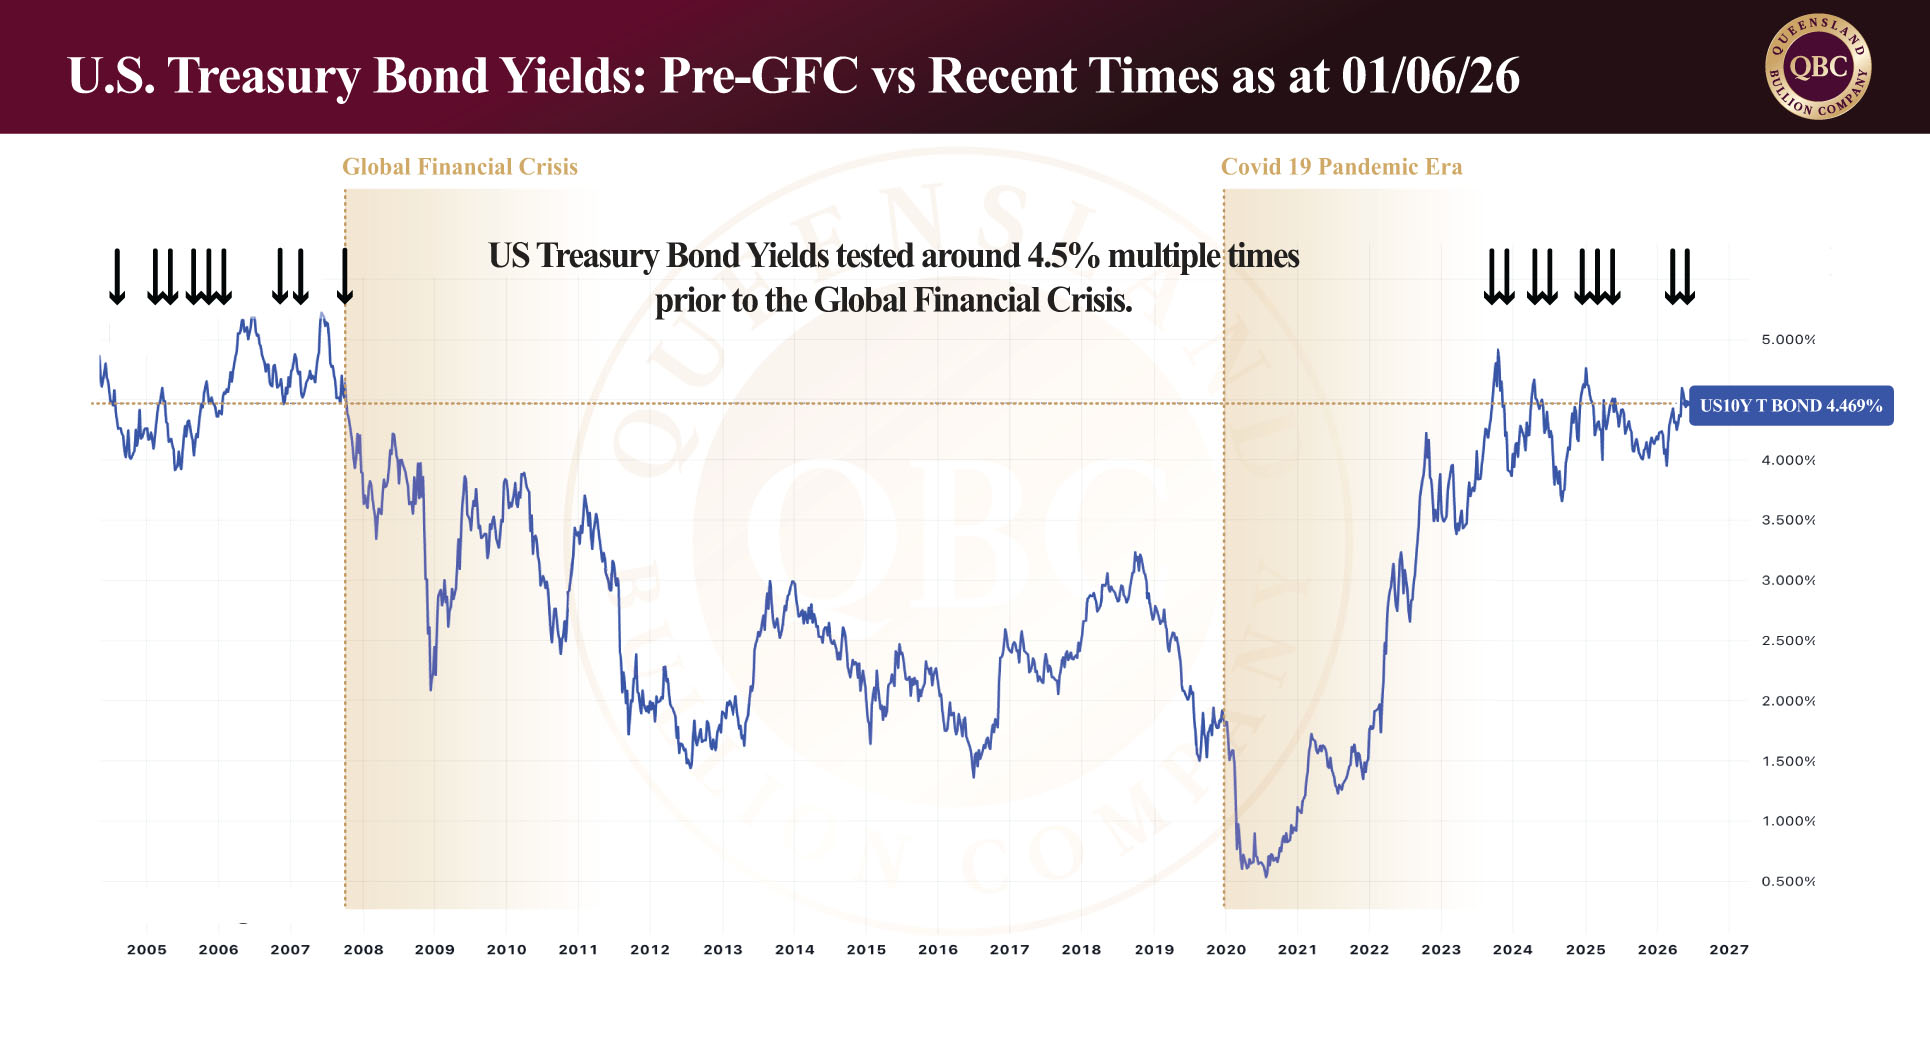
The bond market is also sending signals reminiscent of previous financial volatility.  The US 10-year Treasury yield has again reached levels (above 4.4%) not consistently sustained since October 2007, immediately before the GFC.  Interestingly, yields tested these levels multiple times during the three years leading into that crisis before broader financial stresses emerged.  Rising yields reflect growing concern over inflation, government borrowing and fiscal sustainability.  Years of quantitative easing and deficit spending helped stabilise economies through successive crises but also expanded debt and reduced purchasing power.  While history never repeats perfectly, periods of rising yields, tightening financial conditions and elevated asset prices have often preceded increased market volatility.

Read more about the graph above.


Does every bubble begin with the belief that this time is different?

Every financial bubble has been supported by a convincing narrative.  In the 1920s it was electricity.  In the late 1990s it was the internet.  Before 2008 it was housing.  Today it is artificial intelligence.  The difference is that today’s market combines elements of several previous cycles.  Record market concentration, revolutionary technological advancement, elevated property prices, expanding government debt, persistent inflation and geopolitical uncertainty have created conditions that resemble multiple historical bubbles rather than just one.  While none of this guarantees another financial crisis it does suggest investors should be cautious of assuming today’s risks are fundamentally different from those that came before.

Predicting exactly when markets will turn has always been difficult.  Preparing for uncertainty is far more practical.  History shows that by the time economic risks become obvious, defensive assets have often already repriced.  Insurance is rarely purchased after the event it is designed to protect against.

Recent weakness in gold and silver has largely reflected higher bond yields, a stronger US dollar and expectations that interest rates may remain elevated.  Yet the long-term drivers supporting precious metals remain intact.  For long-term investors, periods of softer precious metals pricing have often provided opportunities to either enter the market or build existing positions.  Certainly, Bank of America has called sub- USD $4,000 in gold an opportunity to dollar-cost-average.  Other investment houses have stated intentions to go overweight on gold again very soon.  History cannot tell us when the next correction will occur, but it consistently demonstrates that those who prepare before uncertainty emerges are often better positioned than those who wait for certainty to arrive.


Posted on

Why has gold softened in 2026?

At the time of writing, gold trades at approximately AUD $6,018, having retreated significantly from the record highs reached earlier this year.  Following one of the strongest annual performances in decades during 2025, the correction has understandably raised questions about whether the bull market has run its course.  The short answer, according to many of the world’s largest financial institutions, is no.

Rather than signalling a structural reversal, most institutional research suggests the recent weakness reflects a combination of higher bond yields, a more hawkish Federal Reserve, profit taking following gold’s extraordinary rally, and improving investor appetite for risk assets.  While these factors have weighed on prices in the short term, the longer-term outlook remains surprisingly consistent.  From the World Gold Council to central banks and major investment banks, the overwhelming consensus is that gold continues to occupy an increasingly important role within the global financial system.  And where gold goes, silver ( currently at AUD $89.93) and platinum (AUD $2,395) will follow.


What is the World Gold Council saying about gold?

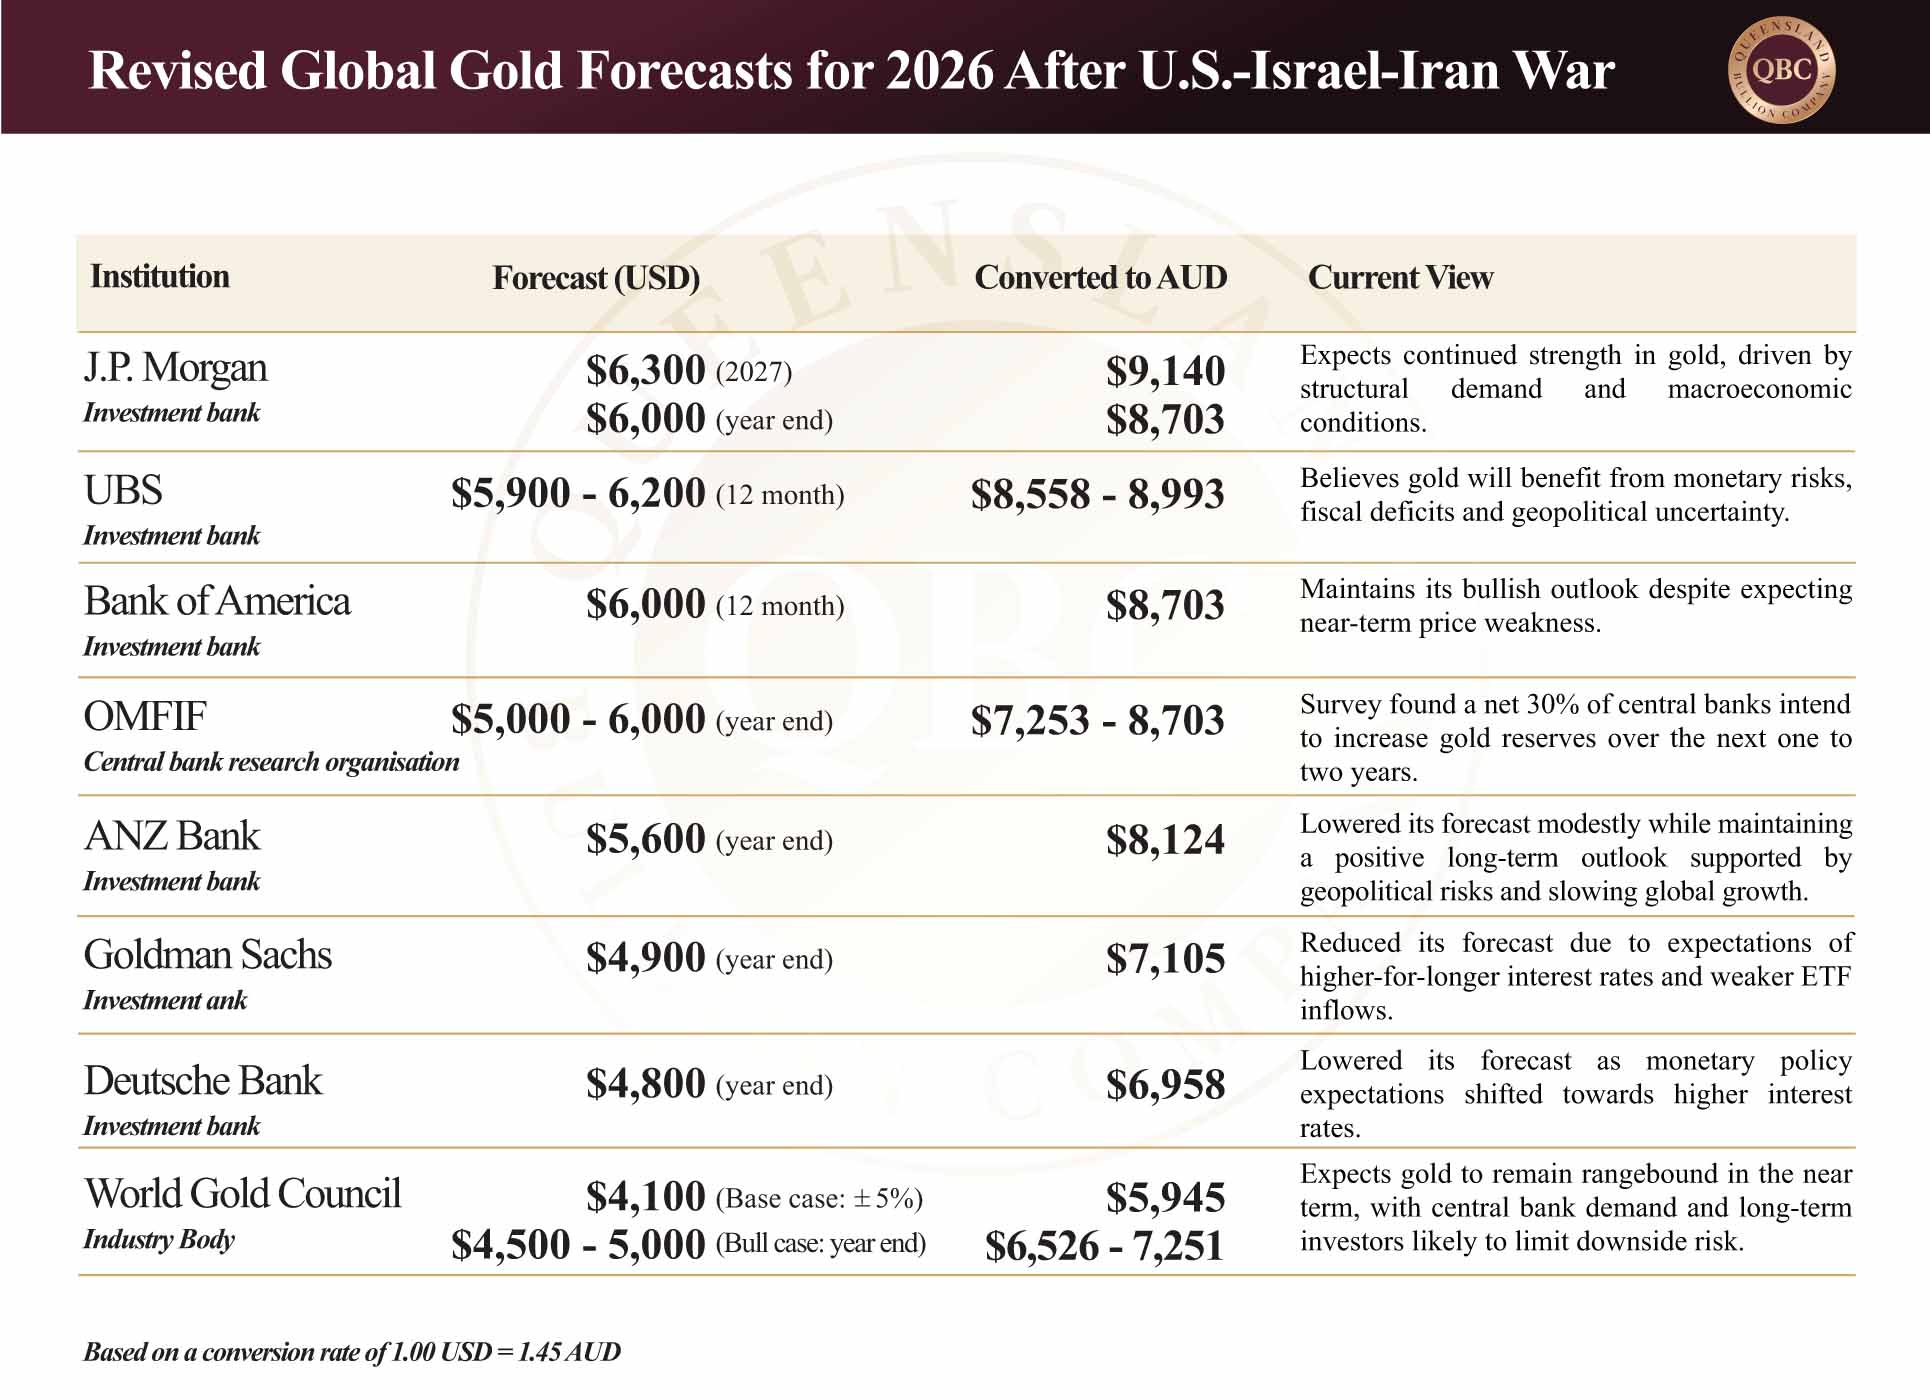
The World Gold Council (WGC) believes current prices broadly reflect today’s macroeconomic environment.  Its latest mid-year outlook describes an economy characterised by moderate growth, cooling but still elevated inflation, and expectations that central banks will maintain relatively tight monetary policy.  Under these conditions, the Council expects gold to remain broadly rangebound, fluctuating approximately 5% either side of USD $4,100 per ounce unless a new catalyst emerges.  Importantly, the Council does not view the recent correction as unusual.  Gold’s realised volatility briefly exceeded 50% during the escalation of the U.S.-Israel-Iran War before easing back below 30%.  While this remains above the long-term average of approximately 17%, history suggests these periods of elevated volatility are typically temporary and tend to moderate as markets stabilise.

The report identifies three potential catalysts capable of reigniting the rally: deteriorating economic or geopolitical conditions, lower interest-rate expectations, or renewed buying from long-term investors.  Under those circumstances, the WGC believes gold could recover towards USD $4,500 per ounce, with a move towards USD $5,000 possible if conditions deteriorate significantly.

On the downside, the Council acknowledges that higher bond yields, continued U.S. dollar strength and stronger investor confidence with a growing preference for risk-on assets could place further pressure on prices. Even so, it argues that declines beyond 10% to 15% from current levels would likely attract significant buying interest, limiting further downside.

Perhaps most notably, the Council highlights that much of gold’s recent buying has occurred during Asian trading hours, while many of the price declines have occurred during U.S. trading.  The observation reinforces the growing influence of Asian investors and central banks in determining gold’s long-term direction.


Why are central banks still buying gold?

If the World Gold Council provides the market’s assessment, central banks provide perhaps the strongest evidence of long-term confidence.  According to the WGC, official sector purchases have averaged approximately 1,000 tonnes annually since 2022.  Although some central banks temporarily reduced purchases or conducted gold swaps during the first quarter of 2026, the Council expects them to remain net buyers for the year overall.

Separate research from the Official Monetary and Financial Institutions Forum (OMFIF) reinforces this trend.  Surveying 74 central banks responsible for more than USD $10 trillion in reserve assets, OMFIF found that 82% currently hold physical gold, compared with 71% only a year earlier.  More significantly, a net 30% intend to increase their gold holdings over the next one to two years, making gold the most sought-after reserve asset among all investment categories surveyed.

The motivations are equally revealing.  Fifty-one percent of reserve managers cited geopolitical risk as a primary reason for holding gold, an increase of eleven percentage points from the previous year.  Eighty-five percent identified instability in the Middle East as the greatest geopolitical threat to reserve portfolios, while 81% highlighted uncertainty surrounding U.S. foreign policy.  Nearly 80% also believe the global monetary system is gradually evolving towards a more multipolar structure, increasing the appeal of reserve assets that sit outside any single country’s currency system.  Interestingly, 61% of reserve managers expect gold to trade between USD $5,000 and USD $6,000 per ounce within the next twelve months, despite prices already sitting near historically elevated levels.


What are major banks forecasting for gold?

 Commercial banks have become more cautious in the short term without abandoning their long-term outlook.  Goldman Sachs recently reduced its year-end 2026 target from USD $5,400 to USD $4,900 per ounce, reflecting expectations that the Federal Reserve will keep interest rates elevated for longer, limiting inflows into gold-backed exchange traded funds.  Deutsche Bank also lowered its fourth-quarter target from USD $6,000 to USD $4,800 per ounce for similar reasons; however, neither institution has abandoned its broader bullish view.  Bank of America continues to maintain a 12-month target of USD $6,000 per ounce despite acknowledging that prices may remain under pressure in the near term.  UBS expects gold to trade between USD $5,900 and USD $6,200, arguing that gold ultimately protects against the monetary consequences of conflict, including rising deficits, currency debasement and slowing economic growth rather than conflict itself. ANZ recently lowered its year-end forecast slightly to USD $5,600, while maintaining that geopolitical uncertainty and slowing global growth continue to support higher long-term prices.  J.P. Morgan remains among the most optimistic, forecasting gold could reach USD $6,000 by the end of 2026 and potentially USD $6,300 during 2027.

The revisions therefore appear less like a change in conviction and more like a recognition that higher interest rates are delaying, rather than preventing, the next stage of the cycle.

Is gold still in a long-term bull market?

The current environment presents two opposing forces.  On one side are higher bond yields, a resilient U.S. dollar and a Federal Reserve that continues prioritising inflation over economic stimulus.  These remain genuine headwinds for gold and help explain why prices have softened after their remarkable gains throughout 2025.

On the other side sit the longer-term structural drivers.  Central banks continue accumulating gold at historically elevated levels.  Reserve managers remain concerned about geopolitical risk, sovereign debt and the evolution of the international monetary system.  Commercial banks have trimmed their near-term forecasts, yet almost universally continue to expect substantially higher prices over the next one to two years.

The distinction is important.  Short-term price movements are often driven by monetary policy and investor positioning.  Longer-term trends are shaped by structural changes in the global financial system, and those changes continue to favour physical gold.  Markets rarely move in a straight line.  Gold is no exception.  Yet beneath the day-to-day volatility, institutional demand continues to suggest that the broader investment case for physical gold remains firmly intact.