Posted on Leave a comment

How the Bond Market Could Potentially Ruin Everything

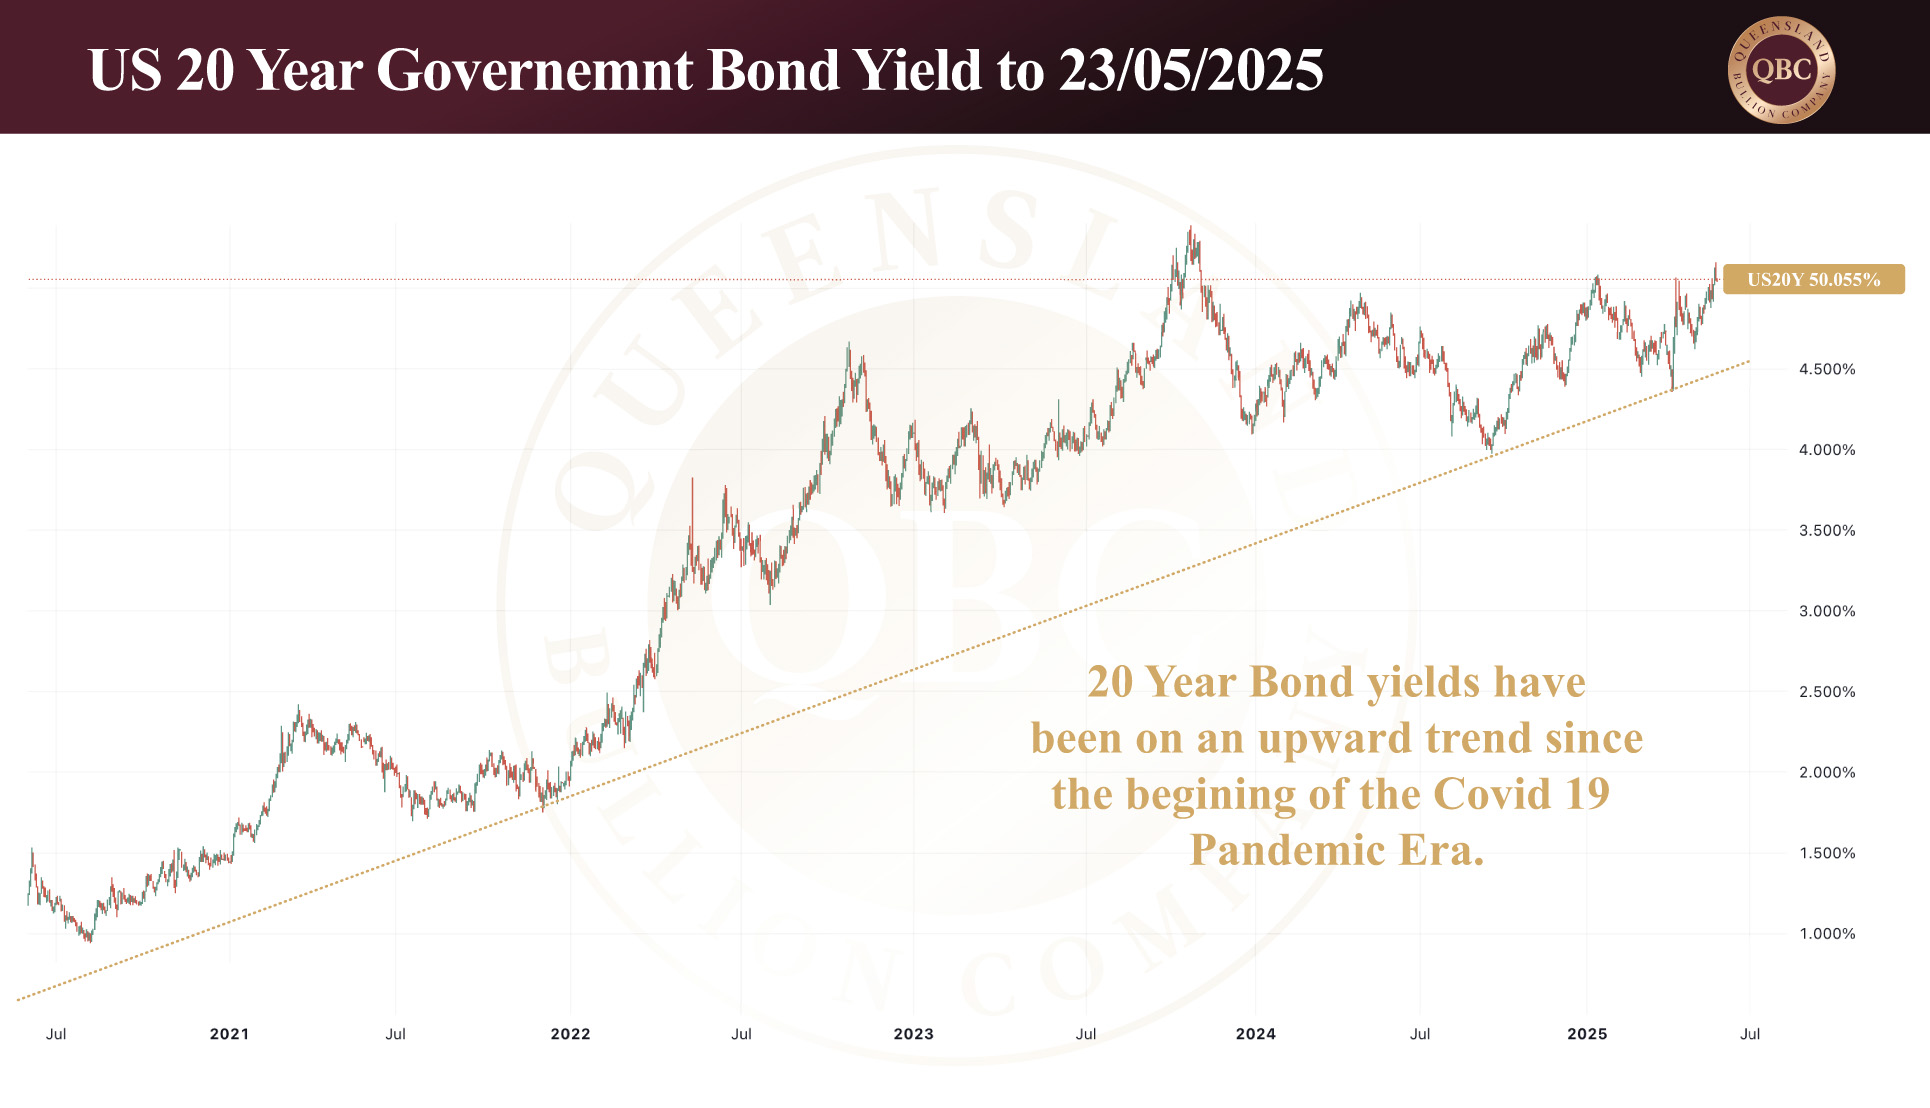
High bond yields are currently a hot topic as 20-year US Treasury bonds peaking over 5% yields  last week. With gold trading at AUD $5,154.73, silver at AUD $51.89, and platinum at AUD $1,680.62, it is a good time to pause and consider the wider implications of the international bond market—and how it could be the source of the black swan that astute investors is monitoring closely.

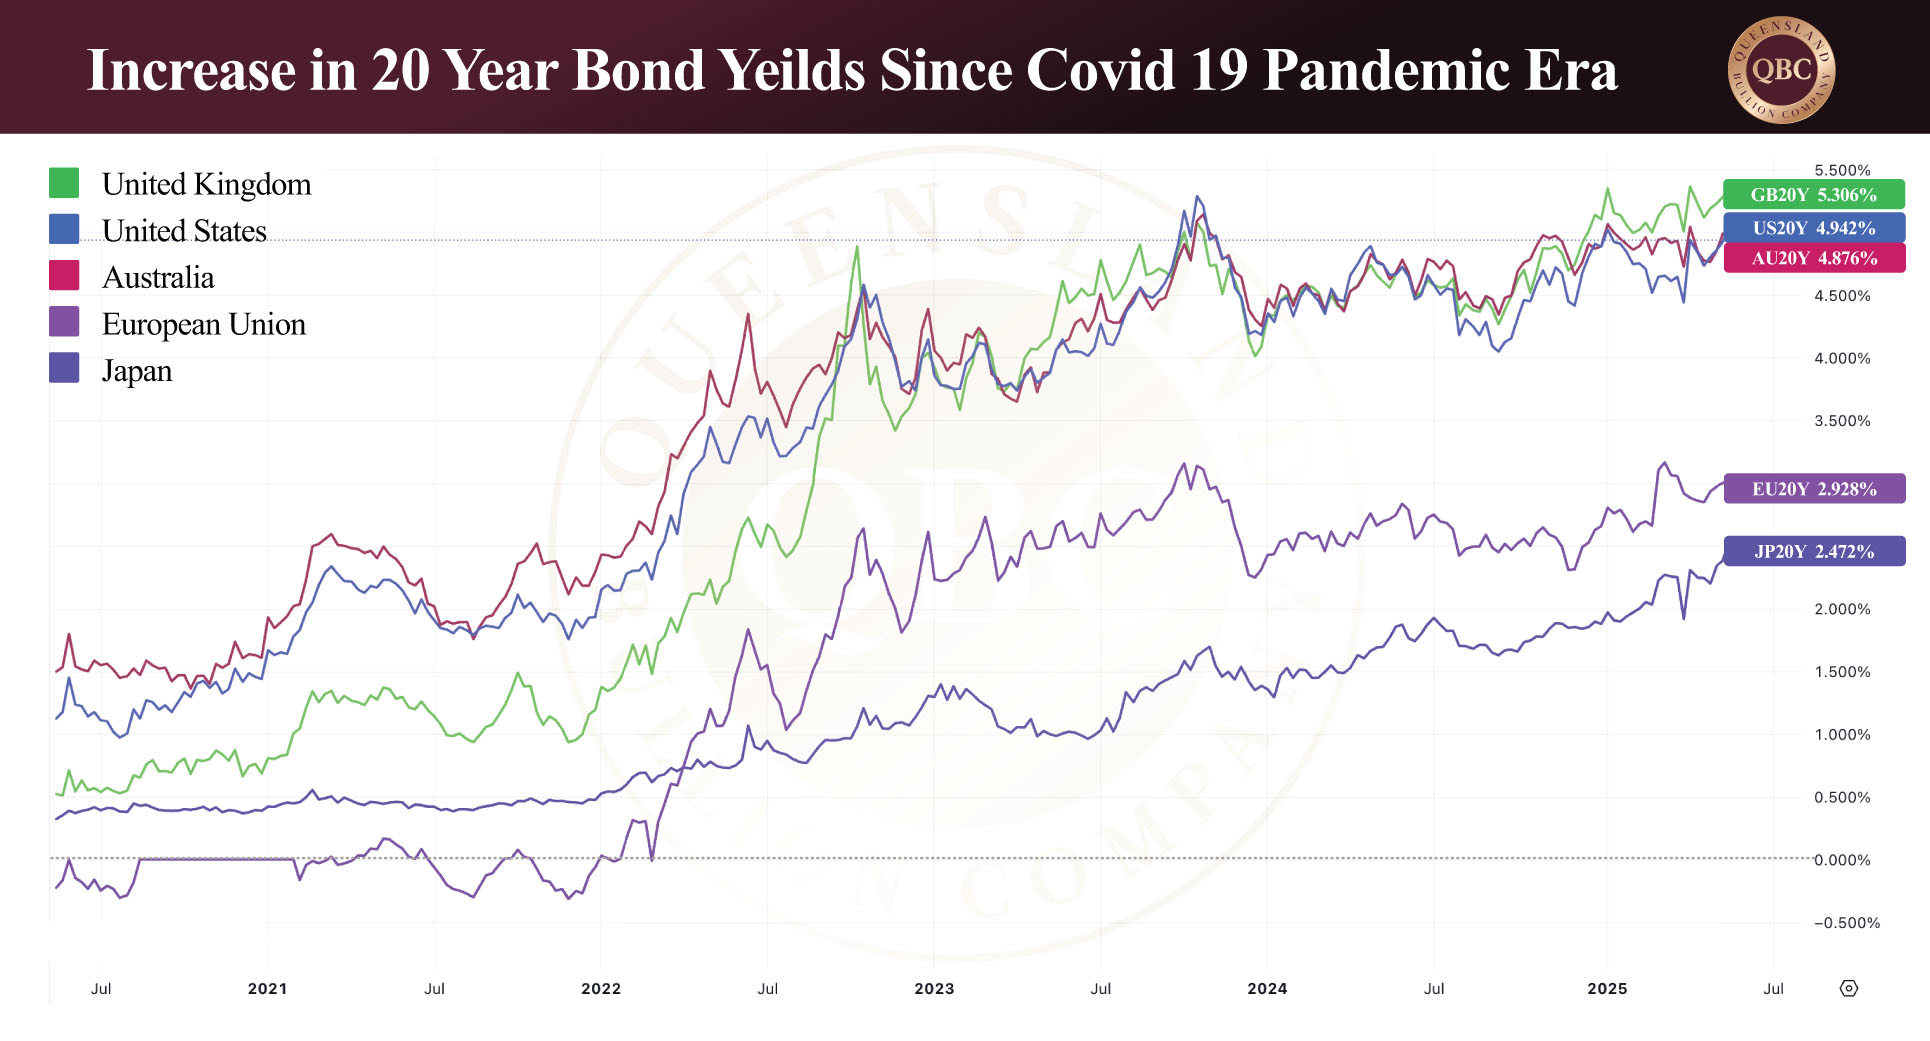
This article builds on last week’s discussion regarding bonds and margin calls. Find the full article here to follow the thread. To briefly recap: we explored how rising interest rates on US Treasury bonds (yields) indicate a lack of confidence in the government’s ability to repay debt, and how that concern eventually transfers to the private sector—specifically equity shareholders (investors in the stock market). Stepping back to view the bond market in the context of the international financial landscape, the picture becomes somewhat more alarming. Since the start of the Covid-19 Pandemic Era, bond yields have risen significantly—a marked indicator of how the market assesses the fragility of what is considered one of the safest assets in the world.

The graph below of 20-year government bond yields illustrates how the United States, Australia, and the United Kingdom have all had to increase returns significantly in order to attract investors to purchase government debt. This is an understated admission of risk being factored into doing business with governments that have, historically and perhaps technically, never defaulted—yet. What this graph shows is that lack of confidence is not limited to the United States; it is global, and rightly so.

Japan

Note on the graph that Japan fares the best. At first glance, this may appear to suggest sound financial management and investor confidence. But it is not, and here is why.

Japan’s debt-to-GDP ratio is one of the highest among developed nations, sitting at 263% and equating to USD $8.84 trillion (AUD $13.35 trillion). This is largely because approximately 38% of their population is over the age of 60. While this may imply wisdom, it also means Japan’s workforce has been in long-term decline. For governments, a large senior population and a shrinking working base means greater capital expenses and reduced collectable tax income. Japan has managed this by keeping interest rates at or near zero to attract investor capital.


Enter the yen carry trade

The yen carry trade is a financial strategy involving borrowing in Japanese yen at extremely low interest rates and using those funds to invest in higher-yielding assets abroad. For example, investors borrow yen, convert to USD, and purchase US Treasury bonds. Japan offers near-zero borrowing costs, while the United States offers high returns and an ironclad repayment history (including the ability to print money if required).

The problem arises when Japan’s bond yields begin to rise, signalling an increase in the Bank of Japan’s (BOJ) interest rates. Since 2016, BOJ maintained a negative rate of –0.1%, until 2024, when it began lifting rates to the current level of 0.5%. While still low by international standards, this has required major adjustments from investors using the yen carry trade.

Wouldn’t the higher yields from US bonds offset Japan’s rate hikes? In isolation, yes. But the complication comes from foreign exchange pressure: as Japanese interest rates rise, so does the strength of the yen relative to the US dollar. Investors who borrowed in yen now need more USD to repay their loans. This currency cost, combined with higher interest expenses, is forcing many to unwind their positions.


Yen carry trade: cause and effect

Japanese institutional investors (including banks, pension funds, insurers, and investment trusts) are the largest foreign holders of US Treasury bonds. They currently hold USD $1.13 trillion (AUD $1.71 trillion) in US debt. As the yen carry trade unwinds, the American government may have just lost its most important customer.

At the same time, the US Treasury just last night received USD $17.869 billion (AUD $26.96 billion) in offers to sell back bonds before maturity. Only USD $2 billion (AUD $3.02 billion) was accepted. This speaks volumes about the financial strain now facing the US government. If Japanese investors were not only to stop buying but to begin selling their Treasury holdings into the same market the US Treasury is attempting to sell into, it could spell pandemonium. A black swan event beginning in the bond market is no longer difficult to imagine.


What does this mean for gold?

As mentioned in our previous article, there are two ways this could unfold for gold. If bond yields continue to rise due to declining market confidence, bonds will dominate investor attention as a source of yield. In that scenario, gold may soften.

However, in a more probable and far-reaching scenario, bond markets around the world may destabilise. If that happens, gold is likely to surge as risk-averse capital floods into the precious metals sector. The real question is timing—something even the best among us cannot predict.

Posted on Leave a comment

Moody’s Downgrade and Market Reaction: Implications for Gold

Moody’s has downgraded the United States’ credit rating this week from AAA (negative) to AA1 (stable), and in doing so, put the stock market in a tailspin. The result for precious metals was an initial rise in value with a softening in prices overnight. With gold trading at AUD $5,160, silver at AUD $51.78, and platinum at AUD $1,706.57, it is difficult to predict what direction precious metals will take without assessing the role that American government bond rates have on the stock market, real estate, and consequently, gold and silver. After all, they all compete for the same market capital.


The downgrade and what it means

When Moody’s downgraded the US credit rating, it essentially reinforced the growing scepticism amongst investors of the government’s ability to pay back their debt. This is reflected in the recently auctioned 20-year Treasury bonds where investors held out for interest rates as high as 5.16%. To put this in perspective, the pre-Pandemic Era rate was only 1.19%.  While it is a great result for those investing in bonds, it has caused a significant pull back in equities.

How do bond rates affect equities? Simply put, the private sector needs to provide better financial yields than the government—and it’s not. With a perfect track record of paying debt (and the ability to print money), the government is seen as low-risk and reliable when it comes to honouring their treasury bonds—the mechanism by which they sell their debt. If confidence in the government’s ability to do so is compromised, then the market dictates a higher interest rate for returns prior to purchasing to reflect any perceived risks.  This is what unfolded in the last week.

On the other hand, the private sector (stock market) is seen as a higher risk when it comes to investing. It generally must provide higher returns than government bonds to attract capital. Stock dividends are set according to free cash flow. Hence, the only way to secure higher yields than those investing in bonds is to wait for the value of the shares to drop while dividends remain the same. The result is that investors pause their equity purchases and the stock market dips—just as it did this week as the Dow Jones Industrial Average (DJI) sank more than 800 points, or nearly 2%.


Margin calls

At this point, it could be argued that it’s a win/win situation. Bond holders have secured higher interest rates and equity investors better value; however, the point of contention has simply been moved onto the publicly traded companies. If the value of their shares goes down, so does the asset that the investor relies on for funding. As asset values decrease, the potential result is a margin call from the investor’s financiers wherein they may be obliged to sell off assets to close their position.

The swift selling of assets in such a fashion is what preceded the Global Financial Crisis (GFC), and this is the underlying concern regarding high Treasury bond interest rates. It is market mechanisms that dictate bond interest rates and share prices—not the government or the Federal Reserve. Ultimately, both must give in to the market or risk catastrophic financial pain.


Where does this leave gold?

There are two ways this can play out for gold. If bond yields remain high, then the price of gold may soften as it competes against bonds for capital.  By this we mean, that investors may obtain government debt with a higher interest rate which may be more beneficial than an asset increasing in value. However, when American bond yields are high, they are usually accompanied by a stronger Greenback. Also, if the underlying cause drivers are fiscal stress, credit worries or persistent inflation fears, real yields actually stay depressed, allowing gold to hold ground or rally. The implication for Australian investors is that it could potentially signal a higher value of gold in local markets.

However, fundamentally the Western financial system is far from healthy. Read about factors that play into this—such as inflation and the Fed’s balance sheet, overvaluation of stocks and real estate, and the repatriation of gold—in our previous articles. If bond yields normalise and the status quo is re-established, then eventually the West will have to take its medicine and deal with these systemic failures. If the price remains soft, consider it a perfect time to hedge against financial uncertainty by investing in gold.

Posted on Leave a comment

Gold: Short-Term Pullback vs Long-Term Gains

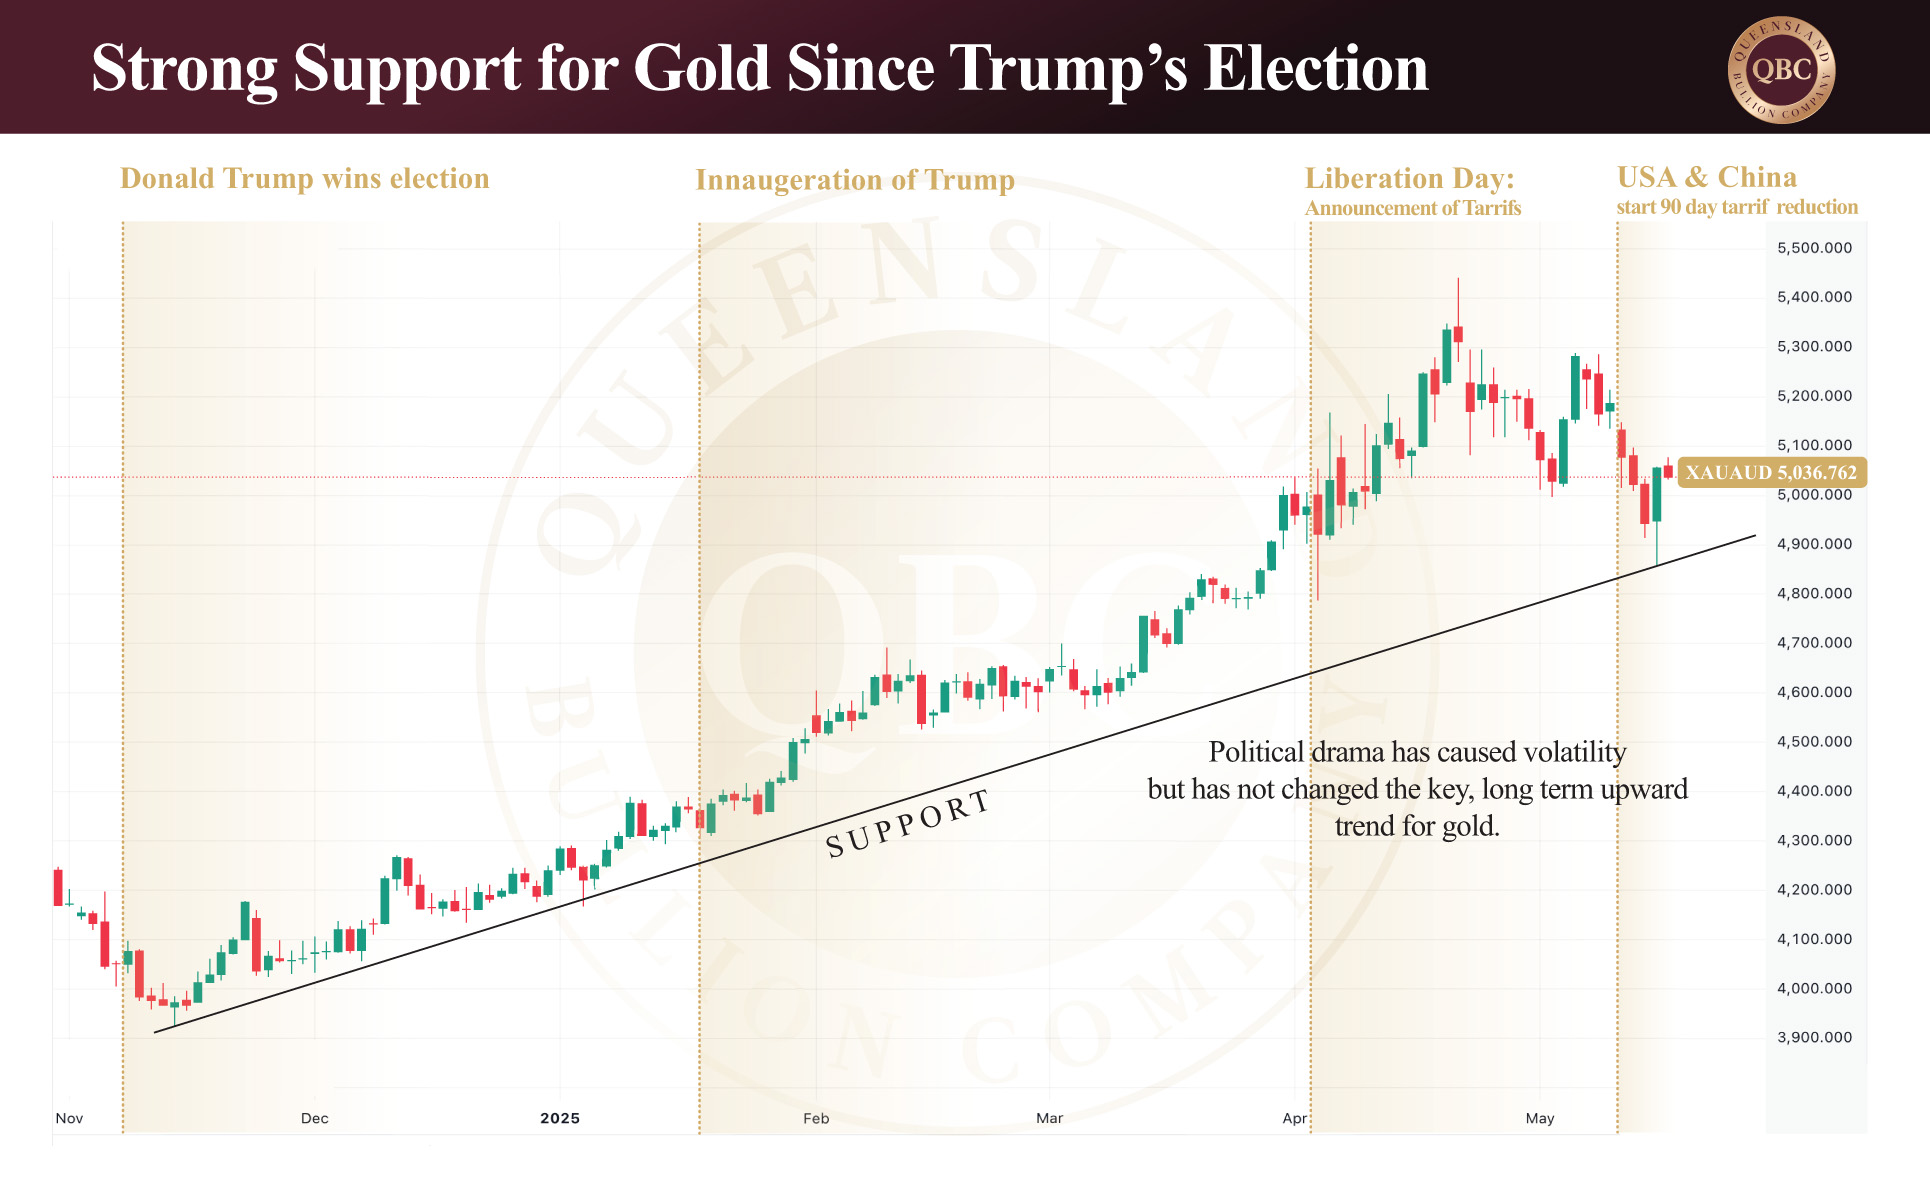
Gold has endured a turbulent stretch since President Trump’s recent “Liberation Day” announcement, where tariffs firmly took centre stage. Market reactions have been sharp, with policy decisions driving short-term volatility. In Australia, gold touched a low of AUD $4,865 before rebounding overnight, and is currently trading at AUD $5,010 (USD $3,340). Silver is sitting at AUD $50.66 (USD $33.75), and platinum at AUD $1,542 (USD $1,028). The rally appears largely driven by the strengthening Australian dollar against the U.S. dollar, reinforcing the critical role currency plays in local bullion pricing.

From one angle, it seems as though President Trump can shift markets with a single press conference—sending both institutional and retail investors into rapid response mode; however, when viewed from a broader perspective, this behaviour has not fundamentally changed the gold price. In fact, today’s price levels are consistent with those seen in early April. What is the net result? Heightened volatility, but little change in overall valuation.

Much of the financial media continues to focus on the threat of a trade war, but the underlying question is whether this truly impacts gold’s trajectory—or simply fuels the broader financial noise. Technically, the recent drop in price tested long-term support and bounced back convincingly. As the accompanying chart shows, the overall trend remains upward. If support holds, there’s little technical justification for a sustained reversal to the downside at this stage.

Beyond short-term price moves, several longer-term fundamentals continue to support gold’s positive outlook. Firstly, there is growing pressure from the U.S. administration on the Federal Reserve to cut interest rates—raising concerns over the Fed’s independence. A key indicator of confidence in the Fed is the yield on treasury bonds, which currently stands at 4.42%. Comparatively, this is an expensive rate. Rising yields typically reflect declining trust in the Fed’s repayment capacity. If confidence collapses, the risk of a deeper systemic issue in the U.S. financial system increases—something with global implications.

Secondly, inflation has not been resolved. Although it cooled slightly in April, with U.S. Consumer Price Index (CPI) now running at 3.2% year-on-year, it remains well above healthy levels. If a significant correction occurs, authorities will face two choices: stimulate with more quantitative easing—pushing inflation (and gold) higher—or accept the pain of a hard landing. Given political reluctance for short-term hardship, the former remains the likelier path.

It is also important to occasionally decouple gold’s performance from U.S. dollar bias. As shown in the above chart (based on AUD pricing), gold remains in a firm uptrend. This holds true across other major metrics too, including the Euro and the World Currency Unit (WCU), a GDP-weighted composite of the world’s top twenty economies. In all cases, support levels remain intact, which underscores the metal’s strength on a global scale.


Posted on Leave a comment

Opportunity Costs and Asset Class Investment

On the back of the US Federal Reserve holding rates steady and the announcement of the post-Brexit US-UK Accord gold has experienced a drop in value of 1.87%, while silver has decreased 0.64%.  Notably, gold has still gained upwards of 45% over the last twelve months with silver also gaining more than 18%.  With gold currently trading at $5,198.31, silver at $51.07, and platinum at $1,538.49, in addition to the significant volatility seen so far this year, it is timely to explore the concept of Opportunity Costs in the context of asset class performance.  A foundational understanding can be integral in developing wealth-building strategies when it comes to timing exits from one asset class and entering another and more.


What is Opportunity Cost?

Simply put an opportunity cost is the potential benefit of one option an investor may forfeit when choosing to invest in another.  It is the loss of the opportunity that was left on the table in favour of a different one.

When working out opportunity costs a simple formula can be applied:

Clearly, when choosing which option to invest in there is no absolute certainty because forecasting relies on estimates and assumptions.  However, factoring in opportunity costs can generally make for more informed decisions.

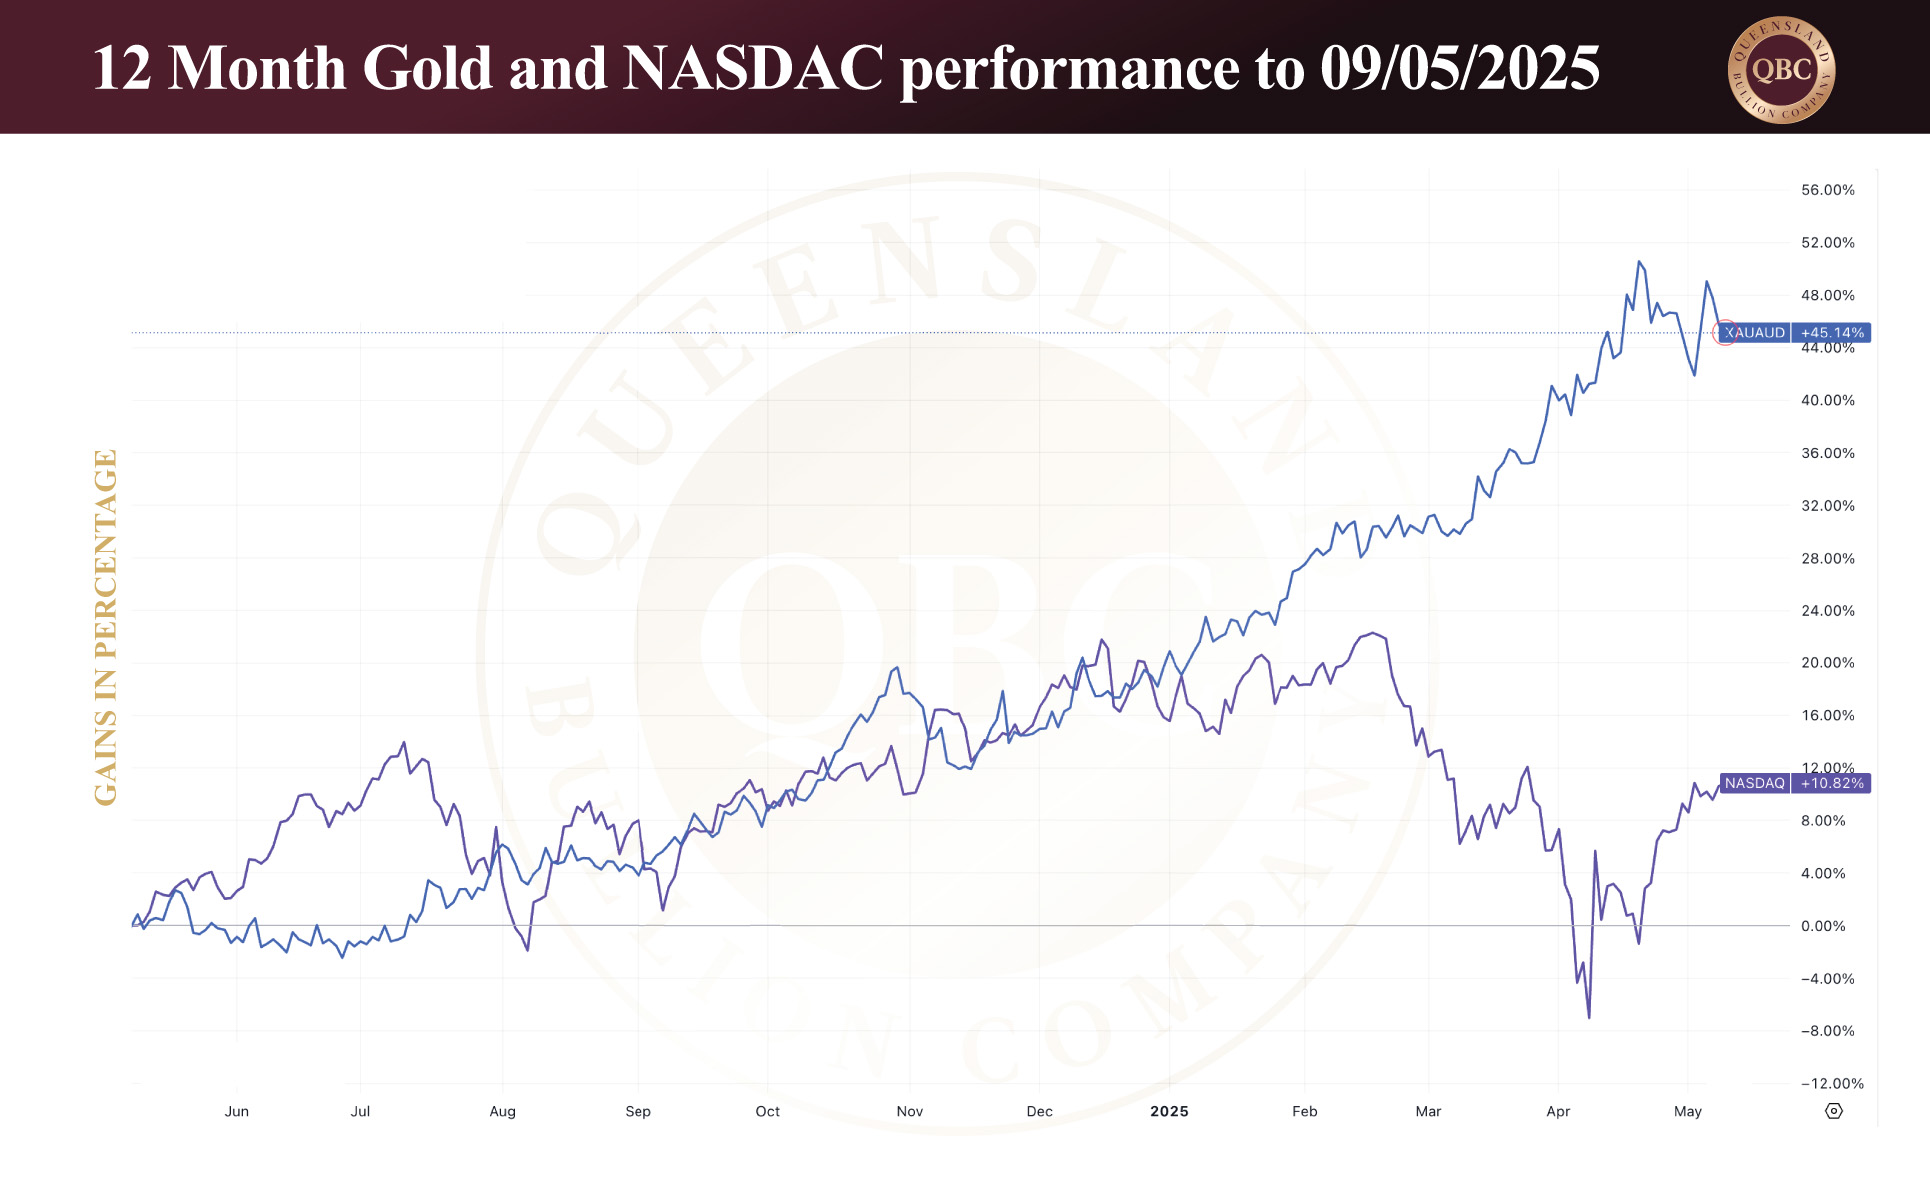
So how does this play out in the context of current events and asset classes? Let us compare technology stocks via the NASDAQ top 100 companies and gold over the past twelve months.  The chart below illustrates that in this time the NASDAQ has gained 10.84%.  On the other hand, gold has gained 45.04%.  Let us assume $10,000 was invested in tech stocks during this period. The investor would have made $1,184 in gains.  This presents well until the opportunity cost of investing in gold is considered.  If the investor had chosen gold instead of a tech stock they would have made $4,504.  Therefore the opportunity cost of choosing a tech stock over gold is $3,320 (the profit they forfeited). Said in terms of percentages, the opportunity cost was 34.2% (45.04 – 10.84 = 34.2%).  Playing this out as part of the decision-making process could have redirected the investor to make more profits by diverting the capital to gold instead of tech stocks.

Asset shifting and net purchasing power

The benefits of working out opportunity costs is now evident.  Let us extend this further and consider what happens during a stock market crash and the inevitable asset shifting that occurs.  Ultimately, all asset classes such as real estate, stocks and precious metals, compete for the same capital in every investor’s pocket.  Before a crash there are usually one or more asset classes that are overvalued; currently this would be the stock market (tech stocks in particular) and the real estate market.  When these markets crash, generally all asset classes plummet due to the extreme volatility.  In the markets that are overvalued, investors wish to preserve their gains and usually sell their assets as fast as possible, hence exacerbating the crash.  If they reinvest in a different asset class it is called asset shifting.  At this point many investors have exited the overvalued asset and now hold cash, looking for the next place to invest their wealth.  Because it is a safe haven asset, gold has historically been the asset to invest in for such circumstances. This is why gold bounces back and experiences a a quicker recovery after a crash.

Consider, now, cost opportunities during these times when all markets pull back.  While it is still an exercise in forecasting, assumptions and estimates, it suddenly became a little more complicated.

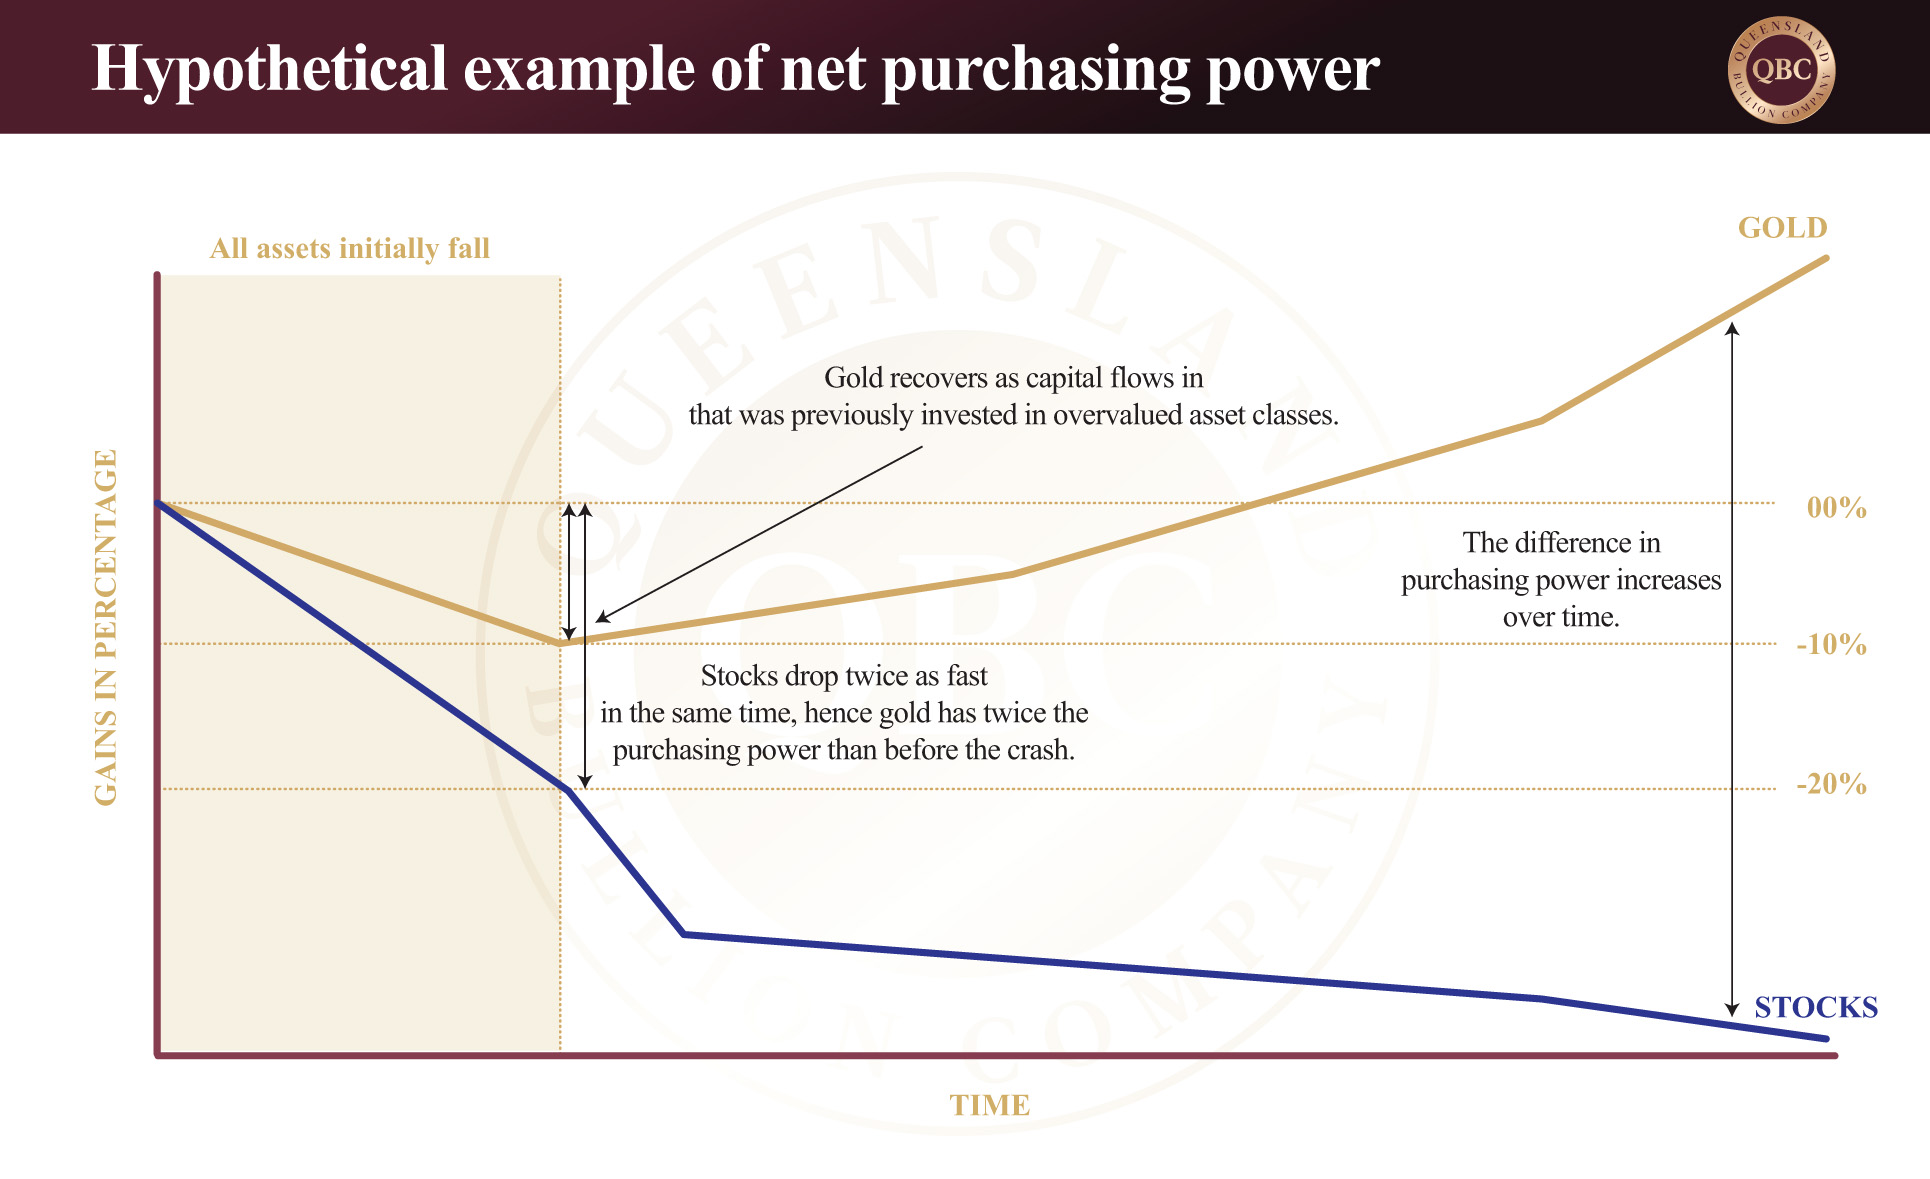
As a hypothetical example, gold may drop 10% at the beginning of a crash before it recovers.  At first glance it appears as if value has been lost.  But if stocks drop 20% in the same time then the purchasing power of gold is twice that of before the crash.  From the perspective of purchasing power gold is the better investment even though it has lost value.  When the value of gold starts increasing due to inflow of capital previously invested in an overvalued market the difference in net purchasing power becomes increasingly pronounced.  The below graph illustrates how net purchasing power is more important than the value of an asset.

Conclusion

In summary there are various factors that investors need to consider when developing an effective wealth creation and preservation strategy. Potential cost opportunities and net purchasing power are two that forms a well-constructed plan.  Knowing some history on the asset classes and how they perform in economic cycles is also essential.  Review our previous articles to learn more about economic cycles and how asset classes respond to the current market conditions.

Posted on Leave a comment

When Will the Silver Squeeze Begin?

There has been an acute focus on gold as it continues its winning streak of over 18% gains since the start of the year.  Even the recent pullback in the last few days is not enough to alter most investor’s bullish outlook for gold this year.  With the price currently trading at $5,077, silver at $51.04, and platinum at $1,530, this sentiment is understandable.  Even the World Bank has asserted that gold will be the standout asset in the commodity space for the next two years.

So where does this leave silver?  While the World Bank anticipates a 16.7% increase in the average price for silver this year compared to last, it is not quite the 36% increase they have assigned to gold.  In publishing these figures the World Bank has pivoted 180 degrees in saying that gold will now outperform silver.  This article will address a singular question that we hear almost daily from clients, “Why isn’t silver keeping pace with gold?”  The short answer is simply that, historically, it is not the right time yet.


Exposure to global economies

One of the most significant appeals regarding silver is its dual application of having industrial demand as well as being a store of wealth.  Over 55% of silver demand derives from the industrial sector, unlike gold which currently has demand of only 10%.  While such a high industrial demand builds in a natural price support that will likely increase in time it also exposes the it much more to the ebbs and flows of global economies and growth.  Therefore it is natural for the price of silver to remain more sluggish during times of global economic slowdown- consumer demand softens which in turn decreases the demand for silver thus affecting price to a degree. For example, the largest demand for silver is for use in solar panels; if global consumer demand for these soften so does the demand for silver.  On the other hand, one of the reasons that gold is a true safe haven asset is precisely because its exposure to industrial demand is limited.  The point is that it is acceptable for silver prices to lag behind gold at this stage of the economic cycle.

Gold generally runs first.  Will silver always lag behind gold?  No.  As retail investors are priced out of gold expect them to start investing in silver in a big way.  This is one reason why, on a percentage basis, gains in silver could sling shot up to overtake gold.  Add increased industrial demand and silver has two independent reasons as to why it will not flatline forever.


Timing the market

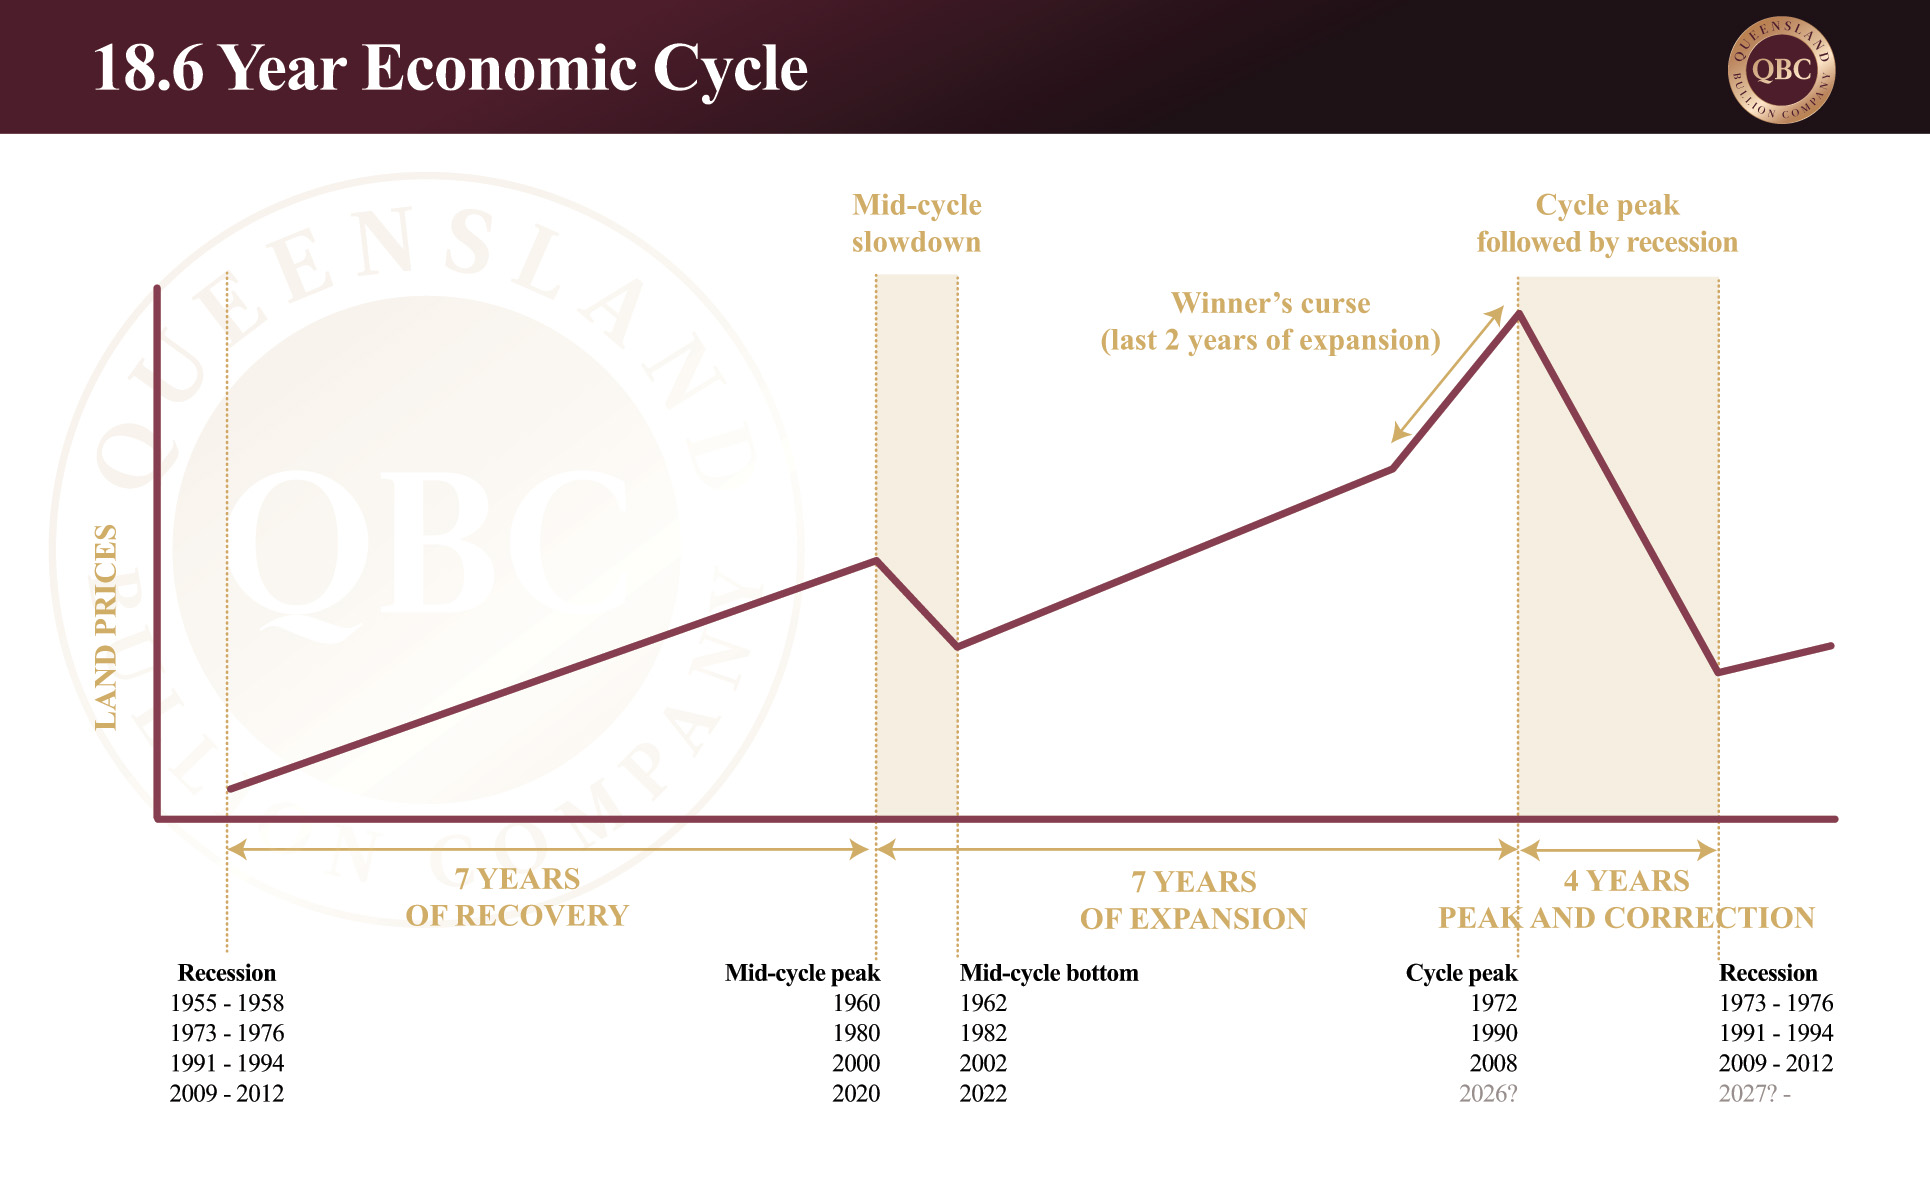
Let us consider silver’s plight in the context of financial cycles and other asset class performances.  The 18.6 Year Economic Cycle is a well-established pattern that has been observed for over 200 years.  The timing is generally reliable but the factors that allow it to play out can be as varied as any black swan event imaginable.  In essence the cycle comprises of fourteen years of economic growth which is followed by four years of contraction.  The fourteen years of growth can further be divided into two sets of seven-year growth periods that feature a mid-cycle slowdown between them.  The first is a recovery phase after the contraction of the last cycle and the second being more expansive and aggressive.  Below is how the cycle presents in principle.

This financial cycle is due to end soon with the last four years of contraction that usually leads to recession almost upon us.  If we study the last twenty-five years, we can see that the dot-com boom and bust of the year 2000 fits neatly into a mid-cycle peak and slowdown.  After the dot-com bubble the Global Financial Crisis (GFC), being largely a real estate bubble, was the next major financial shakedown- this crash marks the same cycle’s main peak and following four years of correction.  Moving to more recent times, the Covid 19 Pandemic Era aligns with the current cycle’s mid-cycle slowdown when we did experience a short recession.  And we are currently in what is known as the Winner’s Curse, the last two years of the final expansionary phase and a dangerous time to be purchasing property (and some stocks) as an investment asset.

As mentioned in our article, Stocks, Real Estate and Precious Metals, the current cycle’s peak is manifesting in a combined real estate and stock market bubble (think dot-com and GFC together), and the current overvaluation of inventory in both sectors is nothing short of scary and stunning, somewhat resembling a house of cards in a slight breeze.  The only factor overshadowing this is that, according to the 18.6 year economic cycle, we are on the verge of that slight breeze turning into gale-force winds as the house of cards tumbles and the correction begins.

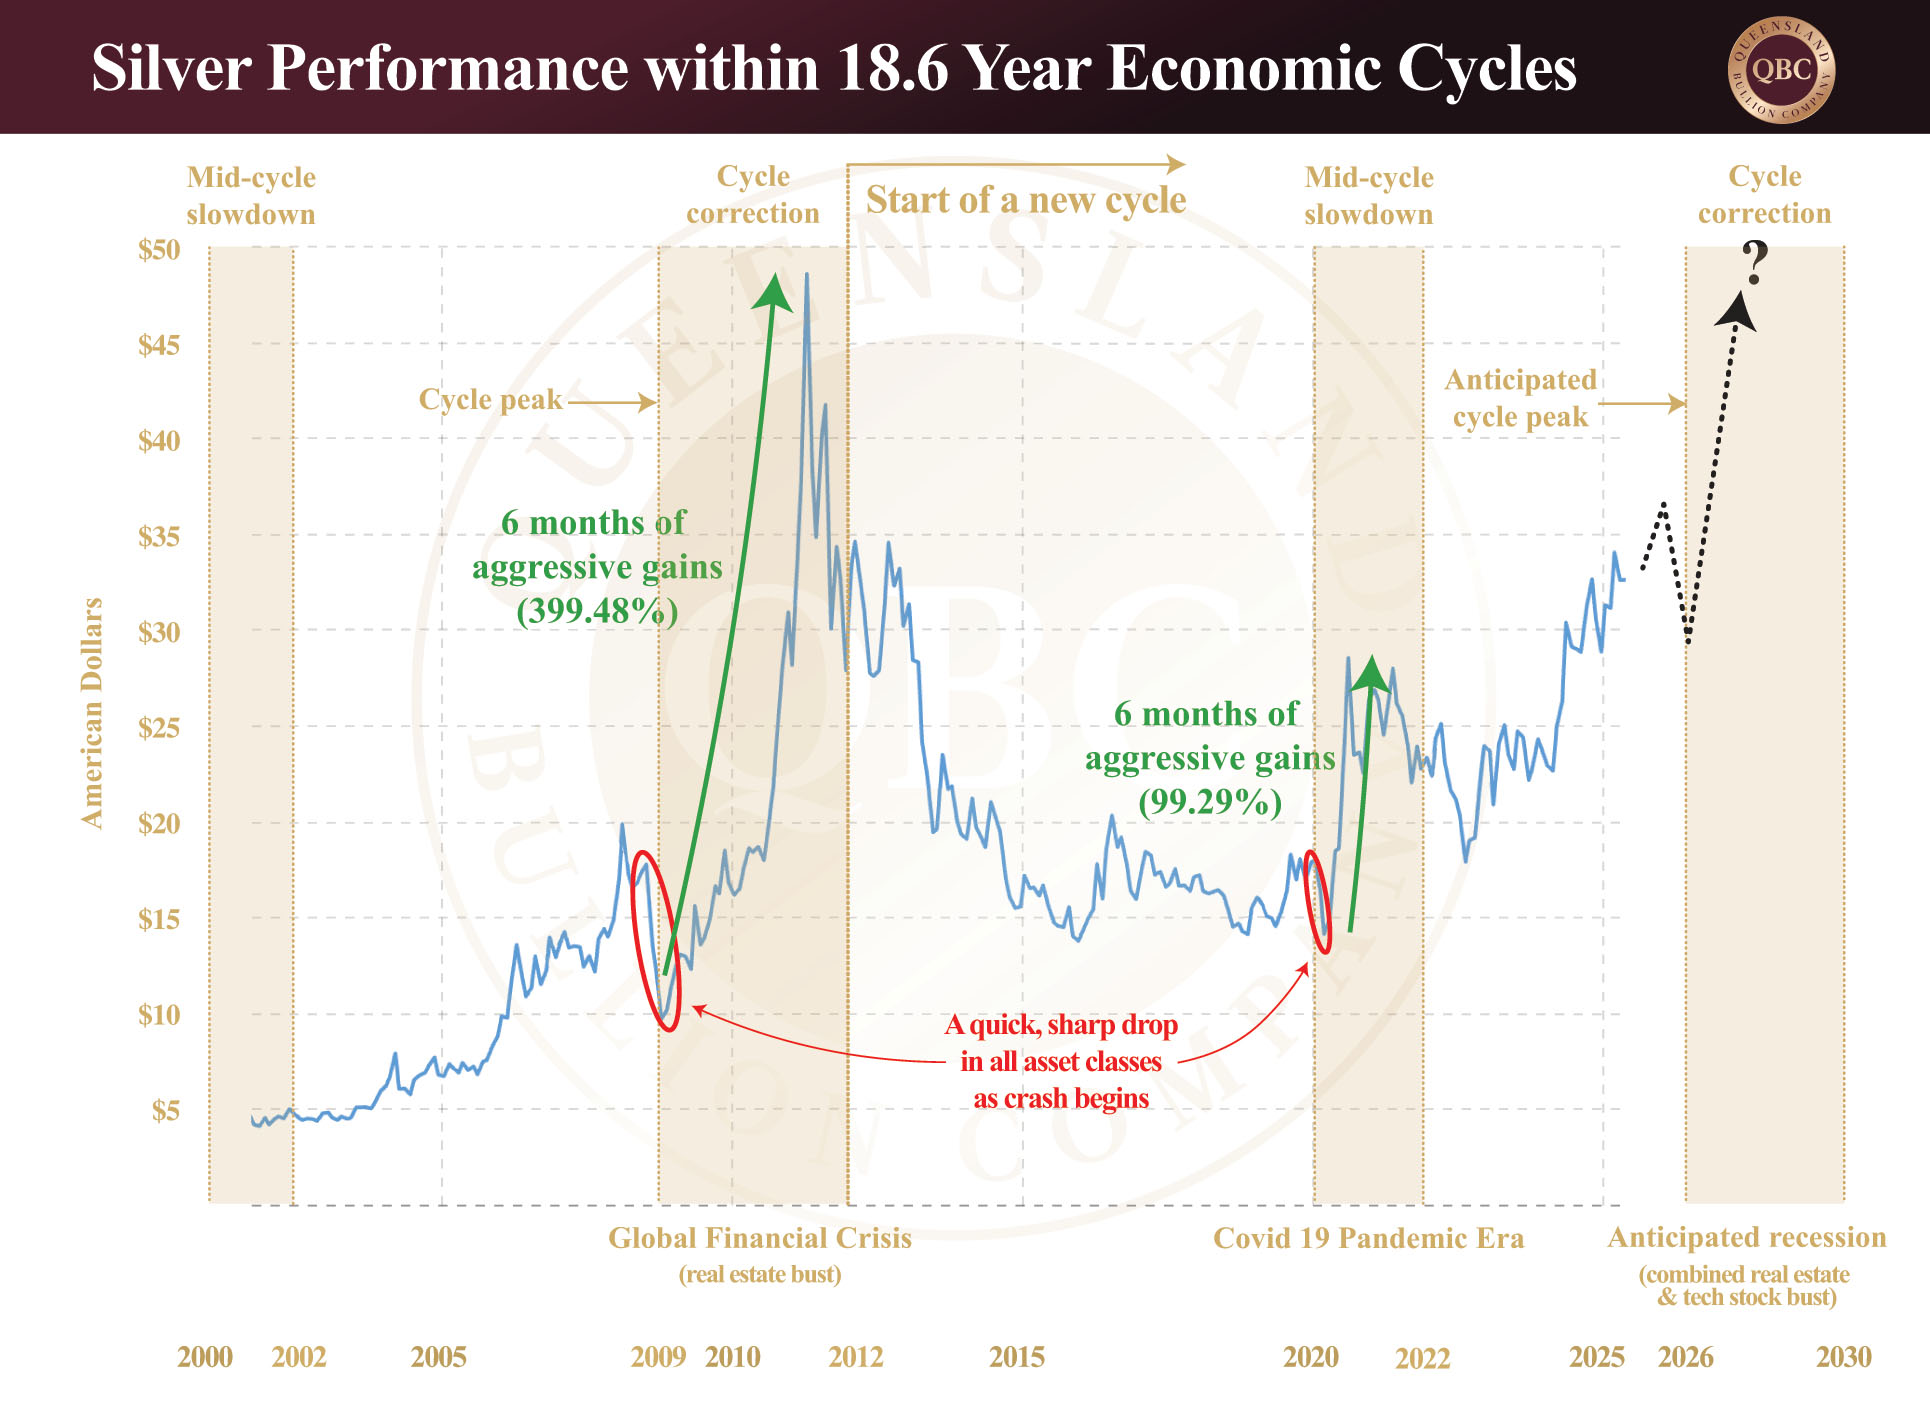
So how does this affect silver?  The metal has developed a pattern of behaviour that works in with the above economic cycle.  During the last two major global financial events (GFC and to a lesser degree Covid), silver experienced an extremely swift rise to glory over approximately six months each time.  In both cases, as has been the case for the last six bull runs, silver outperformed gold significantly; however, it is important to also observe the swift descent that followed.  Hence accurate timing of an exit from silver is imperative if the goal is to capitalise for investment purposes.  Study the graph below to appreciate how important this is.


Conclusion

Experienced silver bulls understand that the gold to silver ratio will be integral in timing an exit.  The gold to silver ratio for last century averaged between 50 and 60.  This century it has averaged around 80.  The highest it rose during the real estate bubble that preceded the GFC was 104.  This April saw a ratio of 106.  After the GFC stock market crash in 2011 it dropped down to 31.6 before it started moving back up.  The gold to silver ratio is inversely related to the price of silver meaning the higher the price of silver compared to gold, the lower the ratio drops.  If these historical cyclic patterns hold and the ratio drops to the same level again it could possibly signal the top of the market for silver.  If you have invested in silver, it is imperative to develop an exit strategy in advance to avoid emotional and reactive snap decisions when the tide turns for the grey metal.  The gains to be made in silver compared to gold can outweigh the risk for the vigilant investor.  As long as you are prepared, keep accruing while it remains discounted.

Posted on Leave a comment

Trump Reverses Course and Assets Whipsaw

As American President Trump dramatically reverses course regarding his reciprocal tariffs, markets experienced volatility similar to what happened during the 2008 Global Financial Crisis (GFC).  The President reduced country-specific tariffs down to a universal 10% for 90 days to facilitate negotiations and this applies to all trade partners except China.  Instead, tariffs for China have further increased to a massive 125%, effective immediately, as per the Amendment to Executive Order 14257.  The White House has advised that this reversal was part of a strategy implemented to encourage trading partners to enter negotiations.  With gold trading locally at $5,159, silver at $50.05, and platinum at $1,494 at the time of writing, the volatility can be felt even amongst safe-haven assets such as precious metals.

Market responses:

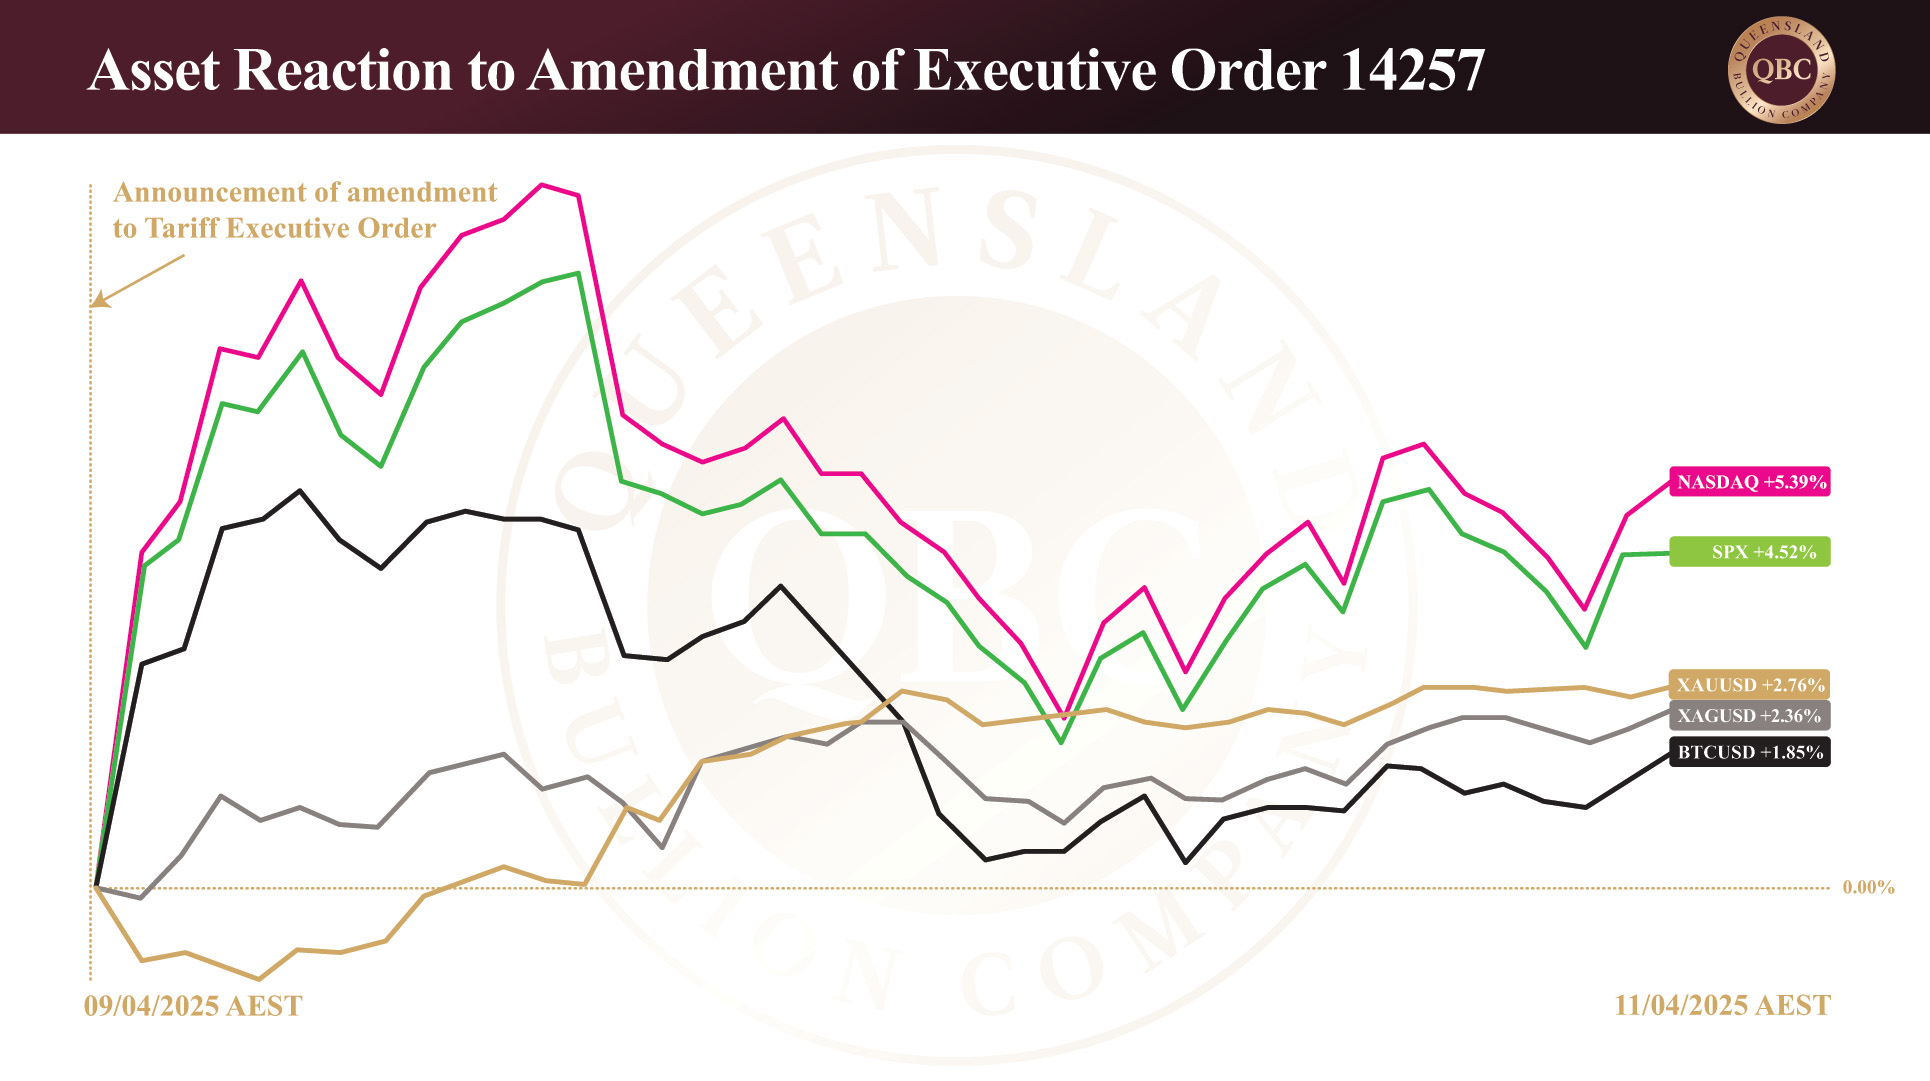
In response to the tariff changes, the American stock market has whipsawed up and down with significant volatility.  As can be expected the S&P 500 (bell-weather index for largest-capitalised companies), NASDAQ 100 (largest tech stocks), and Bitcoin experienced initial gains that have subdued overnight.  During this time the S&P marked its biggest one-day gain since the GFC and offers an indication of how close we are to repeating the financial cycle.  Naturally gold softened as stocks rose but it still benefited from the tariff amendments.  As at 9:20 this morning, the Bitcoin is the biggest winner gaining 7.19%, the S&P 500 bounced 4.52%, and the NASDAQ is up 5.39%.

Gold experienced a modest gain of 2.36%; however, it also experienced the smallest loss, thus proving itself again to be one of the least volatile asset classes in times of trouble.  Silver benefited least with a 1.85% gain.  Precious metals fared worse in Australian markets finishing down 0.39% for gold and 1.81% for silver.

Below is a graph representing these gains.

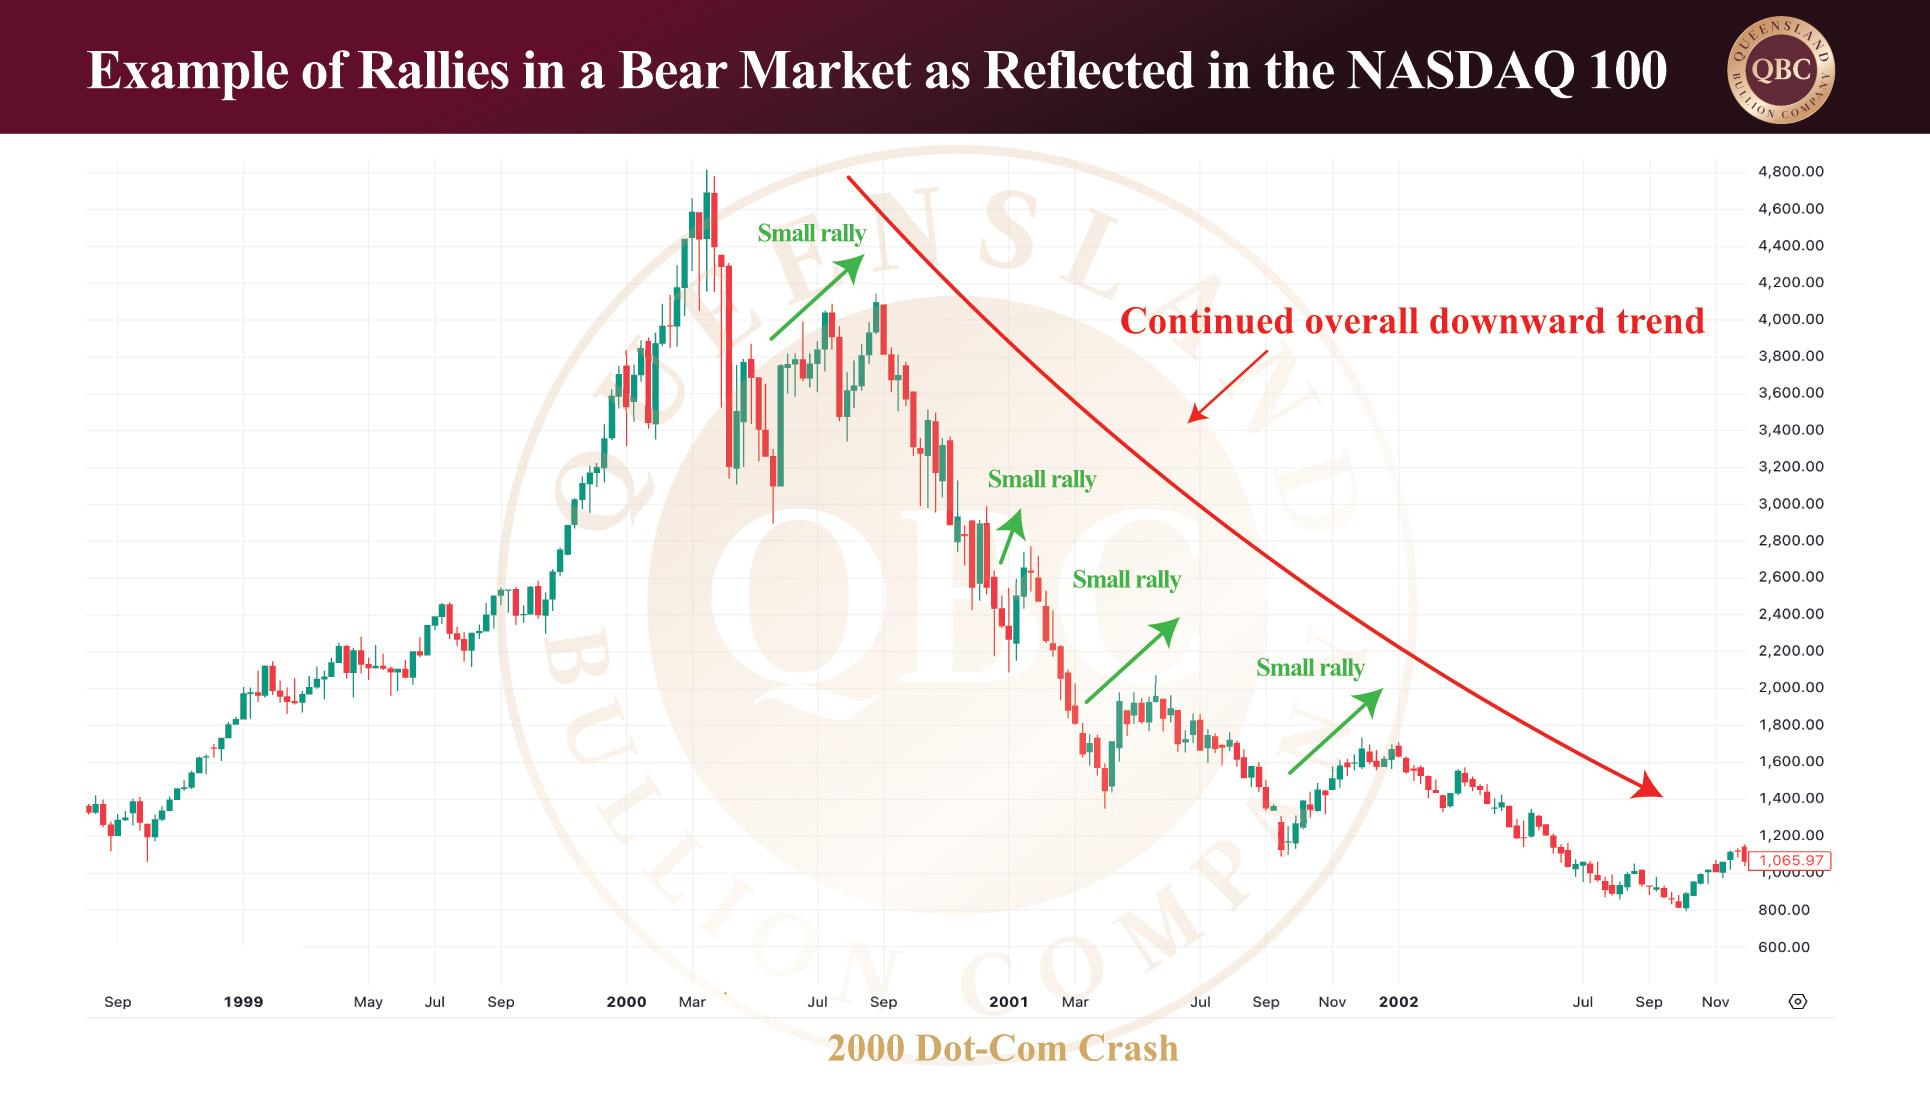
Keep in mind that short-lived and sometimes steep recoveries accompany every bear market that often fool retail investors into believing that the worst is over.  This can be referred to as a “dead cat bounce” amongst traders.  This is exactly what happened with the announcement of the tariff amendments- markets went up and have come down in a matter of days.  This is also evident in the GFC, the 2000 to 2001 dot-com bust and in every crash in history.  As such it is a fundamental mechanism of the market and those investing during a bear market need to be aware of it to avoid investment decisions based on heightened emotional reactions.  We recommend to always keep in mind the long-term trends and individual goals when considering how to invest in any market.  Below is an example of how the NASDAQ experienced small rallies during the dot-com crash while it continued to wipe out all gains.  Each time there was a rally, investors breathed a sigh of relief only to be punished again.  It pays to follow long term trends.

Bitcoin in trouble?

Regarding Bitcoin, MicroStrategy Executive Chairman, Michael Saylor, has flagged that the company may need to sell Bitcoin amid extreme predictions of the value crashing to USD $10,000.  The company anticipates a USD $6 billion loss for the first quarter alone. With vast wealth held in Bitcoin and a business model that relies on accruing more at ever higher prices, Saylor said that selling Bitcoin was an option being considered should the company fail to secure funding to cover debt obligations.  As the largest publicly traded corporate holder of Bitcoin, a significant sell-off could spark panic in the market or copy-cat selling from other investors.  It could potentially affect the price and start a downward trend that may be hard to recover from.  In Australian markets the value of Bitcoin mimicked its American counterpart, finishing slightly worse off at 0.26% to the downside since the amended tariffs were announced.

Summary

2025 is shaping up to be as volatile as any trader can imagine.  Regardless, gold has still made gains over 20% in Australian markets, year to date, and hit another all-time high today.  And despite losing traction in April, silver is still up over 7% in the same time.  Moving forward expect the uncertainty to continue.  President Trump can affect the markets with a single comment which is exactly what he wants.  His moves are calculated yet erratic and markets respond not just to his policy, but also to rumours of policy.  As safe haven assets, gold and silver are the obvious investments in turbulent times and stand to benefit the most.  Protection requires preparation.