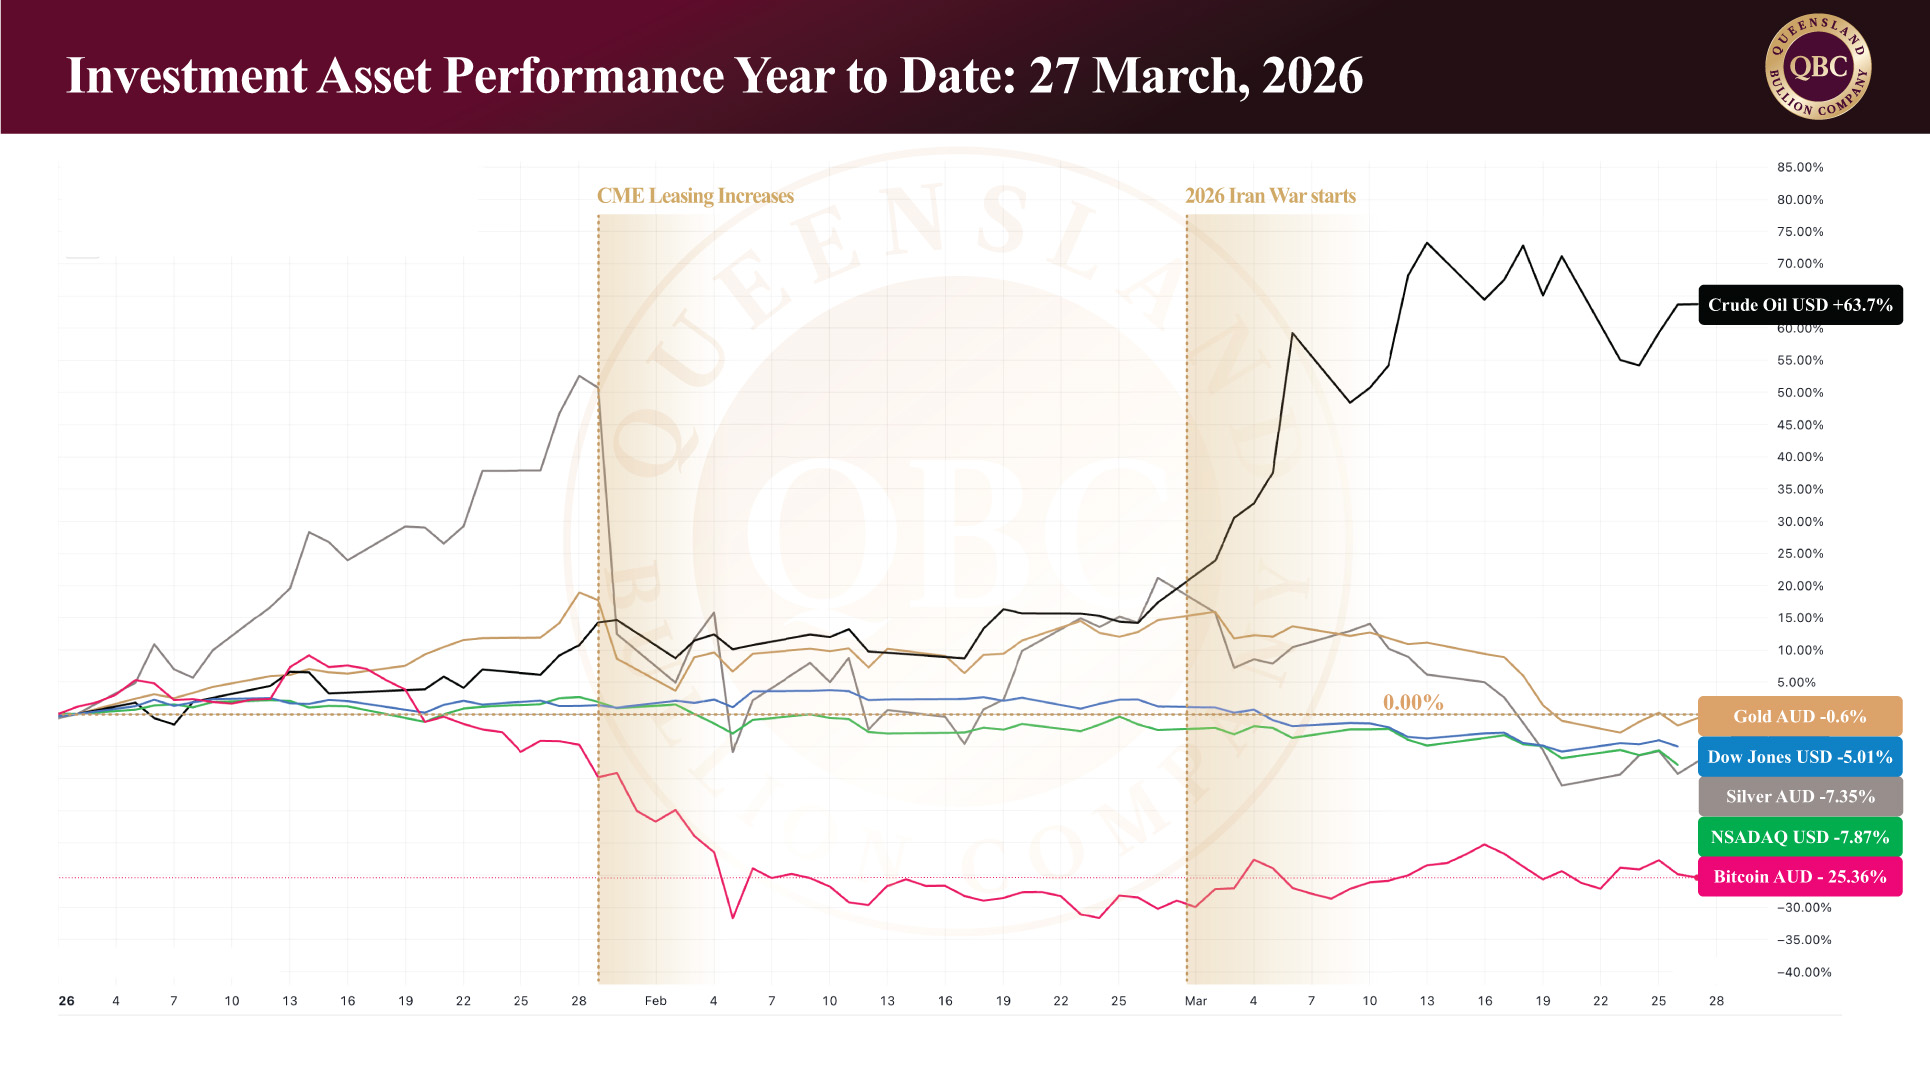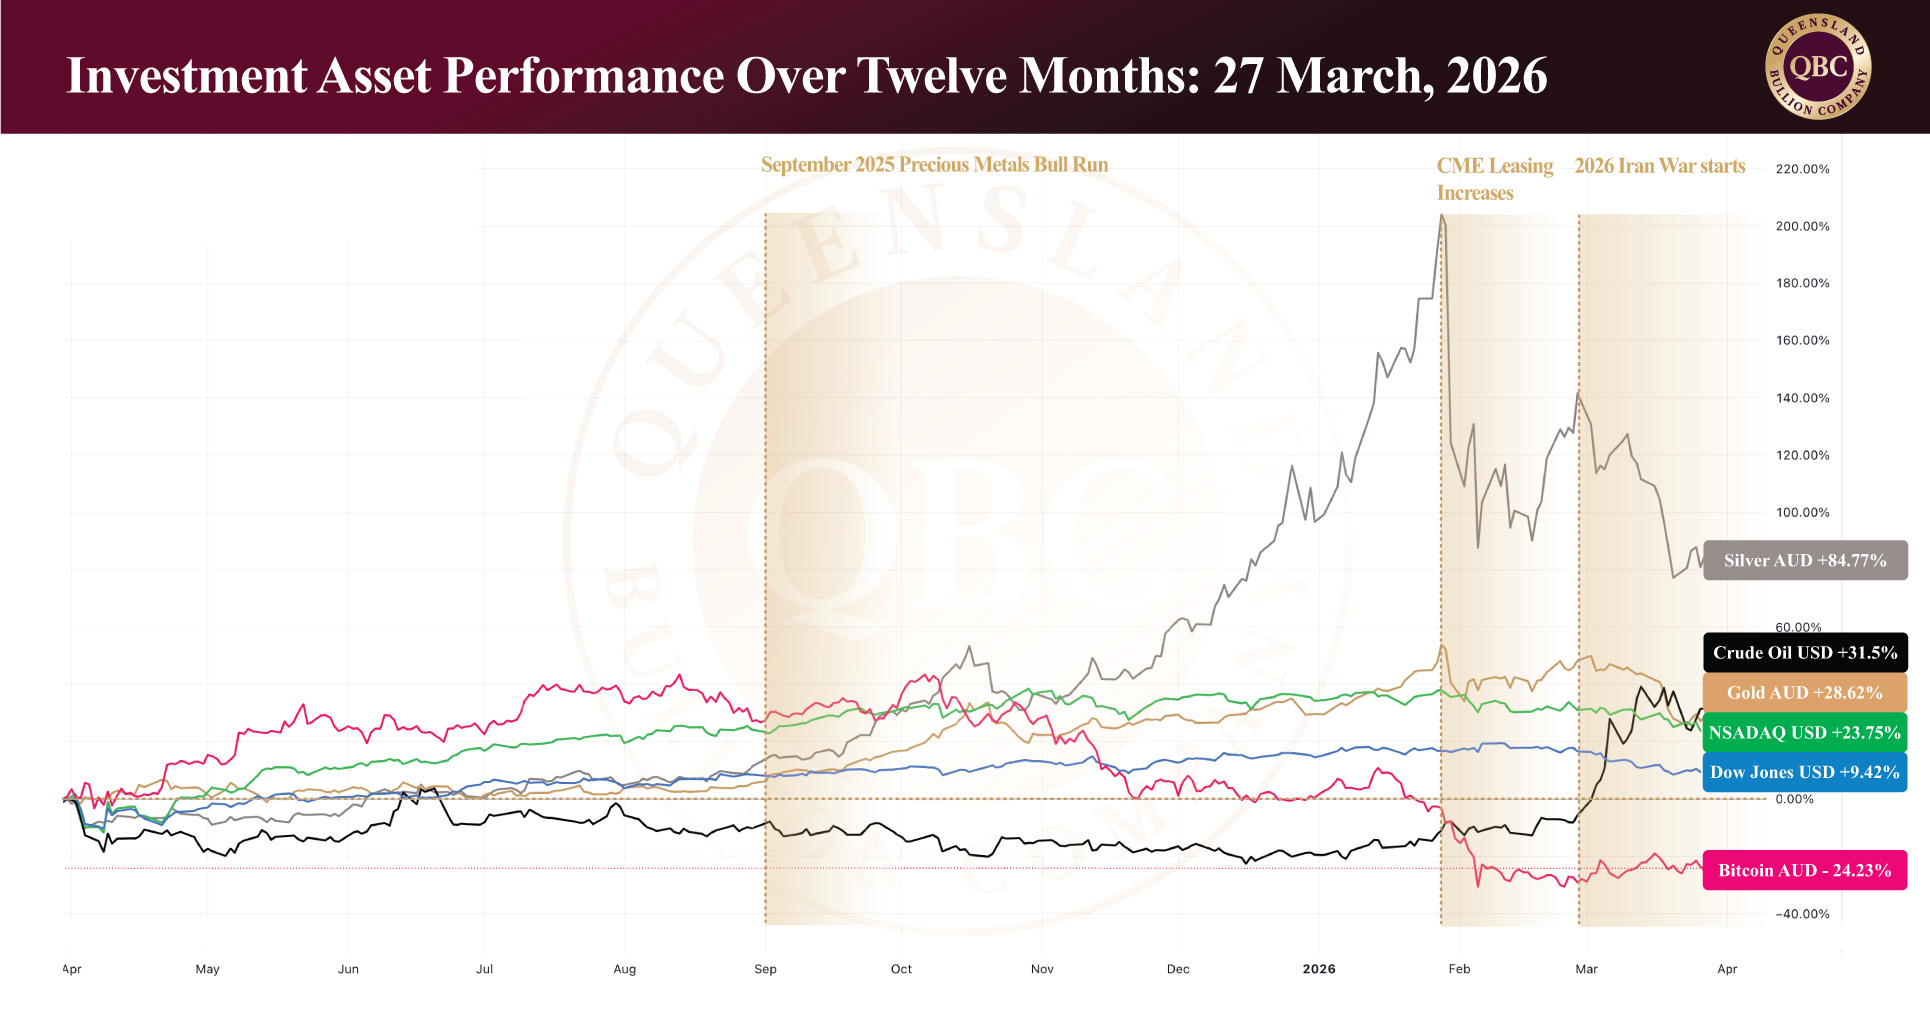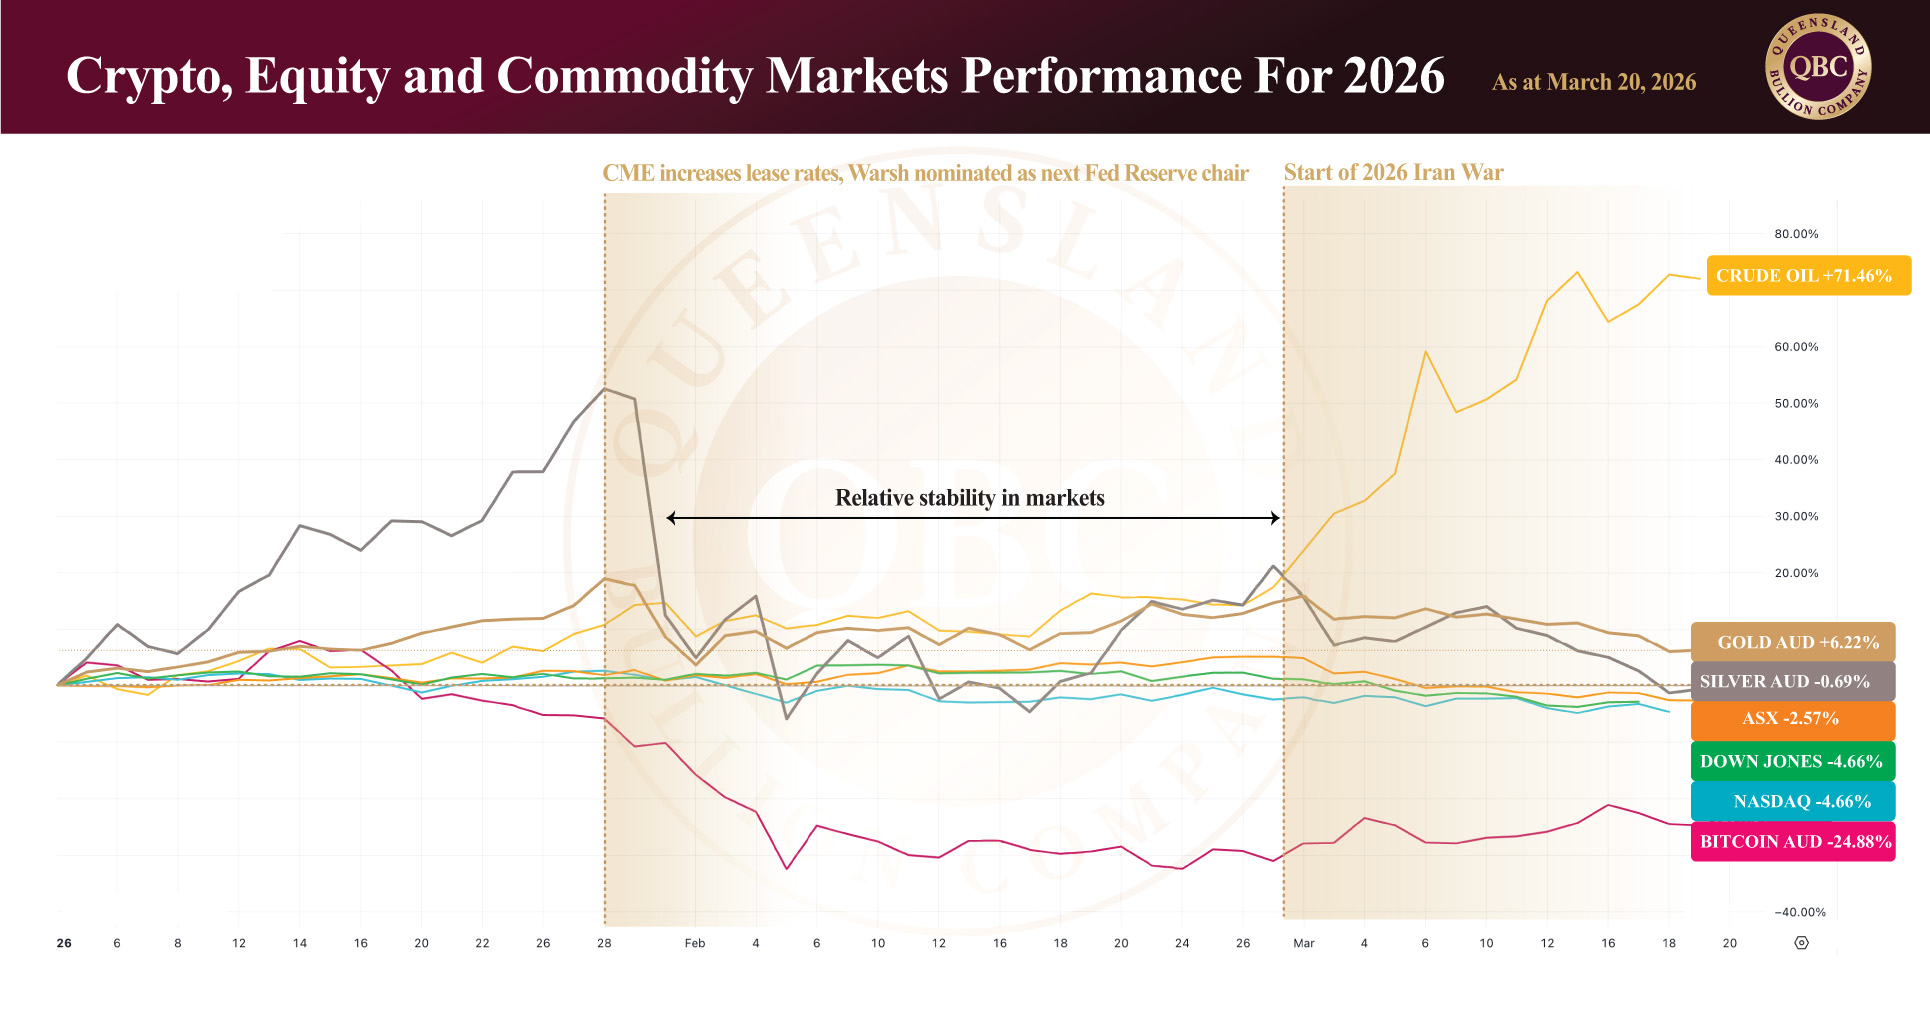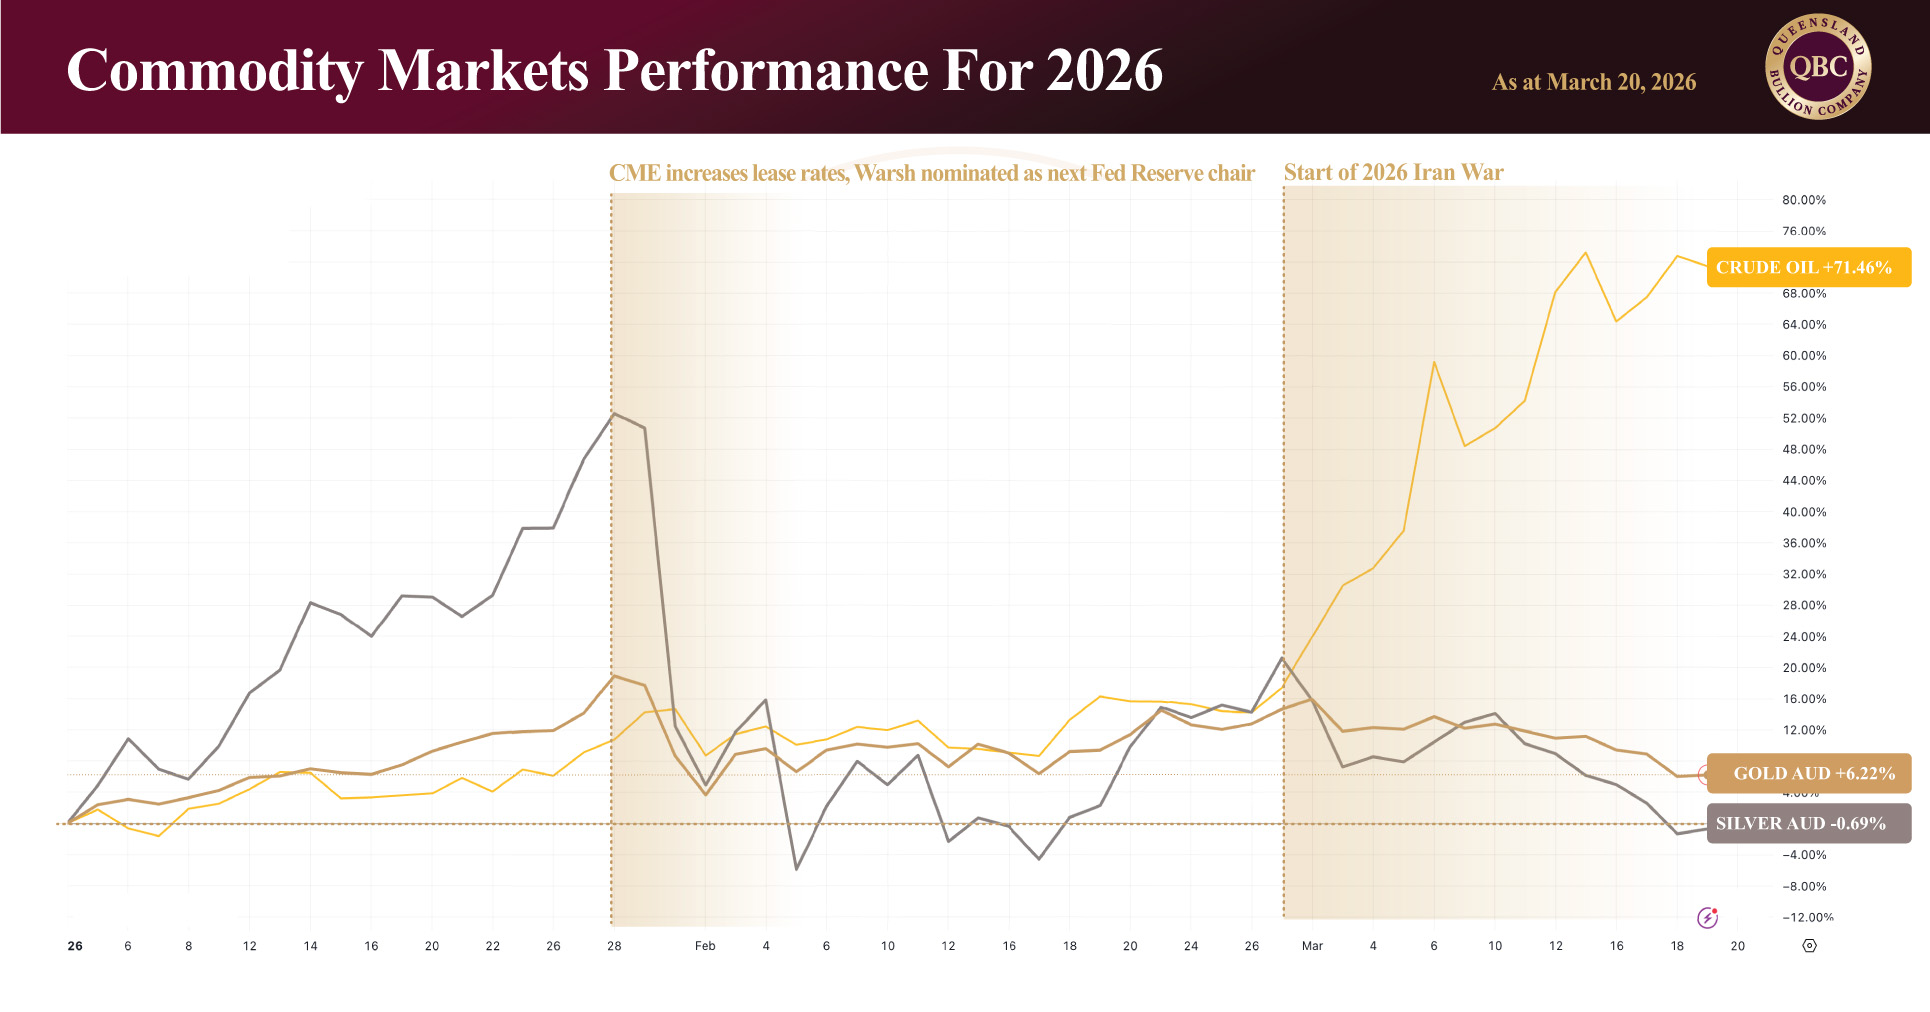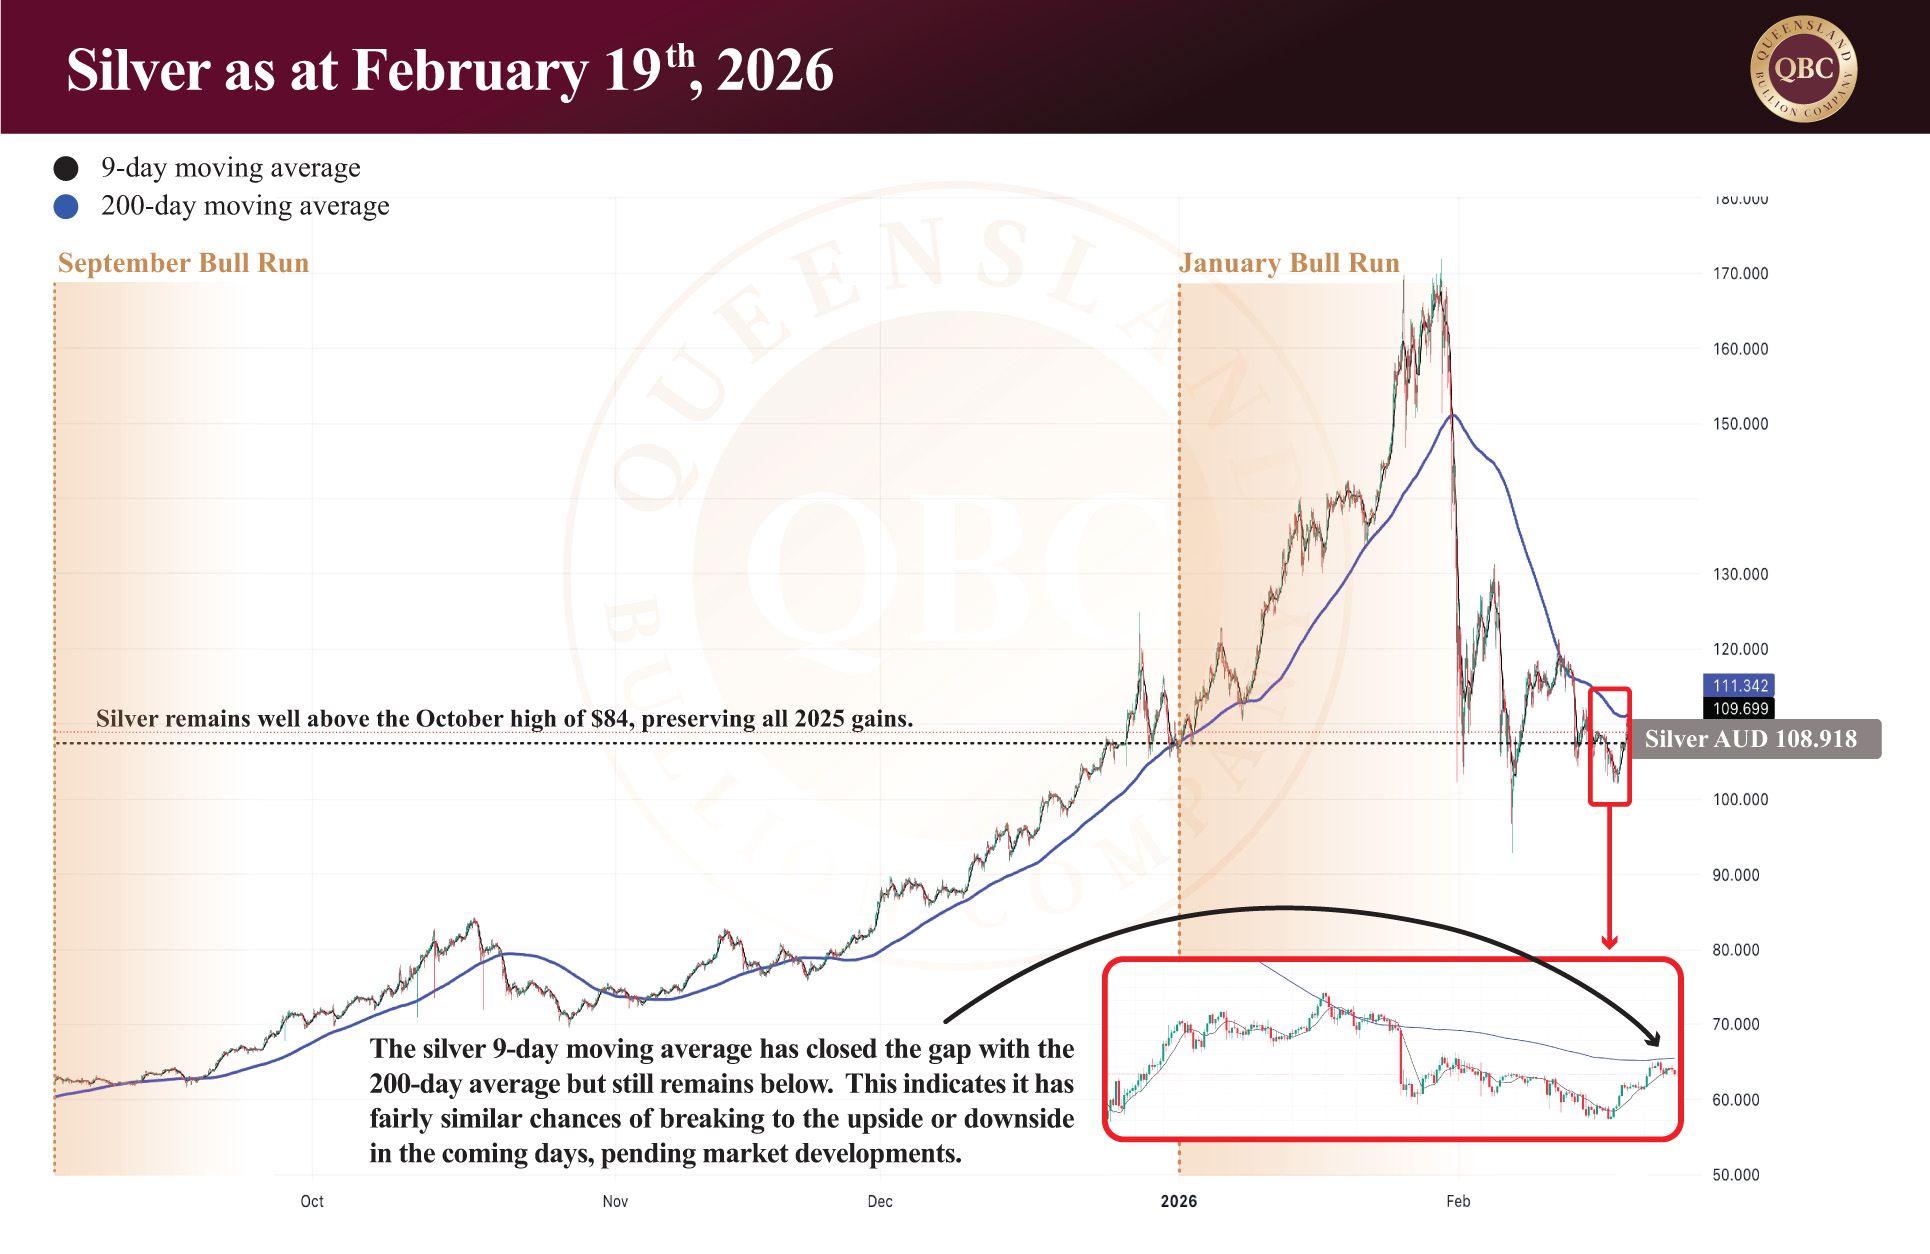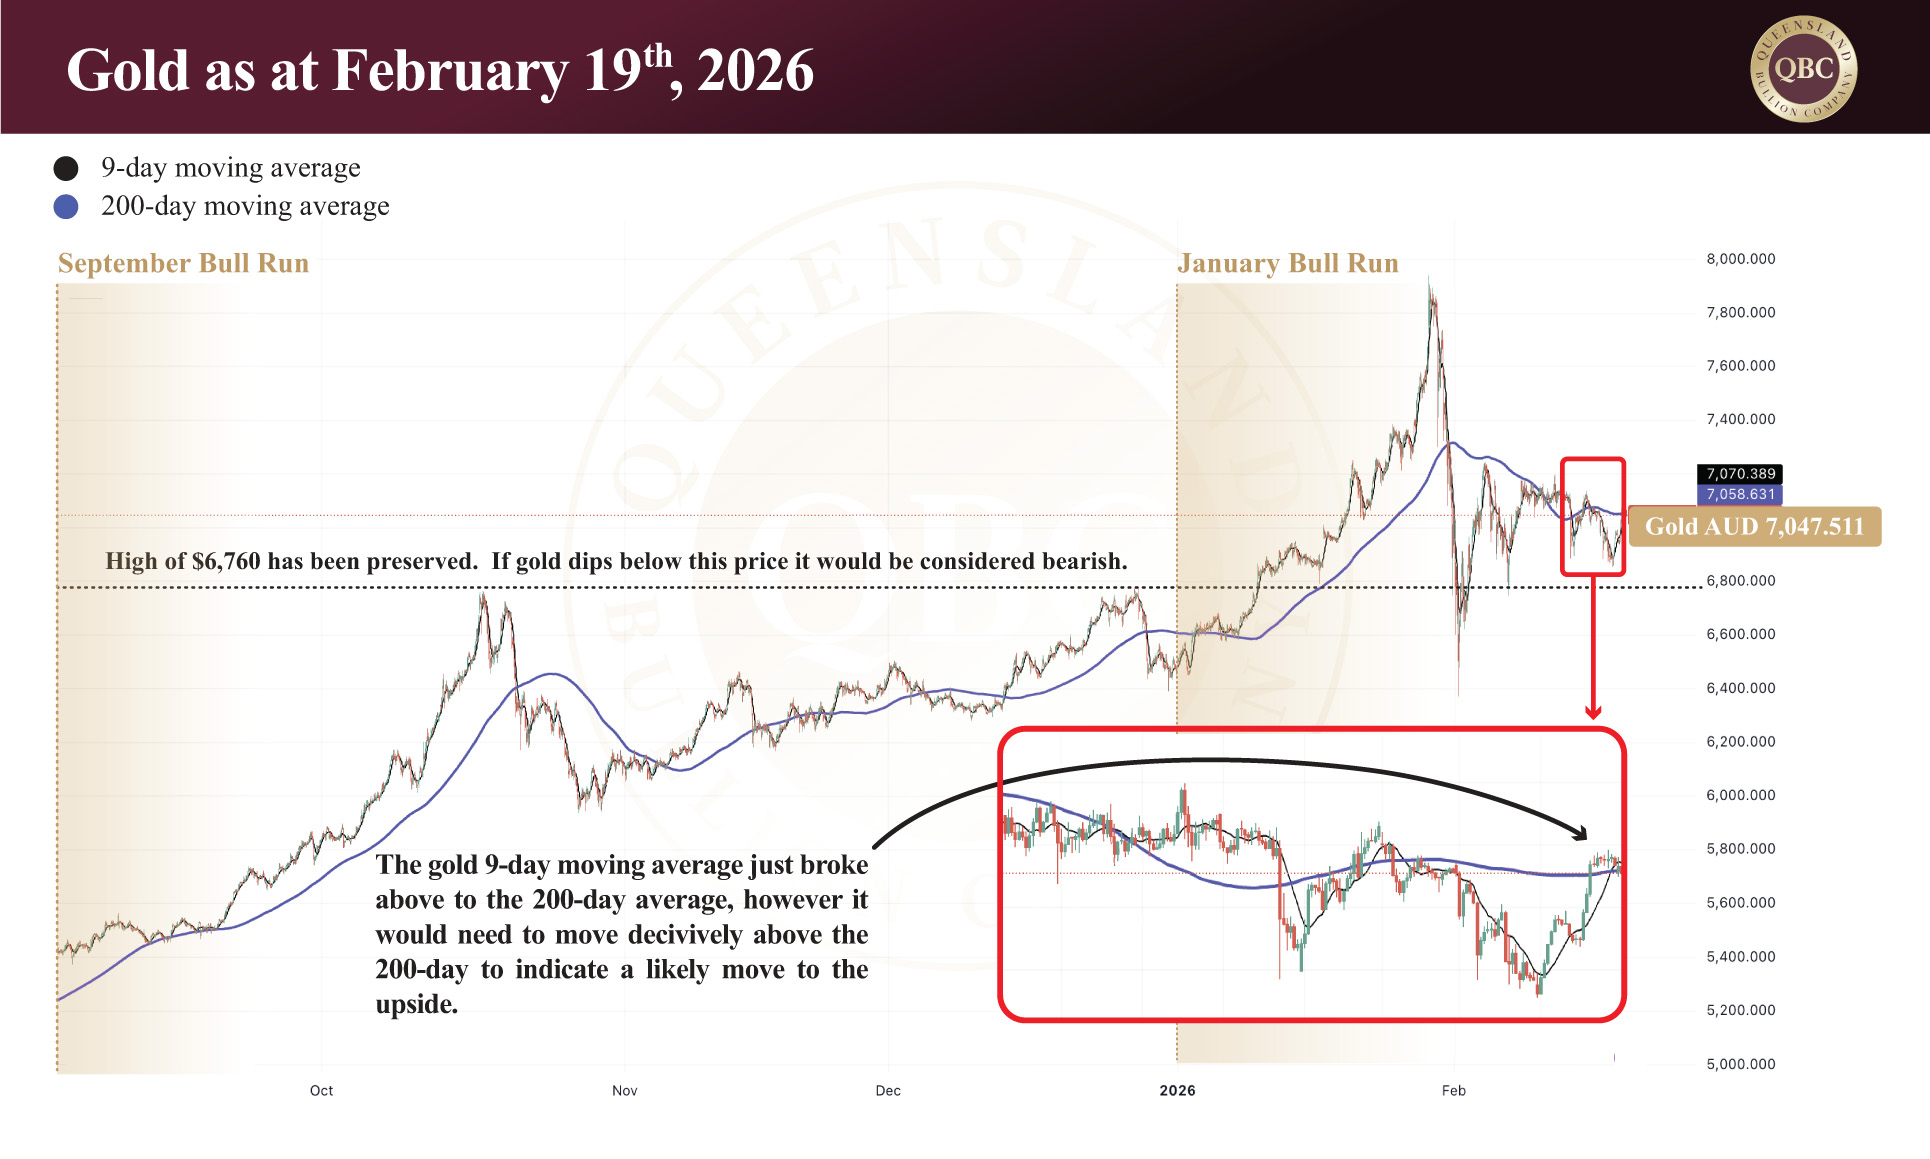
Global markets are currently being driven by one dominant force: uncertainty around geopolitical direction. The 2026 U.S.–Israel–Iran conflict has introduced a level of unpredictability that is now outweighing traditional economic indicators, forcing investors to position around potential outcomes rather than confirmed developments. At the time of writing, gold trades around AUD $6,719 per ounce, silver near AUD $105.36, and platinum approximately AUD $2,889, reflecting a market that has stabilised but remains highly reactive.
Unlike previous geopolitical events, where market responses followed a more predictable pattern, the current environment is defined by competing narratives. Oil, inflation, interest rates, and risk sentiment are all moving in response to a conflict that has yet to reveal its true trajectory. To understand how markets may evolve from here, it is necessary to first assess the current status quo on the ground.
A fragile status quo
The 2026 U.S.-Israel-Iran War has already reshaped global trade flows, particularly in energy markets. Commercial traffic through the Strait of Hormuz dropped by more than 90% following the outbreak of hostilities, before declining further as Iran escalated attacks on shipping throughout March. In response, Iran has selectively allowed passage for certain vessels including its own, those from cooperating nations, and others willing to pay a substantial toll.
While these disruptions have created widespread economic strain, they have also produced an unintended outcome for the West. Iran has experienced a significant revenue boost, with oil income rising by approximately USD $25 million per day, while Russia has benefited even more, seeing gains of roughly USD $150 million per day over the same period. In this sense, the conflict has simultaneously disrupted global markets while strengthening the financial position of key participants.
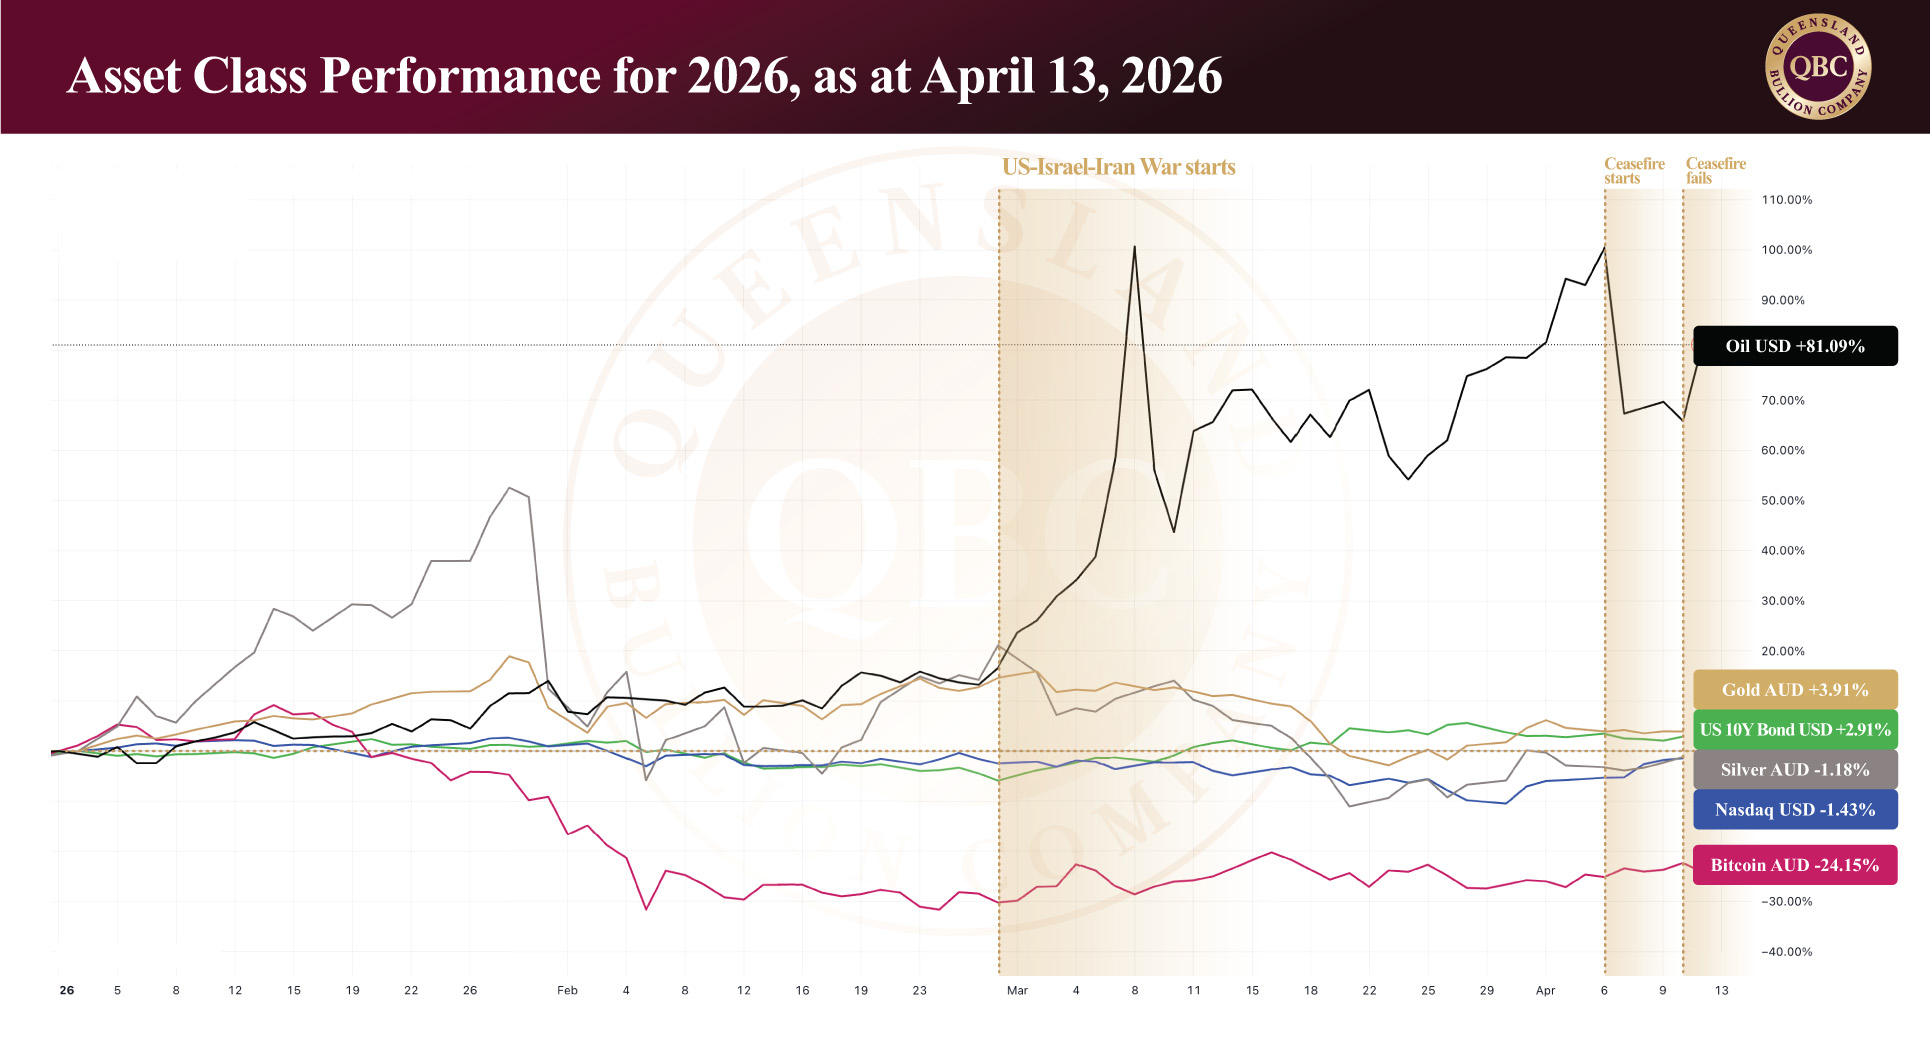
The tone of the conflict has reflected this intensity. On April 7, U.S. President Trump warned that “a whole civilisation will die tonight, never to be brought back again.” The situation has been fluid, though, and after more than five weeks of sustained fighting the two-week ceasefire brokered by Pakistan saw diplomatic efforts collapse with no resolution over the weekend, with the US stating that they intend to blockade the Strait of Hormuz “effective immediately,” targeting ships in relation to Iran (a move that will impact the lucrative profits of the East). This is in line with Israeli Prime Minister Benjamin Netanyahu’s sentiment, who stated before the breakdown that “we still have goals to complete… and we will achieve them either by agreement or by the resumption of fighting.”
If the conflict escalates
Should the conflict escalate (as it appears to be), the economic consequences are relatively clear. Oil prices would likely move higher as supply risks intensify, feeding directly into inflation. In turn, central banks (particularly the U.S. Federal Reserve) would be forced to maintain or increase interest rates to contain those pressures.
Higher rates would support U.S. Treasury yields, drawing capital into bonds and strengthening the U.S. dollar. In this environment, most other asset classes would come under pressure. Equities would likely decline as borrowing costs rise and economic growth slows. Cryptocurrencies, already sensitive to liquidity conditions, could face further downside.
Precious metals present a more nuanced case. While gold is traditionally a safe-haven asset, its performance in this cycle has shown that it must compete with yield-bearing alternatives. Silver, with its significant industrial component, may also face headwinds if higher energy costs begin to slow global economic activity. Although, it should be noted that historically the competition between yields and metals have often lead to a long-term significant correction. One that often sees all asset classes repriced prior to precious metals leading the recovery.
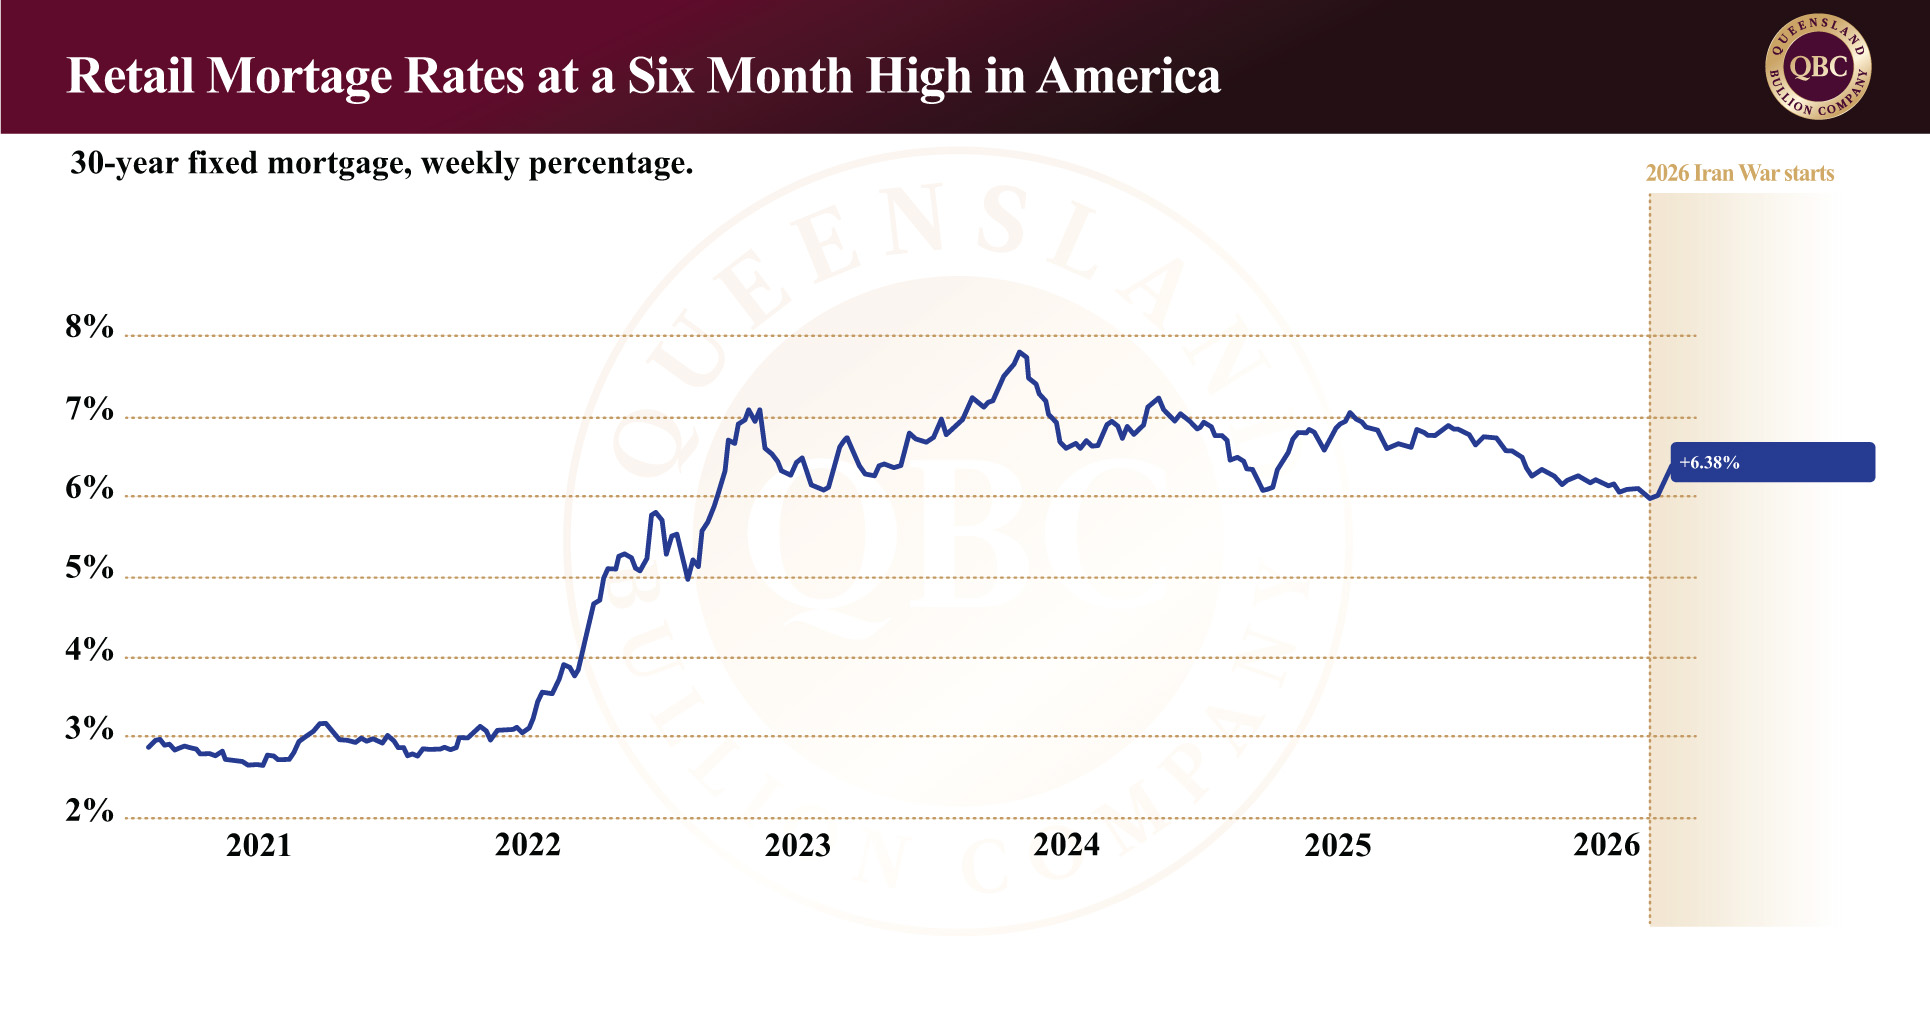
At the extreme, prolonged escalation risks pushing the global economy toward stagflation, a scenario characterised by rising inflation, slowing growth, and declining consumer demand. Recently the International Monetary Fund (IMF) has already warned the war is triggering a stagflation shock, predicting that USD $20B to $50B in additional financing will be needed, with countries that import oil bearing the brunt of the burden. In such an environment, higher interest rates reduce disposable income, increasing financial stress across households and businesses. Mortgage defaults begin to rise, and pressure on banking systems can emerge.
When combined with already elevated global debt levels and signs of softening employment, the broader financial system becomes increasingly fragile.
If the conflict resolves
A resolution, however, does not imply an immediate return to normal conditions.
While oil prices would likely decline, the recovery of global energy supply would be a multi-stage process. The conflict has damaged more than 40 energy assets across nine countries, and restarting production involves a series of constraints: securing shipping lanes, clearing storage bottlenecks, restoring output, and repairing infrastructure.
Even under favourable conditions, timelines are measured in weeks and months, not days. Smaller oil fields may resume within two to three weeks, while larger fields could take several weeks. Refineries may restart within 10 to 15 days if damage is limited, but prolonged shutdowns introduce technical challenges such as corrosion and pressure imbalances. Full recovery often mirrors the duration of the disruption itself, with estimates ranging between two and nine months for outages to restore normal output. Iraq, for example, could require six to nine months to return to pre-conflict production levels due to reservoir and operational constraints.
As supply gradually returns oil prices would ease, reducing inflationary pressure. This would allow central banks to adopt a more dovish stance, potentially lowering interest rates over time. In such an environment, risk-on assets would likely recover. Equities could outperform, cryptocurrencies may stabilise, and precious metals would benefit from improving sentiment and lower Treasury bond yields.
However, this recovery would not be immediate. It would unfold in phases, with each stage introducing delays and uncertainty.
If the conflict drags
The third scenario, and perhaps the most difficult to price, is one in which the conflict neither escalates dramatically nor resolves. In this case, markets would face a slow, persistent grind. Oil prices would likely drift higher over time, maintaining upward pressure on inflation. Central banks would remain constrained, unable to ease policy meaningfully. Interest rates would stay elevated, gradually tightening financial conditions.
This scenario is particularly damaging for confidence. Unlike sharp shocks, which markets can reprice quickly, prolonged uncertainty erodes sentiment over time. Investment slows, consumption weakens, and economic momentum fades. In effect, it produces many of the same outcomes as stagflation, but in a slower and more sustained manner.
In summary
Markets today are not reacting to what has happened, but to what they believe will happen next. History suggests caution. Geopolitical events rarely follow linear paths, and early expectations are often proven wrong. Whether the conflict escalates, resolves, or lingers will determine the direction of oil, inflation, interest rates, and ultimately all major asset classes.
In the meantime, markets remain positioned across competing outcomes. Oil reflects disruption. Treasury yields reflect inflation, policy constraints, and confidence in the governments. Precious metals reflect a balance between risk and yield. Equities and cryptocurrencies reflect a reassessment of growth and liquidity. Periods like this do not reward certainty; they reward preparation and adaptability. As the situation evolves, the ability to distinguish between temporary developments and structural shifts will determine how capital is allocated. In such an environment, understanding the interplay between geopolitics and markets is no longer optional — it is essential.