Posted on Leave a comment

Is Cash in the Bank High Risk? Bank Bail-In Laws

Gold finished strongly for the week. After early resistance near AUD $5,150, it pushed above $5,200, and currently trades at $5,189.  Silver, on the other hand, saw a more volatile $2 trading range before reaching higher and is at $59.53.  Platinum, at $2101, remained steady largely moving sideways. Precious metals continue to benefit from uncertainty in global financial systems, with one issue coming into sharper focus as we edge closer to a major correction: Australian bank bail-in laws. These laws, introduced in 2018, could directly impact those holding cash deposits, and highlight why gold, silver, and platinum remain critical stores of value outside of the banking system.  Passed by the Senate on Valentine’s Day, the laws are less of a love letter to Australian bank depositors and more like a tightly sealed pre-nuptial agreement that you probably never read before investing in the relationship.


Australia’s bail-in laws

In 2018, amendments to the Banking Act 1959 via the Financial Sector Legislation Amendment (Crisis Resolution Powers and Other Measures) Act brought Australia in line with the Bank for International Settlements’ (BIS) global “bail-in” framework, agreed at the 2014 Brisbane G20. Unlike the 2008 bail-outs that used taxpayer money to rescue failing banks, bail-ins place the burden on a bank’s creditors which, crucially, can include depositors.

Under the law, APRA (the Australian Prudential Regulation Authority) has “crisis powers” to step in, run distressed banks, and convert certain securities or deposits into capital to stabilise the institution. SMSF cash holdings are explicitly exposed, while ordinary deposit accounts are not excluded, which opens them to the possibility that they also could be written down or confiscated in a crisis. Rather than curbing risky investment behaviour by banks, the framework prioritises repayment of banks’ derivatives obligations ahead of depositors, raising concerns that everyday savers could be sacrificed to protect interbank exposures.

Bail-in versus bail-out

A bail-out involves taxpayer-funded capital injections, as seen during the Global Financial Crisis when governments rescued banks in the U.S. and Europe. Australia has historically avoided direct bail-outs, though during 2008–09 it guaranteed deposits and wholesale funding to protect stability. Bail-ins, by contrast, recapitalise failing banks by forcing creditors (including bondholders, hybrid investors, and potentially depositors) to absorb losses. This reduces taxpayer exposure but shifts risk squarely onto the private sector, potentially including those with cash in the banks.  By passing bail-in laws, Australia is just one of the G20 countries positioned to prioritise banks over people by legally being able to confiscate cash deposits in banks.


Who are the creditors that bail-in applies to?

In essence, when you deposit money into a bank account you lend that money to the bank.  This is why they pay you interest.  The banks then use your money to fund other projects, all of which allow them to produce a profit.  They do this under a fractional reserve system and retain only a small portion as liquid reserves.  You hold the right to demand payment which is what happens when you withdraw your money from the bank.  But until you withdraw it they loan it from you.  Because you lend your money to the bank, you hold the status of unsecured creditor.  And as a creditor, you could be subject to bail-in laws.  Under bail-in law, your right to claim payment can be written down if a bank is in distress, putting depositor funds at risk.


The $250,000 deposit guarantee is not absolute

People are generally more aware of Australia’s Financial Claims Scheme (FCS) than bail-in laws.  The FCS may provide a government guarantee of up to AUD $250,000 per account holder, per authorised deposit-taking institution (ADI).  Falling back on the FCS is often the first response from people on learning of the bail-in laws in an effort to dismiss risk.

However, this protection has limits:

Multiple banks under a single licence are treated as one entity. This means that if a person’s wealth is spread across two entities that share a licence, the guarantee is split between them.  For example if an individual has $50,000 deposited with St George, another $200,000 with Bank of Melbourne, and $300,000 with Westpac, they are only guaranteed a total of $250,000 across all accounts because these banks all use the same licence.  They could lose at least $300,000 (if not more) should the FCS ever be activated to “protect” their financial assets.

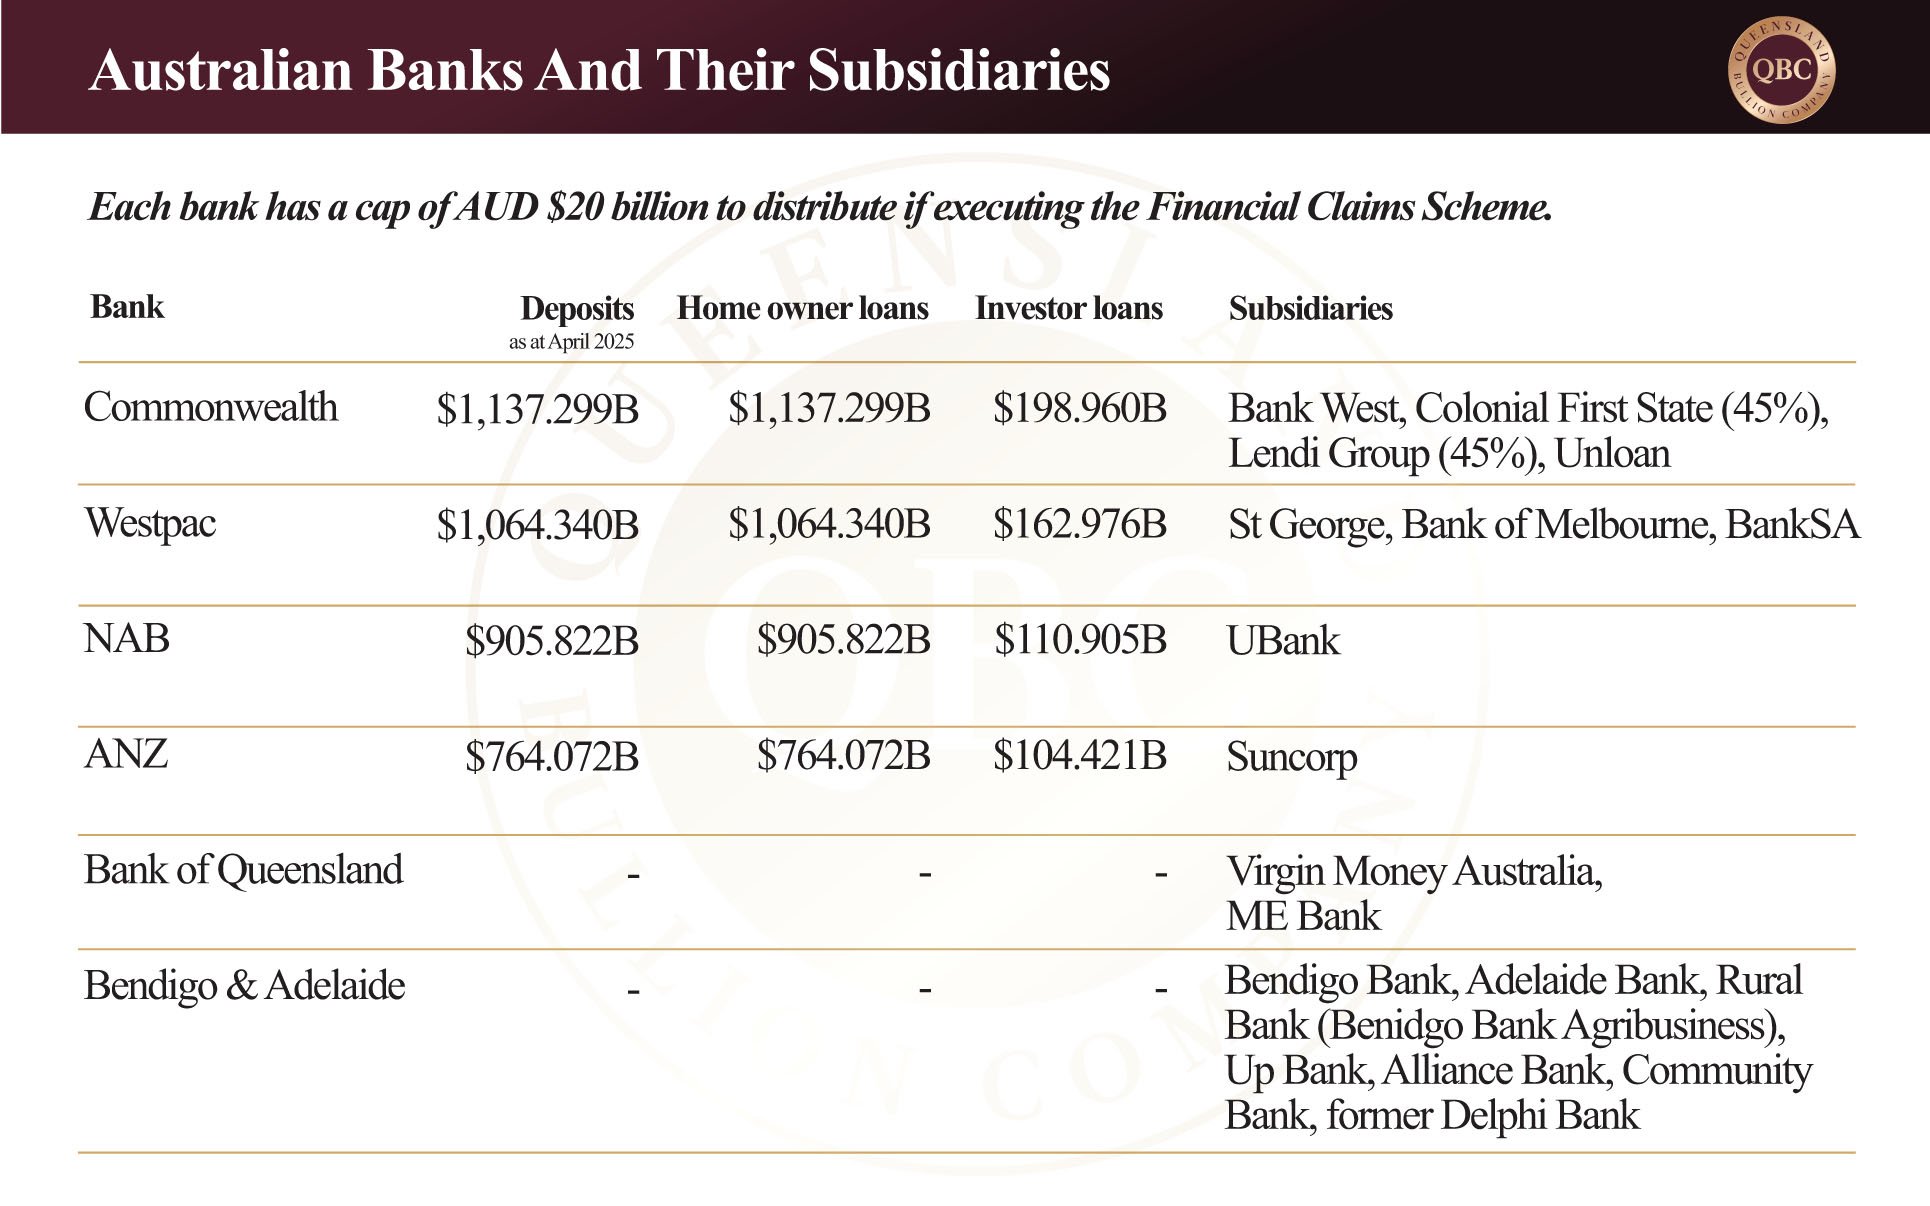
The $20 billion cap per ADI may be insufficient for large institutions. Refer to the table below and consider how far this will stretch across each bank and their deposits, and subsidiaries.

Critically, bail-in powers are applied before the FCS is triggered, meaning depositor funds could be used to stabilise the bank first. And only if the bank fails outright would the FCS potentially provide reimbursement.

Due process guarantees a delayed payment. FCS are to be paid out “within seven days.”  However, this starts after APRA’s attempt to first rescue the failing institution (by implementing bail-in), then they must apply to the Treasurer for support to declare the institution insolvent.  This process must go through the courts, then FCS is implemented, and you get the remainder of your money after bail-in “within seven days.”


Why this matters for investors

The IMF has noted that bail-in laws indemnify bank executives from liability, further shielding institutions and reducing accountability. This framework makes clear that in a crisis, depositor protection is not absolute. Holding significant cash in banks exposes savers to the risk of their funds being used to rescue the very institutions meant to safeguard them.

With bail-in laws enshrined in Australia, cash in the bank is not risk-free. Depositors are legally creditors and their funds could be at risk should a bank faces distress. This reinforces the case for precious metals as a decentralised, tangible store of wealth that sits outside the banking system. Gold, silver, and platinum cannot be “bailed in,” written down, or subjected to derivative losses. At a time when global monetary policy and financial stability are under strain, bullion offers investors independence and protection that bank deposits simply cannot guarantee.  Those savvy with their wealth understand what Shakespeare meant when he penned “it is better to be three hours early than one minute late.”  Preparation with a layered defence before a financial correction allows time for unexpected delays, avoids panic, reduces stress, and provides stability and strategy for the investor and consequently their dependents.  There has never been a better reason to invest in gold and silver today.

Posted on Leave a comment

Where the World’s Wealth Really Sits And Why the Skew Matters

Precious metals like gold, silver, and platinum have served as anchors of value for centuries, yet today they occupy only a fraction of global wealth. Spot prices currently stand at AUD $5,145 for gold $58.76 for silver, and $2,098 for platinum — levels that, when viewed against other asset classes, suggest precious metals have a long way to go despite enjoying record pricing. Meanwhile, vast sums are concentrated in asset classes where valuations are flashing warning signs.


Real Estate – The Global Asset Juggernaut

Real estate remains the preeminent asset class worldwide, often seen as an essential first goal for most retail investors. The industry totals at an estimated $300–400 trillion. This includes everything from owner-occupied homes and farmlands to multi-billion-dollar commercial developments. Although real estate is traditionally viewed as a stable, inflation-protected asset, there are emerging vulnerabilities. Post-pandemic, office spaces face structural demand shifts, and financing costs are tightening as central banks recalibrate interest rates. Demographic shifts and a mixed outlook for commercial use further cloud the picture. Added to this, the 18.6 year economic and real estate cycle suggests there could be up to another twelve months of high times for estate agents as they squeeze the last commissions out prior to the expected correction.  As a case in point, Sydney now “stands alone” as the most expensive city in the world for housing.  Extrapolate this around the country and it suggests the real estate bubble in Australia could be the largest elephant in the room.


Bonds – A System Under Strain

The global bond market remains the second largest financial asset class, valued at $130–150 trillion, encompassing government, corporate, and municipal debt. What’s particularly striking is how the debt ceiling has evolved from a legal limit into a baseline expectation for perpetual government spending. With central banks expanding their balance sheets and inflation proving sticky, policymakers appear trapped, facing a lose-lose between maintaining credibility and ensuring solvency. These are problems that cannot simply be printed away and this, in turn, chips away at confidence in fiat currency systems.

In this context, traditional safe-haven assets like U.S. Treasuries lose their appeal as yields drop. In comparison, physical gold and silver (non-counterparty, tangible, and historically resilient) emerge as rare stores of value that are not subject to the same fiscal pressures.  And despite not offering regular yields, they don’t rely on sovereign promises and are immune to default or devaluation risk, reinforcing their role as essential portfolio hedges.  As central bank interest rate cutting cycles ramp up look to see if there is a transfer of capital away from bonds and into precious metals.


The Equity Bubble – $100–120 Trillion

The global stock market, valued at USD $100 to 120 trillion, is not just large — it is historically expensive. A Bank of America survey indicates 91% of global fund managers believe U.S. stocks are overvalued, the highest since 2001, reflecting widespread concern about a potential bubble.  The Buffett Indicator (total stock market capitalisation divided by GDP) is now above 170% globally and over 210% in the U.S., far beyond the long-term average of approximately 100%. This signals a market priced for perfection to take profits but also highly vulnerable to economic shocks.

U.S. equities dominate with USD $50 to 60 trillion in value, and a staggering 55% of that is now tied to technology and tech-related companies. The “Magnificent Seven” alone account for 34% of the S&P 500’s total market capitalisation, up from 12% just a decade ago. Such concentration not only inflates valuations but also magnifies systemic risk; if one sector falters, the ripple effect could be severe.

While equities are celebrated for their growth potential, the current valuations imply minimal margin for error. For investors seeking safety, this is a time to question whether they are overpaying for future returns.


Precious Metals – The Overlooked Hedge

Despite their enduring role as stores of value, gold and silver account for just 2 to 3% of global financial assets (approximately USD $12 to15 trillion), with physical bullion holdings representing a tiny 0.1%. Retail investors typically allocate about 1% of their portfolios to gold, with silver allocations even smaller; professional wealth managers often hold none at all.

This low allocation stands in stark contrast to expert recommendations of 10 to 20% in precious metals. The material reality is that financial advisors simply do not recommend physical metals to retail investors because there is no commission on offer.  And if an investor prioritises regular yields (as opposed to wealth preservation) then capital gains may not be appealing enough to recommend.

Historically, gold and silver have preserved purchasing power through recessions, inflationary spikes, and market collapses. With stocks trading at historically stretched valuations and sovereign debt at record highs, the opportunity cost of holding bullion has rarely been lower. For patient investors, precious metals may be one of the few undervalued, time-tested safe havens left.


The Bigger Picture

Currently capital is skewed towards risk-on assets.  Of the estimated $500 to 600 trillion in global financial assets, the vast majority is concentrated in real estate (50 to 60%), bonds (20 to 25%), and equities (15 to 20%). Precious metals occupy a fractional share, far smaller than cash, private markets, or even cryptocurrencies. Given the extreme valuations in stocks and the lowering yield prospects for bonds, this imbalance raises a simple question: when the tide turns, will capital flow back to the one asset class that has proven itself for over 5000 years?

Posted on Leave a comment

Crisis Assets in Times of Chaos

Gold and silver have long been viewed a crisis hedge (assets that hold or gain value when markets turn volatile).  Over the last two decades, two major crises—the 2008 Global Financial Crisis (GFC) and the 2020 COVID crash—have tested this thesis.  Gold currently trades at $5,210, silver at $58.81, and platinum at $2,092.  All have offered significant gains to investors year to date.  Today, as global markets show signs of slowing and gold enjoys support above $5,100 in Australian dollars, it’s worth examining how these metals performed during those past upheavals and what the current technical landscape reveals about their evolving role in investor portfolios.


Gold crisis case study one: the GFC, a golden opportunity

During the Global Financial Crisis (GFC) gold proved its mettle. As with all asset classes it experienced a brief correction of 11.5% in late 2008 as liquidity evaporated and investors sold off assets indiscriminately to protect their wealth.  This sell off is typical of all major corrections and occurs in almost all asset classes, a knee-jerk reaction triggered by market panic. The only difference is that some asset classes bounce back faster than others.  Gold rebounded quickly and by 2011 (just over two years later) it reached a then-record high of AUD $1,714 (or an 85% increase), driven in Australia mainly by central bank easing, near zero interest rates, and ballooning sovereign debt.

The increase was amplified by a weakening AUD, offering domestic investors exceptional returns; however, note how currency exchange is the one variable that affects local precious metal prices beyond the spot price which is in USD.  The graph below illustrates the difference in gold prices in AUD versus USD.  Since the GFC, gold increased an additional 27% in local markets compared to the American market to date.  This is due to the Australian dollar weakening against the Greenback over the same period.  In fact, the difference in the two prices directly reflects the variation in the exchange rate between the two currencies.

For example, if gold was to remain steady in USD and the Australian dollar weakens against the U.S. dollar, more local currency is needed to purchase the same amount of metal. Hence it increases in Australian dollars.


Gold crisis case study two: the Covid 19 Pandemic Era, the shock and the surge

The COVID financial crash of March 2020 initially hit all asset classes, including gold and silver. But by mid-year, gold had broken through AUD $2,700 for the first time, with the gold price in American dollars also reaching unprecedented highs. Massive global stimulus, near-zero interest rates, and fears of long-term inflation turbocharged the move.  This time gold initially increased as the stock market crashed, providing protection for those investing in safe haven assets; however, it did eventually correct as the pandemic unfolded and then travelled sideways until the end of 2022 when it started its current climb to new heights.

So why was this time different?  Simply put, markets were unable to play out the expected way due to government interference. The purpose of the interference was to maintain confidence in the economy and it worked: Australia avoided a formal recession that many parts of the world endured.  In this time the government gave away free money through a raft of measures such as Job Keeper payments, Job Seeker supplements, cash flow boosts for businesses, early access to Superannuation, cash payments to households, home-builder grants, loan guarantees and more.  Similarly, the Reserve Bank of Australia engaged in quantitative easing measures such as bond buy backs, cheap funding for banks, and record low rates.

While every government aims to avoid recession, the cost shows on the RBA’s balance sheet.  From AUD $180 billion, it ballooned to $640 billion at the height of the pandemic by early 2022.  It is a similar story in the U.S.  To learn more about the Federal Reserve’s predicament read our article, The Fed is Boxed In While Gold and Silver Look Ready to Fly.  While quantitative easing was employed after the GFC, the significance of its use during Covid is its cumulative effects.  Neither balance sheets for the RBA or the Fed are as healthy as pre-GFC and the Covid 19 Pandemic Era conditions.  It has been exacerbated despite attempts to curb the debt. The problem with holding too much debt is that eventually markets will lose confidence in the RBA or the Feds ability to honour their debt obligations which leads to a precarious financial position that could end in an almighty shakedown in various sectors of the economy.


Precious metals in 2025: consolidation or take off?

Today, gold and silver are again in focus but under different conditions. Gold in AUD terms has climbed over 400% since 2008, while silver is up over 280%. Technical data indicates a strong upward channel for gold, with repeated breakouts followed by consolidations, suggesting a healthy bull market rhythm. Furthermore, a comparison between 2024 and 2025 reveals striking symmetry, where both years saw explosive moves into April followed by mid-year consolidation, setting the stage for potential spring breakouts.  We first predicted this in May and the three months since has proven the theory to be true.

Silver’s technical analysis is also compelling. The recent push above AUD $58 comes after a bullish recovery from $56.18. Historical patterns show that silver tends to outperform gold in the final stages of a bull cycle. The gold-to-silver ratio, now around 1:88, remains far above historic norms such as 1:60 – 70, or the 2024 ratio of what is coming out of the ground at 1:15, implying further upside for silver if a true bull leg begins.


The Broader Market Context

Compared to the equity markets, gold and silver have offered resilience, but not the staggering gains of tech-heavy indices. The NASDAQ has risen over 1,173% since the 2008, while gold has increased 403% in AUD and 266% in USD. However, such growth in equities comes with significant risk, especially as the current cycle nears what the 18.6-year economic model identifies as the “Winner’s Curse” phase: the euphoric end of expansion before correction.  For example, the NASDAQ (tech stocks) has expanded almost six times faster than the M2 money supply (current cash available in America).  This indicates that the NASDAQ is probably at the top end of valuations.  Those invested in tech stocks may feel constrained if the financial corrections are quick and violent, whereas real estate investors are more likely to experience a slow burn as capitulation unfolds in stages over time.

With global debt at record levels and central banks approaching the end of their tightening cycles, conditions are ripe for a return to the monetary expansion playbook, one that historically favours precious metals. If rate cuts resume and inflation expectations rise, the setup may mirror the post-GFC years (early 2010s), where metals staged strong gains in response to policy shifts.


Final Thoughts

History does not repeat, but it often rhymes. During both the GFC and COVID, gold and silver offered protection. As we approach another inflection point, facing economic fragility, shifting rate expectations, and historically strong technical setups, precious metals may once again be poised to outperform.  With September approaching, which is traditionally viewed as crash season in the stock markets, the coming months may determine whether gold and silver are simply pausing… or preparing to leap.


Posted on Leave a comment

Is Silver Undervalued?

Silver achieved a new all-time high when it reached AUD $59.91 last Monday, igniting hopes among investors for a climb to $2,000 per kilogram, or approximately $62.20 per ounce. The rally places silver, currently trading at $58.47, firmly back into the spotlight, joining gold ($5,088) and platinum ($2,201) as metals of increasing strategic interest. But is silver still undervalued at these levels? A deeper look into monetary supply, mining trends, market ratios, and chart patterns may suggest the answer is still yes.


M2 Money Supply  

One useful framework for evaluating silver’s worth is by comparing its price against the U.S. M2 money supply.  This indicator is the U.S. Federal Reserve’s estimate of liquid assets including cash, money in bank accounts and other deposits that can be readily convertible to cash.  This ratio reveals whether silver is keeping up with the expansion of fiat liquidity or falling behind.  If the value of an asset increases more quickly than the M2 money supply then it is more likely to experience a correction in price; conversely it is also true in that if the value of an asset lags behind the M2 money supply indicator then it will likely experience an increase at some point.  Since the mid-2010s, silver has lagged M2 growth, as it did before the Global Financial Crisis (GFC).  This is a potentially bullish signal for silver.

In short, while central banks have aggressively increased currency in circulation, the price of silver has not kept pace. If past patterns hold, the metal may be entering a prolonged phase of strength as it plays catch-up with inflationary expansion.


The Paper vs Physical Divide 

Few markets are as distorted as the silver market. The current ratio of 375 ounces of “paper” silver (via ETFs, futures, and other derivatives) to every 1 ounce of physical silver is staggering. Investment banks hold extensive short positions, many of them naked (meaning they’re not backed by actual metal).  These short positions give the appearance of there being much more silver in circulation than there really is.  As the market is flooded with silver paper contracts, it suppresses the price which leads to an undervaluation of the metal.

If silver prices continue rising, short sellers may be forced to close their positions en masse, triggering a short squeeze. For every $1 gain in silver, bullion banks collectively face losses exceeding $262 million. A $10 rally would create billions in losses — and panic buying to cover those shorts could push prices to extraordinary levels, particularly in the physical market where supply is tight.


Supply Deficits and Rising Demand

 Silver mining production in 2024 totalled just 25,000 metric tonnes, a figure dwarfed by rising demand in the industrial, solar, and investment sectors. According to The Silver Institute data, the market is on track for a fifth consecutive annual deficit in 2025.

This supply imbalance is unlikely to correct quickly. Much of the world’s silver is mined as a by-product of other metals like zinc or copper, limiting miners’ ability to increase output in response to silver-specific demand.  In developed countries mines take approximately five to ten years to wind up once a project is approved.  And it is likely that additional projects may not be considered until the price of silver increases.  Hence, the setup is clear: tightening supply, increasing use cases, and insufficient investment in new production capacity.


The Gold to Silver Ratio Speaks Volumes

Perhaps one of the clearest signals of undervaluation is the gold-to-silver price ratio. Based on 2024 mining production quantities of gold and silver, for every one ounce of gold mined approximately 7.5 ounces of silver is produced. Yet the ratio is 1:86.31 at the time of writing.  This is still high compared to the historical average and suggests that the most recent increase in silver is likely at the very least sustainable, if not suggestive of further gains to come.

During historic silver bull markets, the ratio has narrowed significantly. April saw the ratio at 1:106; prior to the GFC it peaked at 1:104; and during the Covid 19 Pandemic Era it made history when it reached 1:124.   It dropped as low as 31.6 during the Global Financial Crisis in 2011 and dipped as low as 15.1 during the 1980s silver rush. Should silver return to even half of that historical compression, its upside potential becomes dramatic. What does this mean? The ratio simply reflects the relationship between gold and silver, in that if the price of silver increases faster than gold the ratio reduces.  If the price of gold increases faster than silver the ratio rises.  If they both rise or fall together the ratio generally reduces but at a slower rate.  For example, if the ratio is 1:80 would mean that for each $1 silver increases, gold would need to increase $80 to maintain the same ratio.


Charting the Future: The Cup and Handle 

Technically, silver is nearing the final stages of a multi-decade cup and handle formation, one of the most powerful bullish setups in market history. Currently trading at USD $39.19, it is $10 short of its all-time high of $49.21 reached in 2011. Then silver hit the $40 threshold and1 it only took one month to breach $49. If the metal clears the psychological marker of $50, chartists anticipate a powerful breakout, potentially ushering in a fresh multi-year bull market with targets far above $60.  If silver plays catch up to gold, the gold to silver ratio will reduce as it did when it peaked in 1979 and 2011.  And this is when many silver bulls will look to take profits.


A Market Poised to Move

When measured against money supply, mining fundamentals, market ratios, and historical price action, silver still appears undervalued. A strong technical setup, combined with growing industrial demand and a fragile paper market, adds fuel to a potential surge.

For Australian investors, the implications are significant. As the USD-AUD exchange rate fluctuates and the global appetite for physical assets rises, silver remains a compelling candidate for strategic accumulation. Whether you prefer coins, bars, or both, the question may not be whether silver will rise, but when.  To read more on the timing of silver’s anticipated bull run read our previous article When Will the Silver Squeeze Begin?

Posted on Leave a comment

Why Is Powell Such a Big Deal for Trump?

As rumours swirl about Federal Reserve Chairman Jerome Powell’s potential resignation, investor sentiment has become increasingly fragile. Market volatility has spiked as concerns grow that the Fed’s independence may be under threat. Spot gold is trading at AUD $5,126, silver at AUD $58.79, and platinum at AUD $2,278, all buoyed by the growing sense of unease. At the heart of this turbulence is the escalating tension between President Trump and Powell, with the President publicly calling for immediate rate cuts and expressing open dissatisfaction with Powell’s neutral stance. Political interference in central bank policy is rare; open demands for leadership change are even rarer. The implications, however, are far-reaching and merit close examination.


Why Target Powell Now?

President Trump’s criticism of Powell is not new, but it has intensified markedly in recent weeks. The President insists interest rates should be at least 3% lower than their current level, down to 1.5% from 4.5%. The motivation is clear: lower rates would significantly reduce the cost of servicing the U.S. national debt, especially with $9 trillion maturing in 2025. In theory, such a reduction could save the Treasury tens of billions in annual interest.

However, cost control is not part of the Federal Reserve’s dual mandate, which is to maintain price stability and maximise employment. Cutting rates now, while inflation remains sticky and the labour market tight, could undermine that mandate.

There is also a secondary and possibly more important motive: a weaker U.S. dollar. Declining interest rates typically push the dollar lower, giving American exports a competitive boost — a longstanding Trump priority, and one that his administration relies on if their tariff policy is to succeed.


What Happens If Powell Leaves?

If Powell resigns and a new, more compliant Fed chair is installed, rate cuts would likely follow swiftly. This could trigger a rapid unwinding of U.S. Treasuries. If investors anticipate deeper or faster cuts, they may sell off bonds to avoid locking in low yields — especially if inflation is expected to rise. The result? A spike in yields, falling bond prices, and capital flight out of the U.S. debt market.

As Treasuries weaken so does confidence in the U.S. dollar. This typically pushes gold higher in American dollars, both as a hedge against inflation and as a store of wealth in times of monetary instability. A lower dollar also stimulates exports, helping the trade balance. But such gains come at the cost of long-term market trust in the independence and discipline of U.S. monetary policy.


What If Powell Stays the Course?

If Powell remains, and the Fed maintains current rates, it would signal a vote of confidence in the U.S. economy and the central bank’s independence. This would support the Greenback and likely put a ceiling on precious metals in the short term in US dollars; however we do know that a strengthening U.S. dollar is favourable for Australian investors. Treasuries would remain attractive, particularly to yield-seeking investors, and global capital flows would likely stabilise.

While this may temper gold’s near-term gains, it reaffirms the Fed’s commitment to data-driven decision-making. It would also buy time to observe how current inflation dynamics and fiscal policies play out — a prudent move given the Fed’s limited options in a high-debt, high-volatility environment.


AUD vs USD: Why It Matters Locally

From an Australian perspective, the USD-AUD exchange rate is critical. If the U.S. dollar strengthens, precious metals priced in USD become more expensive in AUD — driving local prices higher. Conversely, a falling Greenback can soften metal prices here, even if global spot prices remain stable.

Right now, the Australian dollar has slumped back below USD $0.65 following a surprise rise in unemployment to 4.3%. With 33,600 Australians becoming unemployed in June and the labour force growing only slightly, markets are now pricing in a 98% chance of a rate cut from the RBA as it was last month.  Lower rates will likely weaken the AUD further, setting the stage for precious metals to remain firm in local terms.

Conclusion

The current standoff between Trump and Powell represents more than a political spat.  It signals a broader clash between fiscal ambition and monetary integrity. Should Trump succeed in reshaping the Fed to suit short-term political or fiscal goals, the consequences for Treasuries, the USD, and precious metals could be profound. For Australian investors, the interplay between these forces may well determine whether this is a moment to wait, or to act. When central bank independence is under siege, gold, silver, and platinum become more than just commodities; they become a lifeline of certainty in an increasingly uncertain world.

Posted on Leave a comment

Five Macro Catalysts to Watch in 2025

Since the United States first flagged sweeping tariff measures in April, markets have struggled to adjust positions across asset classes in real time. As we move into the second half of 2025, several macroeconomic and geopolitical forces remain in focus. These catalysts are already shaping investor sentiment and asset valuations across global markets. With gold currently trading at AUD $5,068.79, silver at AUD $57.90, and platinum at AUD $2,160.07, here are five critical forces that could influence market direction in the months ahead.


1. Central Banks Hold Their Nerve—for Now

Both the Reserve Bank of Australia and the U.S. Federal Reserve have resisted pressure to aggressively cut rates thus far. The Fed has held its benchmark rate steady at 4.38% across the last seven meetings, and the RBA has only made a single 25 basis point cut in the last five. With inflation easing but not defeated and new tariff measures from the U.S. still unfolding, central banks appear to be in cautious observation mode.

Australia’s fiscal position is notably more sound than that of the U.S. from a debt to GDP perspective; however, one key distinction remains: America continues to hold its gold reserves on its balance sheet at a nominal USD $42.22 per ounce (requiring legislative changes to revalue it). A simple revaluation would materially improve its financial position overnight—something Australia, which revalues gold annually at market prices, cannot mirror. As global growth continues to stall, unconventional options like these will become increasingly compelling.  Read more about the Fed’s position here.


2. Persistent Inflation and the Stagflation Threat

Despite modest growth in some sectors, inflation remains sticky. A combination of sluggish GDP growth and sustained inflation has raised the spectre of stagflation—a damaging economic mix reminiscent of the 1970s.

In such an environment, monetary tools become blunt instruments. Raise rates and nations risk contraction and job losses; cut rates and another inflationary wave may be unleashed. Business margins shrink, household confidence deteriorates, and capital seeks refuge in assets uncorrelated to fiat—namely, precious metals.


3. A Weakening U.S. Dollar and Diminished Global Trust

The U.S. dollar has lost over 10% of its value in 2025 with the dollar index falling sharply amid ballooning fiscal deficits and lower demand for Treasuries. New tax cuts have added trillions to the projected deficit, while foreign central banks are quietly trimming their exposure to U.S. debt.

Meanwhile, the BRICS alliance continues its push toward dedollarisation, accelerating the erosion of confidence in the Greenback as the global reserve. However, USD’s status as a safe haven is yet to be tested in a significant way. For Australians, a weaker USD lifts metal prices locally—on the contrary a softer Australian dollar against the USD has the opposite effect. And the strength of our local currency is very much dependant on international growth, natural resources and ultimately China.


4. Central Bank Gold Buying Reshapes the Market

In just the first quarter of 2025, central banks purchased 244 tonnes of gold—25% higher than the five-year quarterly average. This follows three straight years of net gold buying above 1,000 tonnes.  Our previous article has already covered that 60% of reserve banks are accruing gold for the purposes of diversification (aka dedollarisation  or “monetary neutrality” for the BRICS nations).  Then they cite protection against geopolitical risk, and then as a hedge against inflation.

Central banks, unlike retail investors, are usually price-insensitive—they are more concerned with strategic allocation than entry level pricing. Their demand builds a strong price floor for gold and has become one of the clearest bullish fundamentals in the market.


5. Geopolitical Risk as the Wildcard

Geopolitical risks remain elevated in 2025, with ongoing conflicts and trade disputes posing threats to global economic stability. The World Economic Forum’s Global Risks Report highlights state-based armed conflicts as the top risk for the year, emphasising the potential for significant disruptions in trade and financial markets.

Such tensions can lead to increased market volatility and impact investor confidence worldwide. But investors in the precious metals market are familiar with why gold and silver are considered safe haven assets in times of uncertainty and prepare accordingly.


Positioning for What Comes Next

For investors who hesitate at current price levels, a prudent and diversified physical metals strategy is key.  The following multi-pronged approach to take advantage of the above fundamentals could include:

Dollar-cost average

Experienced investors know it is more important to accumulate according to financial capacity rather than trying to time the market to secure best prices.  Dollar-cost averaging—strategically buying during price dips—can help reduce the average cost per ounce, offsetting earlier purchases made at higher prices.  This can be an effective strategy if the market allows.


Prioritise insured storage

While securing bullion is a matter of preference, as prices rise risk tolerances can be eventually tested.  Geographic diversification of storage can minimise risk.  For example, you may be comfortable holding 100% of your holdings in a safe a home, but when it doubles in value you may prefer to move 50% of it to a private vaulting facility.


Favour physical over paper positions

“If you don’t hold it, you don’t own it” is certainly conservative, but when applied to the gold and silver paper futures markets it is on point.  The leverage on gold but especially silver paper contracts is eyewatering equating to millions of dollars’ worth of bullion with multiple claims against it.  The number of paper contracts taking delivery of the physical asset has escalated since America announced its tariff policy in April.  At some point, when the physical asset runs out, a very few will hold the metal and everyone else will be left holding the bag.


Conclusion
Each of these five macro catalysts is powerful on its own; together, they signal that the case for precious metals is not merely intact—it is strengthening. Whether it’s central banks, sovereign wealth funds, or retail investors—capital is clearly positioning for a world where volatility is the new normal and trust in fiat is rapidly being repriced.

In uncertain times, nothing is more certain than tangible assets. Gold, silver, and platinum aren’t just commodities—they are insurance against systemic fragility.