Posted on

The State of Silver: Demand and Delay

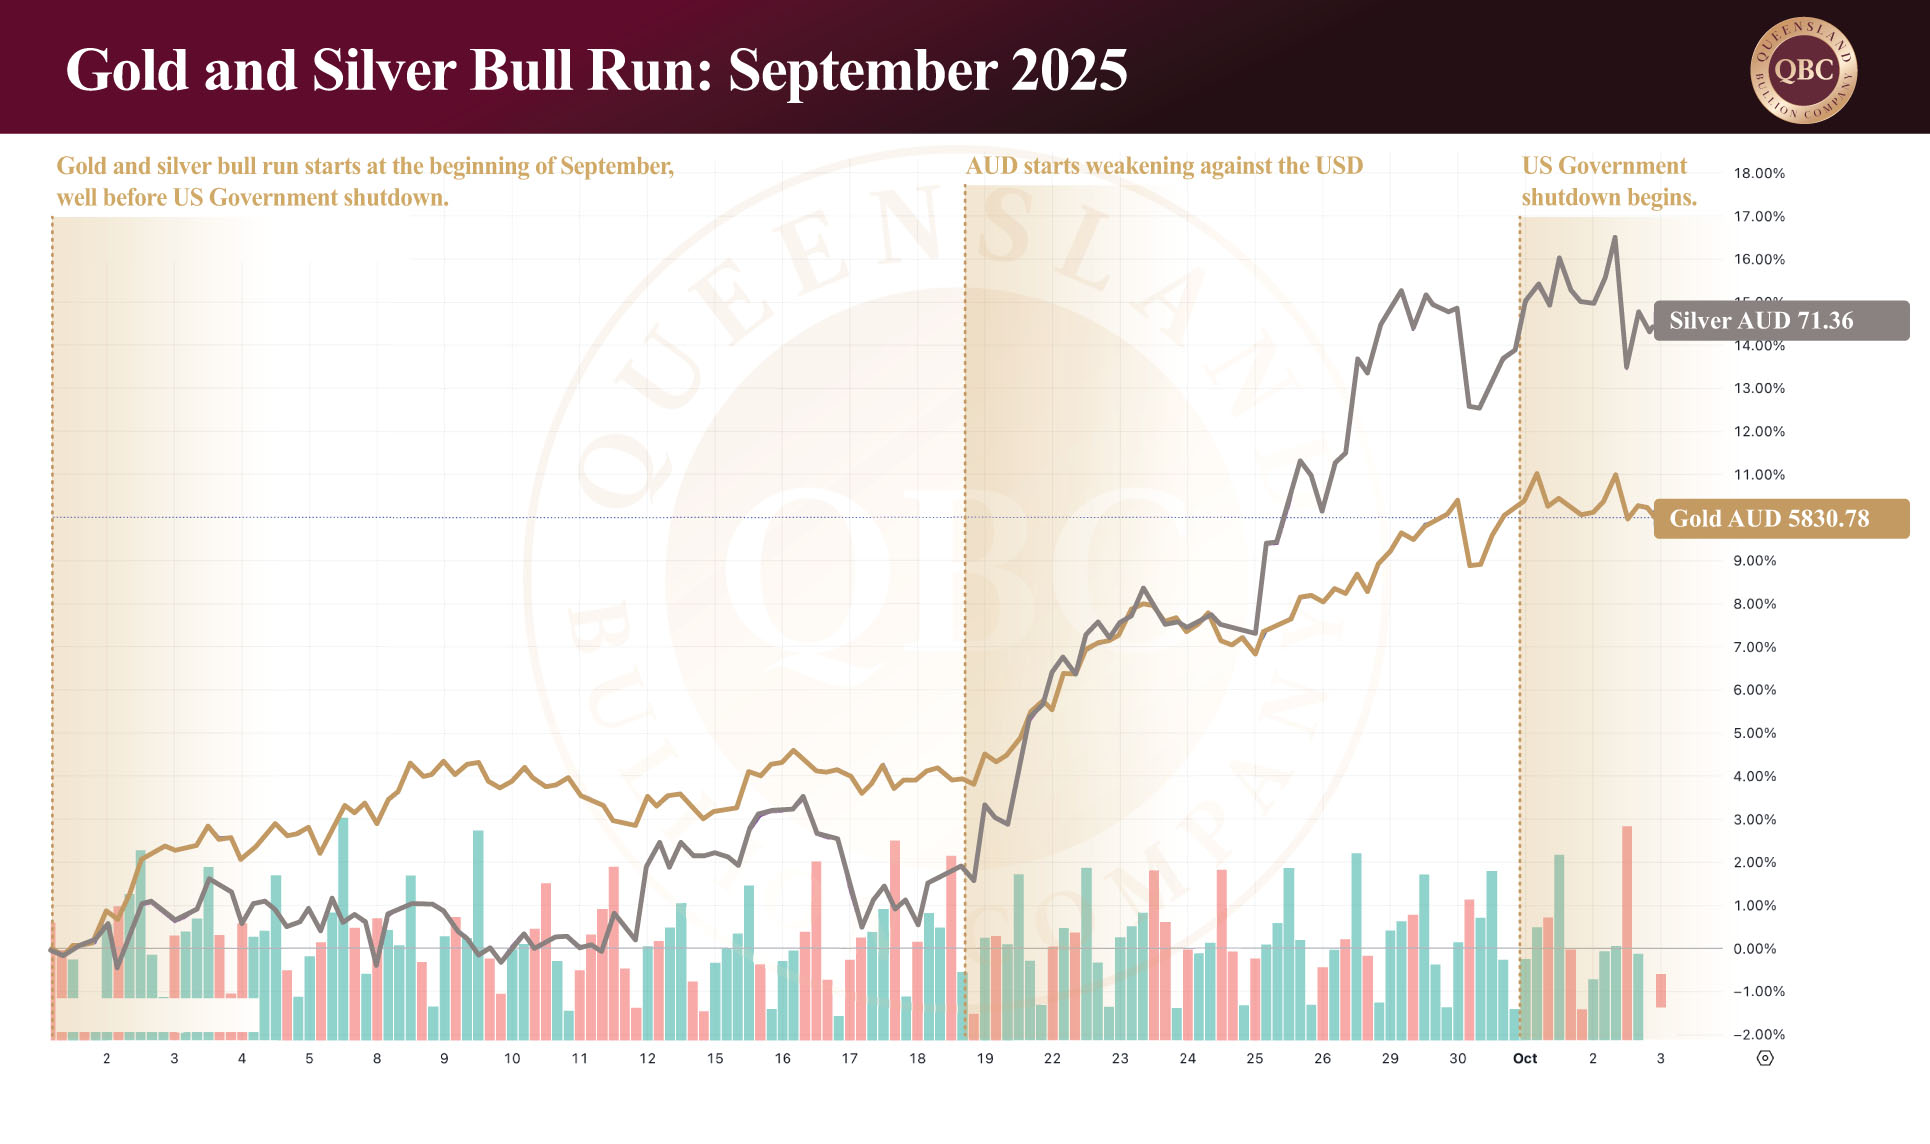
A week ago, gold surpassed the psychologically important milestone of USD $4,000 per ounce, reaching an intraday high of USD $4,218 yesterday. It currently trades at AUD $6,476. Platinum also achieved a new all-time intraday high of USD $1,686 last Thursday, now trading at AUD $2,604. Yet the real highlight lies with silver, which has climbed more than AUD $10 since the start of October — a remarkable gain of over 19%, rising from intraday prices of AUD $69.85 to AUD $83.14 in just fifteen days.  In America it surpassed all-time highs and broke USD $50 six days ago, continuing with strong upward momentum.

Such rapid movement underscores a shifting dynamic in global precious metal markets. Silver’s dual identity as both a precious and industrial metal positions it uniquely within this environment. While demand remains structurally strong, growing delays in the physical bullion are have emerged in the Australian market. Together, these elements define the current state of silver, one of rising appetite and mounting logistical pressure.


The global state of demand

Global silver markets are undergoing a multi-year transformation. In 2024, total silver demand fell by 3%, shaped by competing forces across the investment and industrial sectors. Silverware consumption recorded a modest 2% decline, while investment in cast bars and coins dropped by 22% — the lowest level in five years — led by a sharp 46% fall in the United States. According to the Silver Institute, this pullback in investor demand reflects profit-taking at higher prices, market saturation, and reaction to President Trump’s election.

In contrast, industrial demand rose 7% to reach 700 million ounces, accounting for 59% of total global consumption in 2025. Certain industrial segments have become clear leaders: photovoltaic demand for solar panels has quadrupled since 2015, with the Silver Institute forecasting a further 20% increase this year. Electronics has maintained steady growth of around 5–7% annually since 2021, while electric vehicles and the broader automotive sector continue to expand at approximately 10% per year. Jewellery fabrication also climbed 3%, largely driven by renewed demand in India.

Below is a graph of global silver coin and cast bar demand since 2015, a reflection more of retail investment as opposed to industrial consumption.  The fall in demand since 2022 can mainly be attributed to profit taking, tighter household budgets (or weaker retail sentiment), and preference shifting towards the “paper” silver market.


The global state of supply

The physical deficit in silver now totals nearly 800 million ounces since 2021. This gap shows little short-term relief to any supply concerns.  Global silver mine production has declined 7% since 2016.  Global mine production is expected to peak in 2026 before beginning to decline as several major projects reach end-of-life (mainly in Mexico).  In developed nations new mining projects typically require five to eight years to progress from discovery to production.  And with roughly 72% of silver sourced as a byproduct of other metals, supply cannot easily respond to rising demand. Recycling will offer limited relief, while refined output faces increasing costs and environmental constraints.

However, persistent global supply deficits remain a defining feature of the market stretching over the past four years, with 2025 expected to mark the fifth. The net result is a tightening market, where physical availability continues to contract even as industrial and investor interest builds. In 2025 demand clearly still exceeds supply — leaving the market in a sustained structural deficit. Yet history shows that each major silver deficit has ultimately set the stage for stronger prices, as physical inventories tighten and market confidence erodes.


Demand in Australia

Silver demand in Australia continues to accelerate as an extraordinary squeeze on silver plays out across the country. The Perth Mint is West Australia’s government owned refinery and the only establishment that publishes sales figures.  The refinery saw minted silver products total 578,588 troy ounces in September 2025 — a 36% increase from August and the highest monthly figure since April. It is estimated that the increase could be between 40-60% or even higher for bullion merchants in the private sector.

The Perth Mint’s total silver bullion sales (minted plus cast bars) reached 721,338 troy ounces in September — a 28% increase from August. This surge highlights the renewed strength of the local silver market and a growing concern about the state of the global financial landscape, fiat currency and confidence in our bureaucrats.


Supply in Australia

Access to physical silver has significantly tightened across Australian retail markets in October. This is not due to a lack of raw supply, but rather production bottlenecks in refining and bar manufacturing. With demand roughly double what it was at this time last year, refineries producing branded cast bars are facing increasing pressure. Lead times for delivery have doubled, and further delays are inevitable if the current pace of buying continues.  Now the cost of sourcing both gold and silver is creeping up for refineries as the run on metals deepens further into the supply chain; this will ultimately affect the retail price of both metals sooner rather than later.

While supply constraints are currently logistical rather than structural, they point to a growing imbalance between immediate demand and fabrication capacity — a pattern often seen in the early stages of sustained bull markets.


In summary

Silver investment in 2025 has been defined by a clash of forces: strong investor appetite and constrained supply on one side, and a changing global economy on the other. The metal’s unique dual role for both industrial use and as a safe-haven asset continues to shape its volatility. Trade tensions, equity market corrections, and ongoing geopolitical risks all add to its appeal as a portfolio diversifier.

Expected US interest rate cuts and elevated uncertainty should continue to support silver’s momentum through year-end. With the gold-to-silver ratio still historically high, many investors see further upside potential. However, as access to physical bullion begins to slow, the issue of delay becomes as relevant as demand.  Having a good relationship with your bullion dealer has never been more important.

For Australian investors, the message is clear: silver’s strength is being matched by growing lead times. Securing positions now, while supply remains available and delays are still manageable, could prove a prudent step in an increasingly constrained market.

Posted on

Government Shutdown Erodes Confidence: Precious Metals Rally in Response

Government shutdowns have long been a feature of the American political landscape, but each episode leaves a deeper mark on global confidence. For investors, they highlight the fragility of the fiscal system in the world’s largest economy and raise fresh questions about stability. The latest shutdown, beginning at 12:01 a.m. EDT on October 1 in the US, has already rattled markets. At the time of writing, gold is trading at AUD $5,853.16 per ounce, silver at AUD $71.72, and platinum at AUD $2,420. Precious metals are once again proving their worth as safe-haven assets while investors brace for further turbulence.


What triggers a government shutdown?

The immediate cause of the current shutdown is a familiar one: political gridlock. Congress failed to agree on either a comprehensive budget or a stopgap funding bill, with negotiations collapsing over fundamental disagreements on welfare structures, tax reforms, and federal spending priorities. As a result, non-essential federal agencies closed their doors at the start of October.  The House of Representatives passed a temporary measure, but Senate Democrats blocked its progress through a filibuster (where the minority refuses to end debate), preventing the bill from reaching the required 60-vote threshold. This latest standoff reflects an increasingly entrenched divide between parties, with little sign of compromise on either side.


The immediate fallout for America

The immediate effects of the shutdown are significant. Approximately 750,000 federal workers have been furloughed without pay (with backpay due upon return) and non-essential services are now suspended.  Analysts estimate the economic cost of the Government shutdown is approximately USD $400 million daily.

Unlike prior shutdowns, this impasse lands at a time when global markets are already on edge. Inflation remains above target of 2% at 2.9%, growth is faltering, and geopolitical risks are multiplying. The impending delay in publishing jobs or inflation data now clouds the outlook for the Federal Reserve ahead of its next meeting, complicating monetary policy decisions. Meanwhile, threats from the White House to cut federal jobs outright only add to the sense of instability.


Lessons from past episodes

Government shutdowns are not new however their severity has varied. The 2018–2019 shutdown under President Trump stretched to 35 days, the longest in history, while the 2013 episode under President Obama lasted 16 days. Most shutdowns since 1980 have been resolved within one to three weeks.  The current domestic political climate for the U.S. has experts suggesting a potentially prolonged stalemate due to political unwillingness to yield on core policy issues.  This is playing out in an already fragile economic backdrop. If it does, the economic and financial damage will likely intensify, spilling into the global economic framework as uncertainty.


Gold’s historical response

Gold has often shown resilience during shutdowns with investors moving to hedge against both political dysfunction and economic uncertainty. The difference this time lies in the broader environment: political turmoil only magnifies the instability around high inflation, slowing growth, and colossal fiscal debt, all of which are fundamentals that existed long before the current government shutdown was even contemplated. While past shutdowns have produced mixed results for precious metal prices, the current rally stands out for both its speed and its scale and is more in response to underlying economic fragility than that of the shutdown itself.

The symbolism is as important as the substance. Each shutdown reinforces doubts about America’s ability to manage its own finances, eroding the credibility of both the US government and the US dollar as anchors of global stability. In this environment, gold, silver, and platinum are once again proving themselves as stores of value.


Confidence Under Pressure

Shutdowns deliver more than just administrative disruption. They deliver a psychological blow to global markets by highlighting dysfunction at the heart of the world’s largest economy. The US dollar remains vulnerable if confidence in America’s political system deteriorates further.  This erosion of trust matters because the US still anchors international markets. Each round of brinkmanship (dangerous policy practice or political strategy) weakens that position. For international investors the signal is clear: political risk is no longer confined to emerging markets but continues to seep into the West’s sole superpower. It infects fiscal and financial systems with apprehension and uncertainty and spreads outward, carried through shifting capital flows – flows that lead to gold, silver and platinum.

The below graph illustrates that, while shutdowns are effective mechanisms of destabilisation and they contribute to a lack of confidence, it is not the primary cause of the current bull run in either gold or silver.

Conclusion

Even though gold, silver and platinum have increased considerably since the beginning of September, the political climate underscores the fragility of the financial system and adds yet another layer of uncertainty to an already volatile global environment. For investors, the message is simple. When trust in governments falter, and when political dysfunction threatens financial stability, gold and silver remain the ultimate safe havens.

As Australia navigates its own economic challenges, from currency weakness to reliance on external demand, precious metals offer a layer of protection that cannot be replicated by cash, bonds, or equities. In an era where shutdowns, deficits, and political gridlock are the new normal, the case for holding gold and silver has rarely been stronger.

Posted on

Gold and the Australian Dollar: A Two-Decade Story of Strength and Weakness

Gold has surged to record highs around the world since the turn of the century, and Australia has been no exception. Yet, for Australian investors, the value of gold is shaped not just by its international price but also by the performance of the Australian dollar. Understanding this relationship is crucial. Currency strength can magnify gold’s gains or dilute them, and over the past 25 years, it has been a decisive force in how local investors experience gold’s bull and bear markets.  Currently, gold trades at $5,736, silver at $68.76, and platinum at $2,357.58.  With the continuation of a bull run that could last months, possibly years, a close examination of gold’s history in the context of the Australian dollar is beneficial.


Gold and Currency Movements

For Australian investors, any discussion of gold would do well to include the local currency.  In essence, when the Australian dollar is weak against the Greenback it means that local prices for gold and silver will increase.  On the contrary, a stronger Australian dollar would equate to softer local prices, reflecting the inverse relationship between currency value and precious metals pricing.

In Australia we run two risks.  We are subject to currency exchange and also the price of metal. Investors who are not based in America need to factor in both elements when assessing their local gold market.  For example, if the market price of gold increases in the U.S. it does not necessarily translate to an increase in the Australian market; if the AUD and gold price increase simultaneously, then the increase in the AUD price will absorb some of that gain and it will not be as pronounced.

The below long-term chart for gold in AUD clearly shows an upward trajectory, underscoring the metal’s enduring value as a hedge for local investors.


The AUD’s Sideways Story Since 2000

While the AUD-USD exchange rate has been volatile since 2000, it has effectively moved sideways over the longer term. In January 2000 the exchange sat at USD $0.6562 per AUD $1, while at the time of writing it trades at USD $0.6536 — virtually unchanged. Over the full period, the net result is a stable currency exchange against the Greenback. However, shorter periods tell a very different story.

Since the Global Financial Crisis (GFC), the Australian dollar has trended lower against the Greenback. Technically, the pattern in the below chart resembles a flag formation, implying that eventually the currency will break either to the upside or the downside. Assuming gold prices remain stable, let us break down possibilities on what may play out in the future if our local dollar was to move in each direction.

If it breaks higher, the AUD could move towards USD $0.75 and remain within its long-term trading range, which could shave around 13% off gold prices locally. The key question would then be whether gold in USD rises enough to offset that currency strength.

The Risk of a Break to the Downside

If instead the AUD breaks lower, more local currency would be required to purchase the same quantity of gold. This would likely push prices higher in Australian markets, even if gold in USD remained stable. Ultimately, the direction of the break will be dictated by confidence in both the Australian and American economies.

Australia’s dollar has long been tied to China’s demand for iron ore. From 2000 onward, China’s rapid industrialisation created robust demand which underpinned confidence in the AUD. After the GFC this support was especially strong. Today, however, China’s growth has slowed, and it is no longer the reliable buyer it once was. Should another major financial correction unfold (similar to or greater than the GFC), there is no obvious replacement source of confidence to support the AUD.  Without this, as the AUD moves closer to the end point in the flag formation, the more likely outcome is a break to the downside — even if the USD itself also weakens against other global currencies.


Gold’s Outperformance in Australia

Since the GFC the Australian price of gold has increased at a faster rate than if you were to buy in American dollars, underscoring gold’s role as a hedge against currency weakness. In August 2008, gold traded around USD $871 per ounce. By September 26, 2025, it had climbed 329% to USD $3,741. In AUD terms, the rise was even steeper (from AUD $1,092 to AUD $5,726 per ounce), providing an increase of approximately 424%. This disparity illustrates how currency depreciation has amplified the performance of gold for local investors since the GFC.

The chart below was produced prior to the current September rally and highlights this long-term trend. Its recent run only reinforces the story: for Australians, gold has been even more rewarding than the headline USD figures suggest.

Read another article that address’s gold’s relationship with the AUD here


A Hedge Against Currency Erosion

Gold’s enduring strength in Australian markets is not just a reflection of global demand, but also of the relative weakness of the local currency. As long as the AUD remains tied to uncertain demand from China, and with little to backstop confidence in the event of another global financial shock, the risks of a break to the downside remain real. For investors, this only strengthens gold’s case as a defensive asset.

In an economy exposed to external risks and subject to volatile exchange rates, gold continues to stand apart. For Australians looking to preserve wealth in an era of uncertainty, gold remains the cornerstone of stability.

Posted on

Gold Outpaces Property and Shares: A Long-Term View

Gold and silver have set new all-time highs in 2025 for Australian markets. For local investors, the question is not whether gold has risen but how it has performed relative to other key asset classes over the last two decades. When compared with residential property and the ASX 200, the results are clear: gold has outperformed both, offering superior wealth preservation in an era of rising costs and uncertain economic growth.


A snapshot of Australia

 Australia’s economy continues to show mixed signals. Annual GDP growth sits at 1.82%, a modest pace for a developed nation. Inflation is currently 2.09% — at the lower end the Reserve Bank of Australia’s target range of 2% to 3%. Unemployment is holding at 4.19%, reflecting a long-term trend for reduced unemployment. Against this backdrop, gold is trading at $5,528 per ounce, silver at $64.26 per ounce, and platinum at $2,123 per ounce.

These figures highlight the resilience of precious metals compared to the broader economy. While economic growth is sluggish, inflation sticky, and labour markets uncertain, gold continues to provide premier net purchasing power protection despite Australia’s fiscal and financial situation.


Gold versus the Australian real estate market

From 2000 onwards, a divergence between Australian residential property prices and wages became clear. The Australian House Price Index climbed from under 40 in early 2000 to 196.15 at the start of 2025 — a 390% increase in twenty-five years. Over the same period, average adult wages rose just 40%, from $803 to $2,011 per week.  This imbalance has priced many Australians out of the property market, pushing them into long-term rental arrangements.

The 2008 Global Financial Crisis (GFC) revealed the resilience of Australian housing compared to overseas markets: while the United States saw prices collapse by 27.4% (with 50 to 60% reductions in harder hit areas), Australian residential property fell only 8.5% in eleven months. Today, however, with property prices having so far outpaced wages, the risk of a deeper correction looms.

So how has gold compared? The median Sydney property price is $1,500,543. Melbourne sits at $949,232, and Brisbane at $ 1,021,395.  In percentage terms it means that from the year 2000 Sydney prices have increased 422%, Melbourne 396%, and Brisbane 500%.  Yet gold has risen 1,046% on today’s spot price. If property prices had matched gold’s growth, Sydney’s median house price would stand at $3,002,020, Melbourne at $ 1,997,860, and Brisbane at $1,778,200.  From a household affordability perspective, it is fortunate that residential property has not risen in line with gold. Yet when viewed purely as an investment, gold has consistently outperformed.

From the perspective of capital growth, 2025 Sydney and Melbourne median property are five times the value than what they were in 2000.  Brisbane median property prices are six times higher. Yet gold is more than ten times the value in the same period.  Had gold been chosen over property for investment purposes, it is possible the investor could be approximately twice as wealthy.  It should be noted that rental income and ownership costs have not been included in the above comparisons. These factors vary widely between cases, and in many instances, the expenses associated with ownership can outweigh the rental income received.

The long-term chart below shows that fewer ounces of gold are required each year to purchase a property in Australia’s major cities, despite housing prices rising exponentially relative to wages.

Read more about how the majority of wealth around the world is held in real estate here.


Gold Versus the ASX 200

It is a similar picture when gold is measured against equities. The ASX 200 Index, considered the benchmark for Australian shares, was launched on March 31, 2000, at 3,133 points by Standard and Poor’s (a premier credit rating company in the United States). Today it sits at 8,825 points.  The ASX 200 shows 181% increase over twenty-five years.

However, one of the fundamental differences between stocks and precious metals is that stocks can offer dividends.  For a realistic and fair comparison dividends need to be considered.  The average dividend on the ASX 200 Index between the year 2000 and 2025 is estimated at 4% per year.  If we adjust the above to include dividend payouts, the ASX 200 would be closer to 13,667 points.  This new figure shows an increase of 336%.

On paper, this is an impressive gain. But had the ASX matched gold’s 1,046% rise over the same period, the index would be trading at 142,956 points. In relative terms, gold has far outpaced equity markets.

The below data also shows that progressively fewer ounces of gold are required to hold the same position in the ASX 200. This demonstrates that while shares have grown in value, gold has grown faster and has done so without the volatility of equity markets or the reliance on dividend flows.


 Gold’s Enduring Advantage

The evidence is compelling. Over the past twenty-five years, gold has outperformed both residential property and equities in Australia. While the housing market has surged beyond wage growth and the ASX 200 has delivered respectable returns, neither asset class has kept pace with the relentless rise of gold.

For Australians, the lesson is clear: gold remains a cornerstone of wealth preservation. It is a hedge against inflation and an outperformer against the nation’s two most recognised asset classes. In times of uncertainty, when growth is weak and markets are stretched, gold stands out as the asset that continues to deliver.

Posted on

Is AUD $7,500 Plausible in 2026?

Gold is setting new all-time highs while silver is trading at levels not seen since 2011 and surpassing the psychologically important marker of $2000 per kilogram in Australian markets. This week’s breakout may mark the beginning of the next leg up in a broad precious metals rally. At the time of writing, gold is trading at AUD $5,434, silver at AUD $62.72, and platinum at AUD $2,127.  So what is behind the current rally and where does this place the price of gold in the next six months?  As many Western traders return from Summer holidays abroad, let us unpack five major reasons why precious metals are once again on the move.


 Expected Fed rate cut

A critical catalyst for the rally in gold prices is the market’s anticipation of a rate cut by the United States Federal Reserve on September 17, 2025. A 25-basis-point reduction is widely expected, although there is speculation the Fed could take a more aggressive step with a 50-point cut if incoming data continues to show weakness. The U.S. July jobs report revealed only 73,000 jobs created, well below expectations, with downward revisions for earlier months. Such figures underscore a softer labour market, which typically strengthens the case for rate cuts.

Lower rates support gold in two ways: they weaken the US dollar, making bullion more affordable for foreign buyers, and they reduce the opportunity cost of holding non-yielding assets. Together these factors add momentum to the current rally as capital shifts away from Treasury bonds to either higher-risk but higher-yielding equities, or safe havens such as precious metals.


Depreciation of the US dollar

Since President Trump’s return, the US dollar has depreciated by roughly 8% based on the U.S. Dollar Index. This reflects the Administration’s goal of incentivising domestic manufacturing to make it cheaper to export internationally, a mandate that President Trump campaigned on prior to his election last November. When the US dollar weakens, gold and silver often gain support as international investors see lower precious metal prices in their own currency. This depreciation has further fuelled global appetite for precious metals, reinforcing their status as preferred safe-haven assets; however, it is worth noting that since 2011 the Australian dollar against the Greenback has generally softened resulting in overall higher precious-metal prices in the Australian market.


Inflation and money supply growth

Another key factor is the expansion of the US money supply. After a rare contraction in 2022–23, the M2 money supply (available cash) has surged by USD $1.36 trillion since late 2023, reaching a record USD $22 trillion. Such growth is usually inflationary. Precious metals have long been viewed as natural hedges against monetary expansion, and gold has responded strongly to these conditions. Importantly, this trend is global, as central banks worldwide continue to expand balance sheets in response to economic fragility.


Rising US national Ddbt

The US national debt has now reached USD $37.19 trillion and is projected to surpass USD $40 trillion by the end of this year. Policy measures under the One Big Beautiful Bill Act (passed on July 4, 2025, America’s Independence Day) are expected to accelerate this trend, adding more than USD $3.4 trillion in direct spending and even more when accounting for interest. The relentless rise in debt erodes long-term confidence in fiat currencies, and perception of the Government and Fed’s ability to meet their debt obligations.  This jeopardises the bond market (another safe haven asset), and strengthens the case for holding precious metals as insurance against monetary debasement.


Capital rotation out of equities

Perhaps the most significant shift underway is a gradual rotation of capital from equities into precious metals. The Dow-to-gold ratio broke below its long-term uptrend line in 2024 that has been in place since the Global Financial Crisis, signalling a structural change: momentum has moved from stocks to metals. Historically, such rotations last 10–15 years. With US equities trading at valuations even higher than those preceding the Dot-com bust and the Great Depression, a correction appears inevitable. The Buffett Indicator currently sits at 214%, far above its historical average of 86%. When this bubble deflates, what is currently a small trickle can potentially become a substantial flow of capital finding its way into gold and silver.


Australian Gold Prices in April 2026

The foundations for another bull run in precious metals are now firmly in place. The question is what comes next. History often provides the clearest guide to the future. Between September 2024 and April 2025, gold rose 42%, a gain of AUD $1,591. So far this year, the price has closely mirrored last year’s chart patterns (as detailed in our earlier article). If that rhythm were to repeat, another 42% increase would imply a potential price of AUD $7,584 by April 2026. Even a more conservative trajectory suggests a range between AUD $6,000 and AUD $7,580 is plausible.

This outlook aligns with major institutional forecasts. Both JP Morgan and Goldman Sachs project gold to reach USD $4,000 (around AUD $6,125) by mid-2026. Goldman Sachs has even suggested that USD $5,000 (AUD $7,658) per ounce cannot be ruled out under certain conditions. In this context, today’s highs may not be an end point, but the makings of a much larger move.

In summary

Gold’s bull market is still in its early stages, driven by a powerful mix of catalysts: the prospect of a US rate cutting cycle, persistent inflation, ballooning debt, and the beginning of a capital rotation out of stocks. For silver, the rally is amplified by its dual role as both an industrial metal and a store of wealth, with technical patterns suggesting there is still significant upside potential.  For gold, central banks continue to accumulate at record levels, the metal’s role as the cornerstone of monetary security is being reaffirmed.

For Australian investors, these forces highlight why gold and silver remain essential holdings. With both metals outperforming equities over the past year, and with economic uncertainty unlikely to ease soon, precious metals continue to offer stability, protection, and long-term opportunity.

Posted on Leave a comment

Precious Metals Strengthens as Rate Cuts Loom and Silver Surges

Gold is currently trading at AUD $5,217, silver at AUD $59.64, and platinum at AUD $2,075. With prices consolidating close to record highs for both gold and silver, two key forces are coming into focus for investors: the anticipated cycle of rate cuts in the United States and the accelerating appetite for retail investment for silver in Australia. Together, these developments signal that gold and silver may have greater room to run.


The Rate Cut Cycle and Gold

For over a year markets have debated when the United States Federal Reserve would shift from tightening to cutting rates. That moment is now drawing close.  Each move is significant because it lowers the yield on short-term government bonds, reducing the “opportunity cost” of holding precious metals which generate no return.  When bonds pay less, investors look for safety elsewhere. History tells us that gold thrives in these conditions. Lower front-end yields (such as the U.S. two-year Treasury bond) remove one of the last barriers for large-scale institutional funds to allocate into bullion. At the same time, longer-dated yields in the American market remain elevated, a signal that investors demand greater compensation for risks such as political interference and unrestrained government spending. This cocktail of falling short-term rates and sticky long-term risks creates the perfect backdrop for gold to rise further.

Gold has already gained close to 30% this year in America (and just over 20% in Australia), but the environment remains supportive. Inflation in the United States is proving stubborn, government spending continues at record levels, and political risks weigh heavily on the credibility of monetary policy. These conditions strengthen gold’s dual role as both an inflation hedge and a safe haven against financial instability.

Looking back at history, gold has proven to climb more than 30% in the two years following the first rate cut. If the current cycle repeats that pattern, then the next leg of gold’s bull market may only just be beginning.  Read more about U.S. Fed rate cutting cycles and their relationship with recessions in our previous article.  By way of the Fed cutting rates, pressure will mount on the U.S. dollar, which in turn places pressure on gold purchased in AUD.


Silver’s Rising Influence in Australia

While gold continues to dominate headlines, silver has quietly outperformed in both American and Australian markets. So far this year, silver has climbed more than 31% in America, outpacing gold’s 28%.  Similarly, in Australia silver has seen over 25% gains compared to gold’s gains at 21%.  Much of this strength reflects growing demand from retail investors, and Australia has emerged as one of the largest markets worldwide for physical silver bars and coins.

As recently as 2019, Australian silver demand stood at under 3.5 million ounces. By 2022 it had surged to more than 20 million ounces, making Australia the fourth-largest market for physical silver retail investment globally. This growth has been supported by the favourable tax environment for bullion: generally, investment-grade precious metals carry no goods and services tax and, when held through retirement accounts, can ultimately benefit from reduced capital gains tax.

Although 2023 and 2024 saw a period of profit-taking, demand has remained far above pre-pandemic levels with expectations for silver investment to continue rising again this year. Many investors also hold the view that silver is undervalued relative to gold, strengthening its appeal.


Silver’s Dual Character: Industrial and Monetary

Unlike gold, which derives most of its demand from investors and central banks, silver enjoys a dual advantage as both an industrial metal and a monetary one. The global transition to renewable energy continues to drive consumption, with solar panels expected to absorb a record 140 million ounces of silver this year. Growth in electric vehicles, batteries, and data centres is adding further momentum.

At the same time, silver’s traditional role as a safe haven is once again in the spotlight. Rising global debt, persistent inflation, and escalating geopolitical risks are pushing investors toward tangible stores of value.  The price of silver compared to gold also offers a lower entry point into the precious metals markets. Technical patterns also suggest further potential, with the gold-to-silver ratio sitting well above historical averages. If that gap were to close, silver prices would need to rise meaningfully from current levels.

Preparing for What Comes Next

Taken together, the signals are clear. Gold is positioned to benefit from the global shift toward lower rates, while silver is finding strength in both industrial and investment demand. For Australians, the dual advantages of a supportive exchange rate and favourable taxation make these metals especially compelling.  The combination of weakening domestic currency, declining real yields, and surging silver demand paints a picture of continued resilience in the precious metals market. For those positioned early, the next stage of this cycle could prove to be transformative.