Posted on

Purchasing Precious Metals: How to Make Sense of Premiums

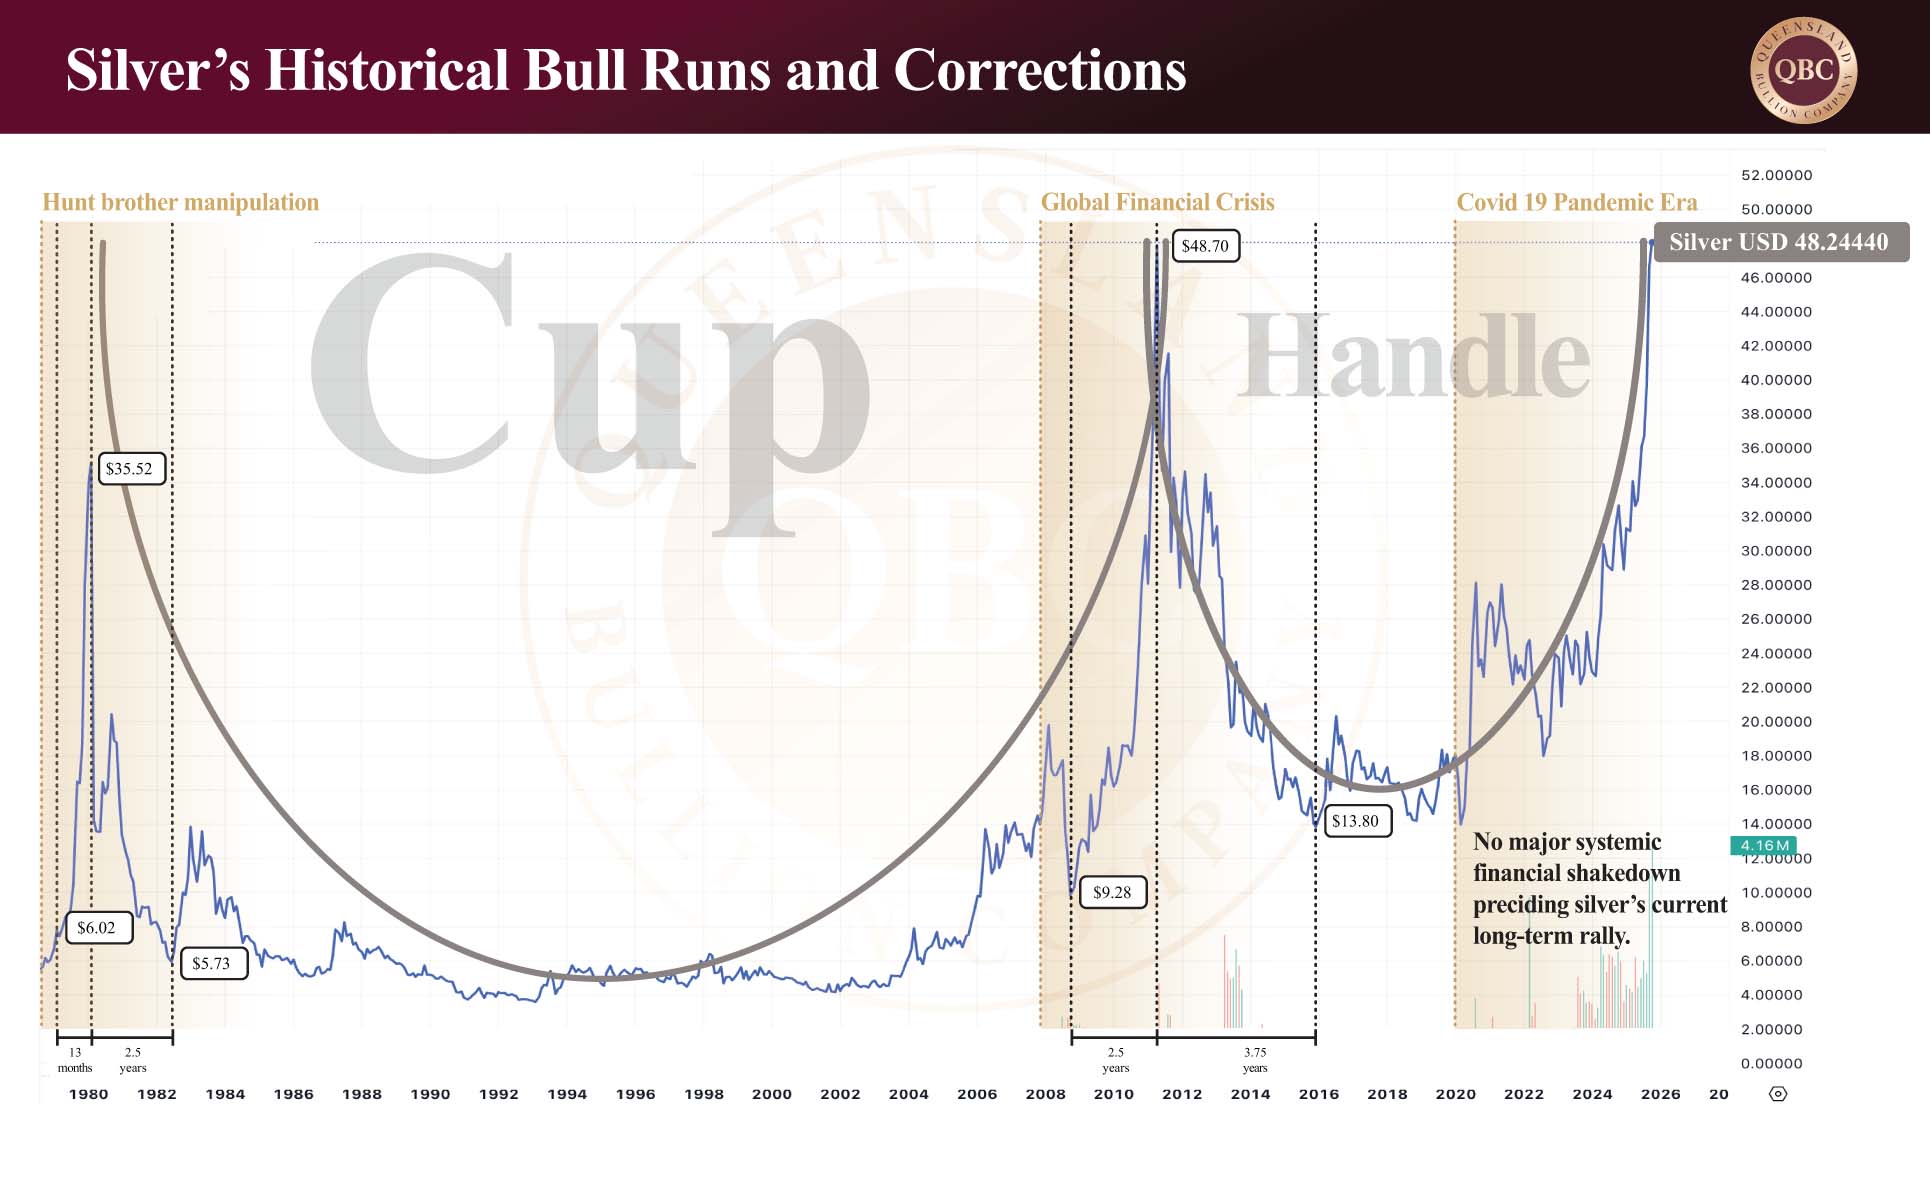
The past fortnight delivered one of the most dramatic reversals in silver’s modern history. After surging into overbought territory in January, silver’s euphoric run came to an abrupt end. At its peak on January 29th, silver reached an intraday high of AUD $172, only to plunge to AUD $92.90 by February 6th, a staggering $79 correction in just one week. It marked the most significant weekly decline since the volatility of the 1980s.

At the time of writing, gold trades at approximately AUD $7,093, silver at AUD $106.66, and platinum at AUD $2876. While the headline price moves captured attention, Australian retail investors quickly discovered that spot price is only one part of the equation. Two overlapping forces, extreme volatility and rising wholesale premiums, have shaped the local buying environment. Understanding both is essential when navigating precious metals markets during periods of stress.


Volatility: what really caused the crash?

Mainstream commentary was quick to attribute the sudden drop in asset prices to U.S. President Donald Trump’s nomination of Kevin Warsh as the next Federal Reserve Chair. Markets had largely anticipated a more dovish appointment, someone more likely to lower interest rates to support growth. Instead, Warsh is widely regarded as more hawkish, potentially favouring continued quantitative tightening and even rate hikes if inflation persists.  News outlets framed the sell-off as a market repositioning event, investors adjusting expectations around interest rates and economic growth after Trump suggested Warsh could help deliver 15% economic expansion, something the U.S. has historically achieved only during wartime mobilisations.

However, while political headlines dominated coverage, a more mechanical force was unfolding beneath the surface.  The CME Group (owners of the COMEX) raised margin requirements on silver from 15% to 18%, and on gold from 8% to 9%. In the following two weeks, margin requirements were adjusted upward three separate times.

When margin requirements rise, leveraged traders must either inject additional capital or liquidate positions. In a market already heavily leveraged, this can trigger cascading forced sales. Automatic stop-loss orders are hit. Positions are unwound. Selling feeds on itself.  The result was not simply a change in economic expectations, it was a forced liquidation cycle. Historically, margin hikes have been used during overheated conditions to cool speculative excess. In this instance, the scale of leverage amplified the impact dramatically.  Read more about the paper versus physical divide within Western markets here.


How did this affect the Australian market?

Volatility at this magnitude does more than move prices; it alters trading behaviour.  Bullion merchants must constantly manage inventory risk. When silver swings $79 in a week, the ability to hedge exposure becomes strained. Depending on previous positioning and risk appetite, many dealers responded differently.  Some temporarily closed trading; others limited online or in-store transactions; still others introduced minimum purchase thresholds.

Queensland Bullion Company was one of a very few operators that remained open and trading throughout the volatility, both in-store and online, but the broader industry response highlights how extreme paper market movements can disrupt physical retail access.


Western spot vs Shanghai spot: the physical disconnect

To understand premiums, one must understand the divergence between Western and Shanghai spot pricing.  Western spot prices are derived primarily from futures contracts traded on the COMEX in New York and the London market. Each silver futures contract typically represents 5,000 troy ounces. However, for every contract backed by physical silver, estimates suggest there may be 350 or more paper claims referencing the same underlying metal.  The result is a pricing mechanism dominated by leveraged financial instruments (paper contracts), not necessarily by physical supply.

China operates differently. Through a licensing system as at January 1, 2026, the Chinese government has limited exporters to approximately 44 approved entities and maintains tighter strategic control over silver flows, indicating its willingness to maintain as much control of physical silver as possible.  Hence, Shanghai pricing reflects a market far more influenced by physical metal than derivatives.

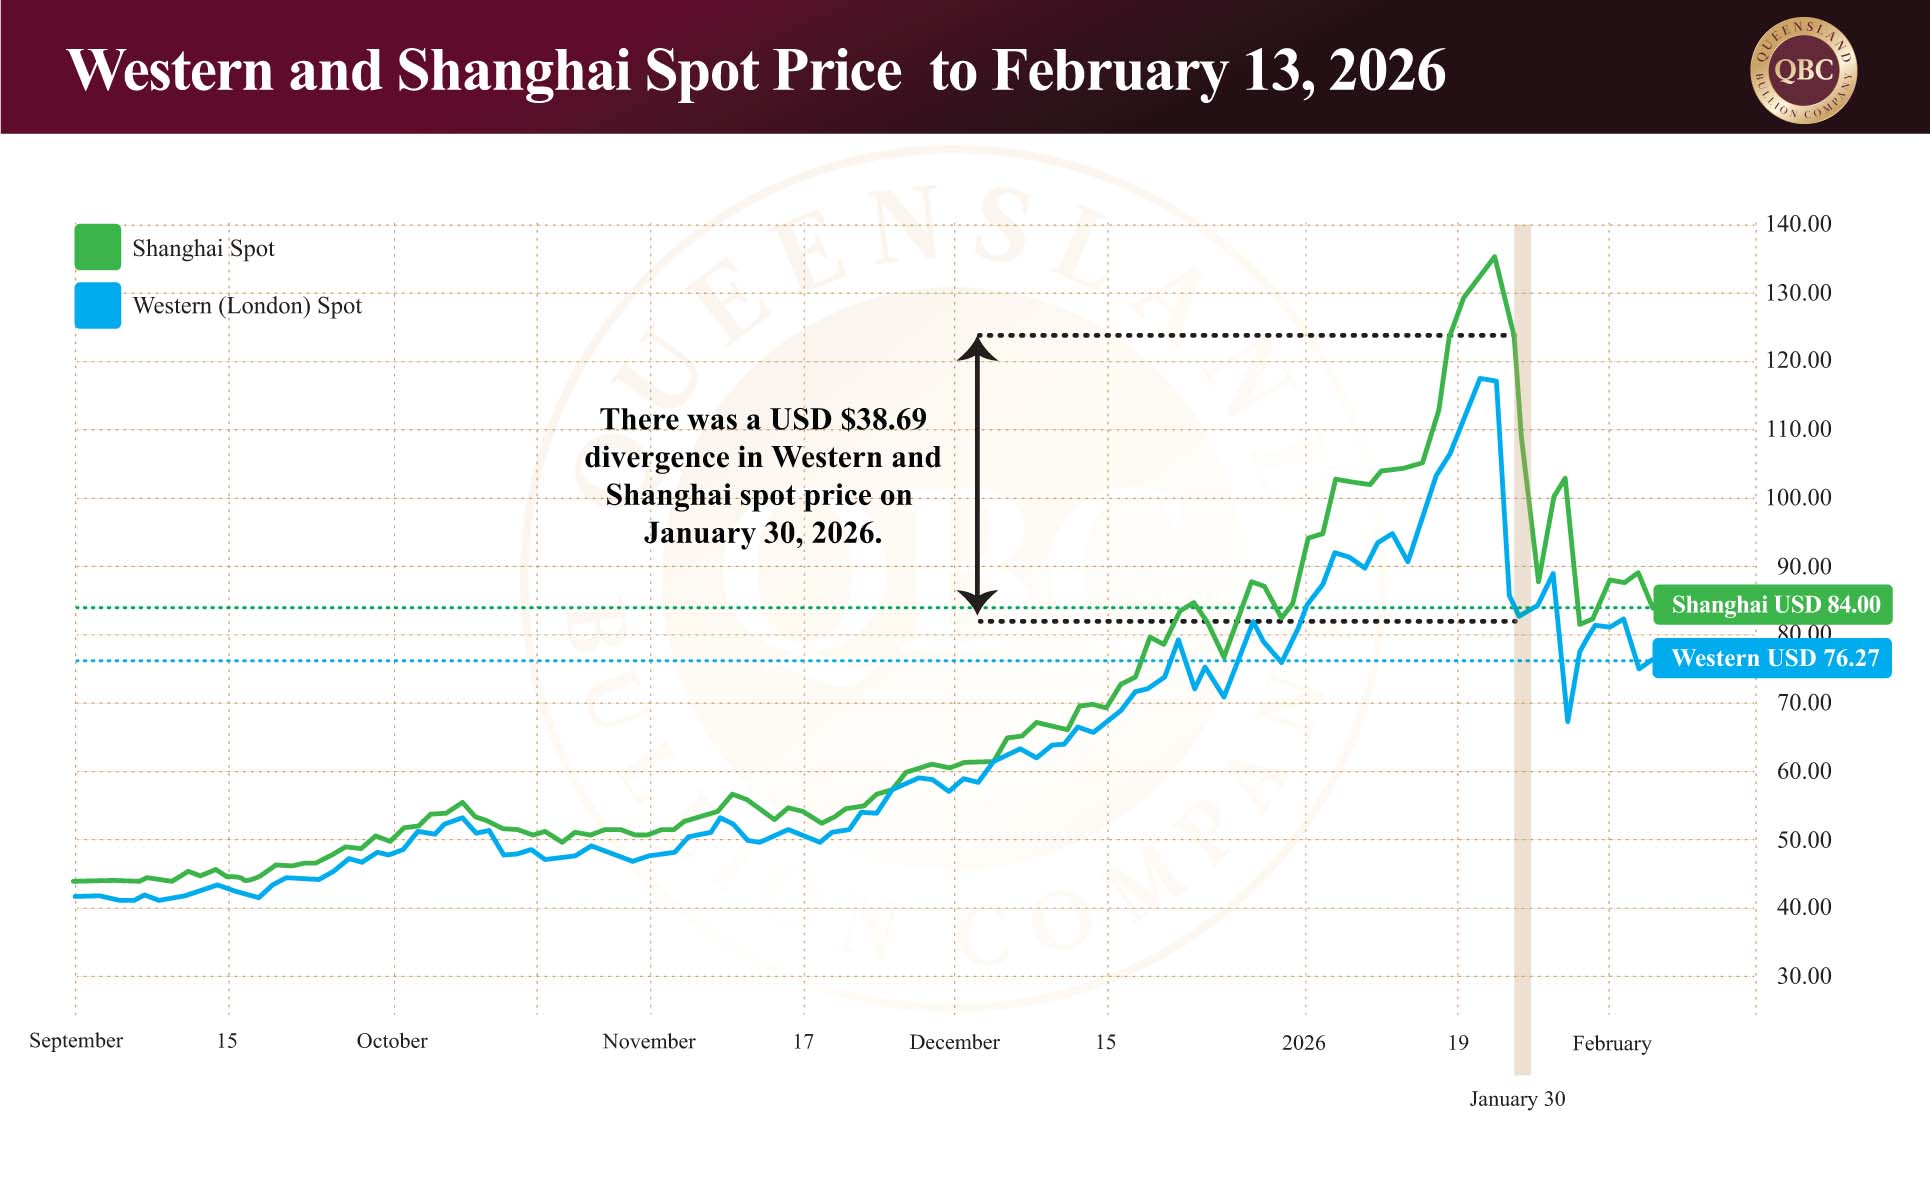
Traditionally, Western and Shanghai spot prices track closely. But during January’s volatility, the gap widened dramatically. On January 30th the divergence reached USD $38.69, an unprecedented spread and a clear signal of strain within the Western paper market and the lack of silver in the system. When physical demand outpaces available supply and paper claims exceed deliverable metal disconnects appear.

Sourcing silver in Australia

Australian refineries historically sourced much of their stock domestically. That dynamic has now shifted.

With tight global supply conditions and a persistent five-year deficit between mined output and industrial demand, refineries are increasingly sourcing silver from Asia. Asian markets reference Shanghai pricing, not Western paper pricing.  This means refinery input costs have risen materially.  Those higher wholesale costs flow downstream: refineries pass increased costs to bullion merchants and bullion merchants adjust retail pricing via higher premiums.

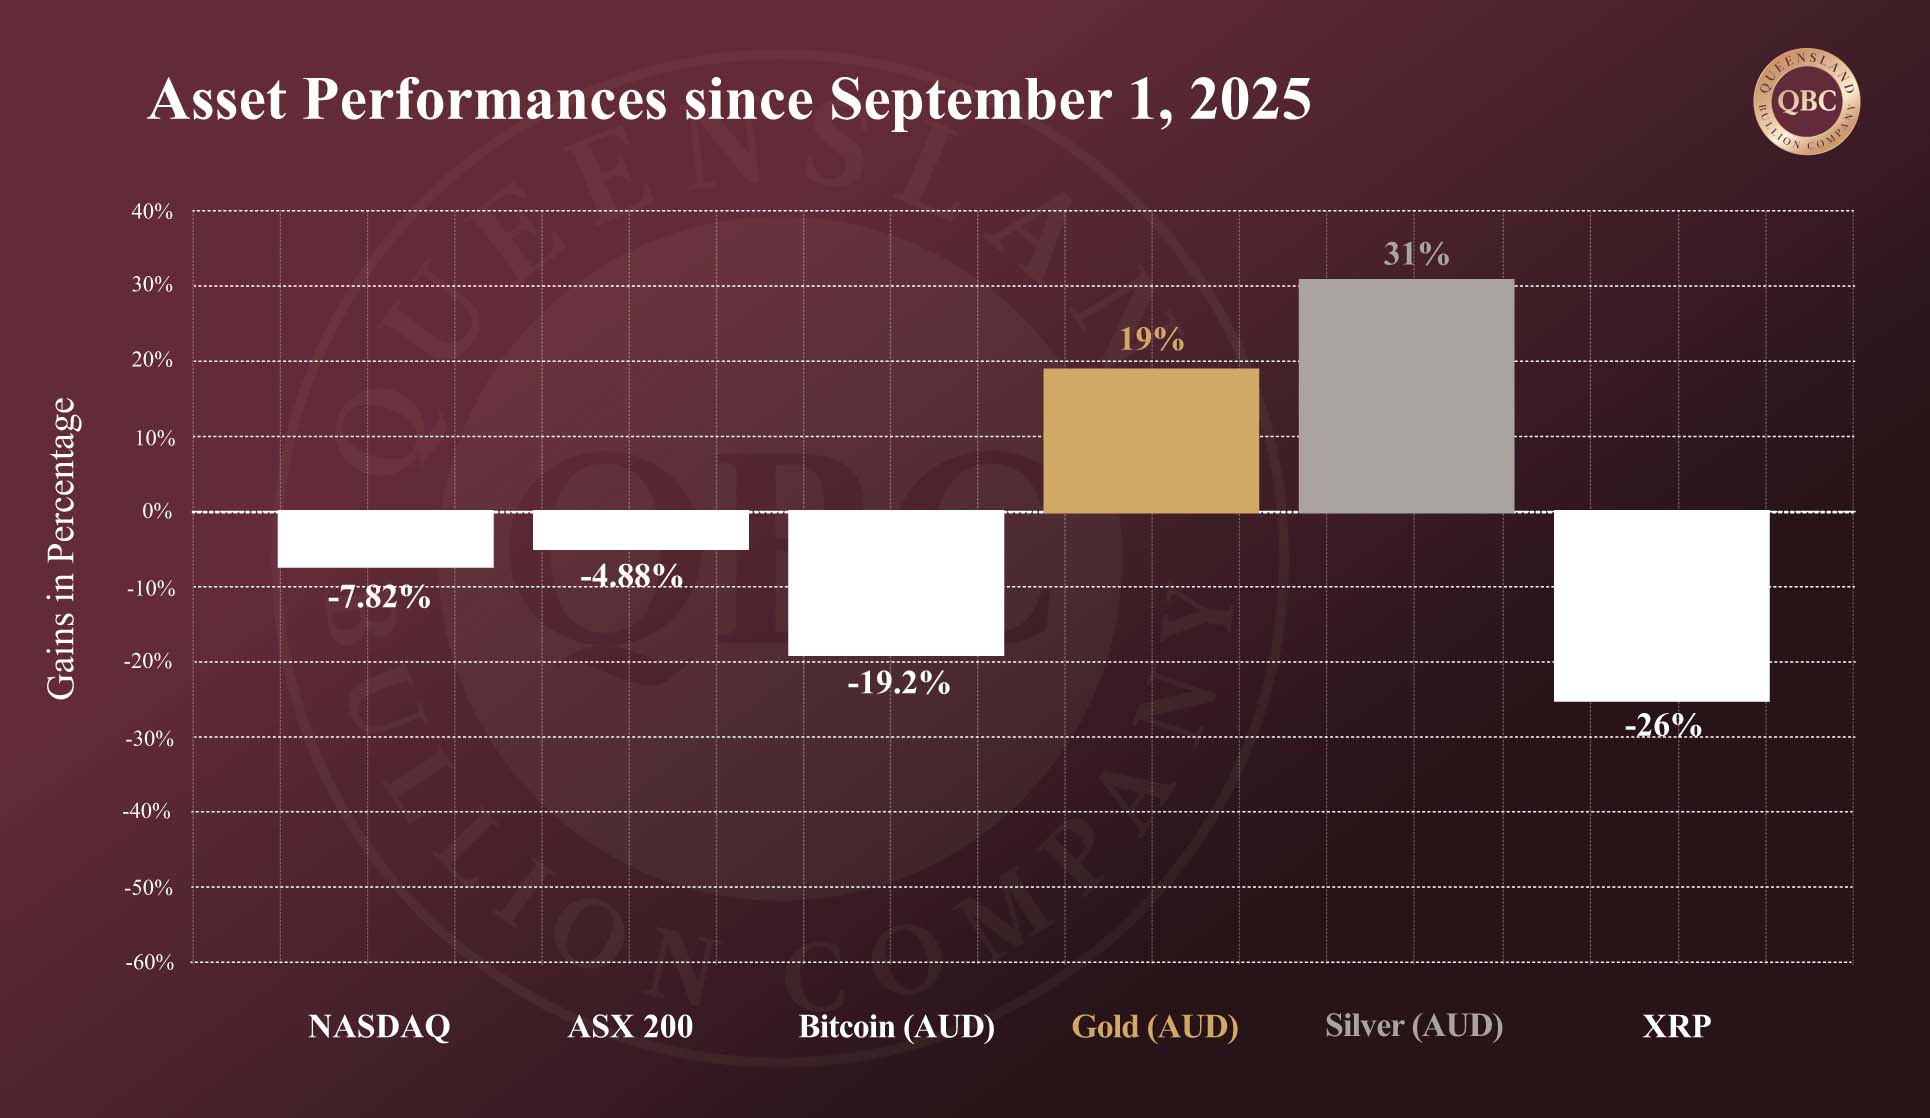
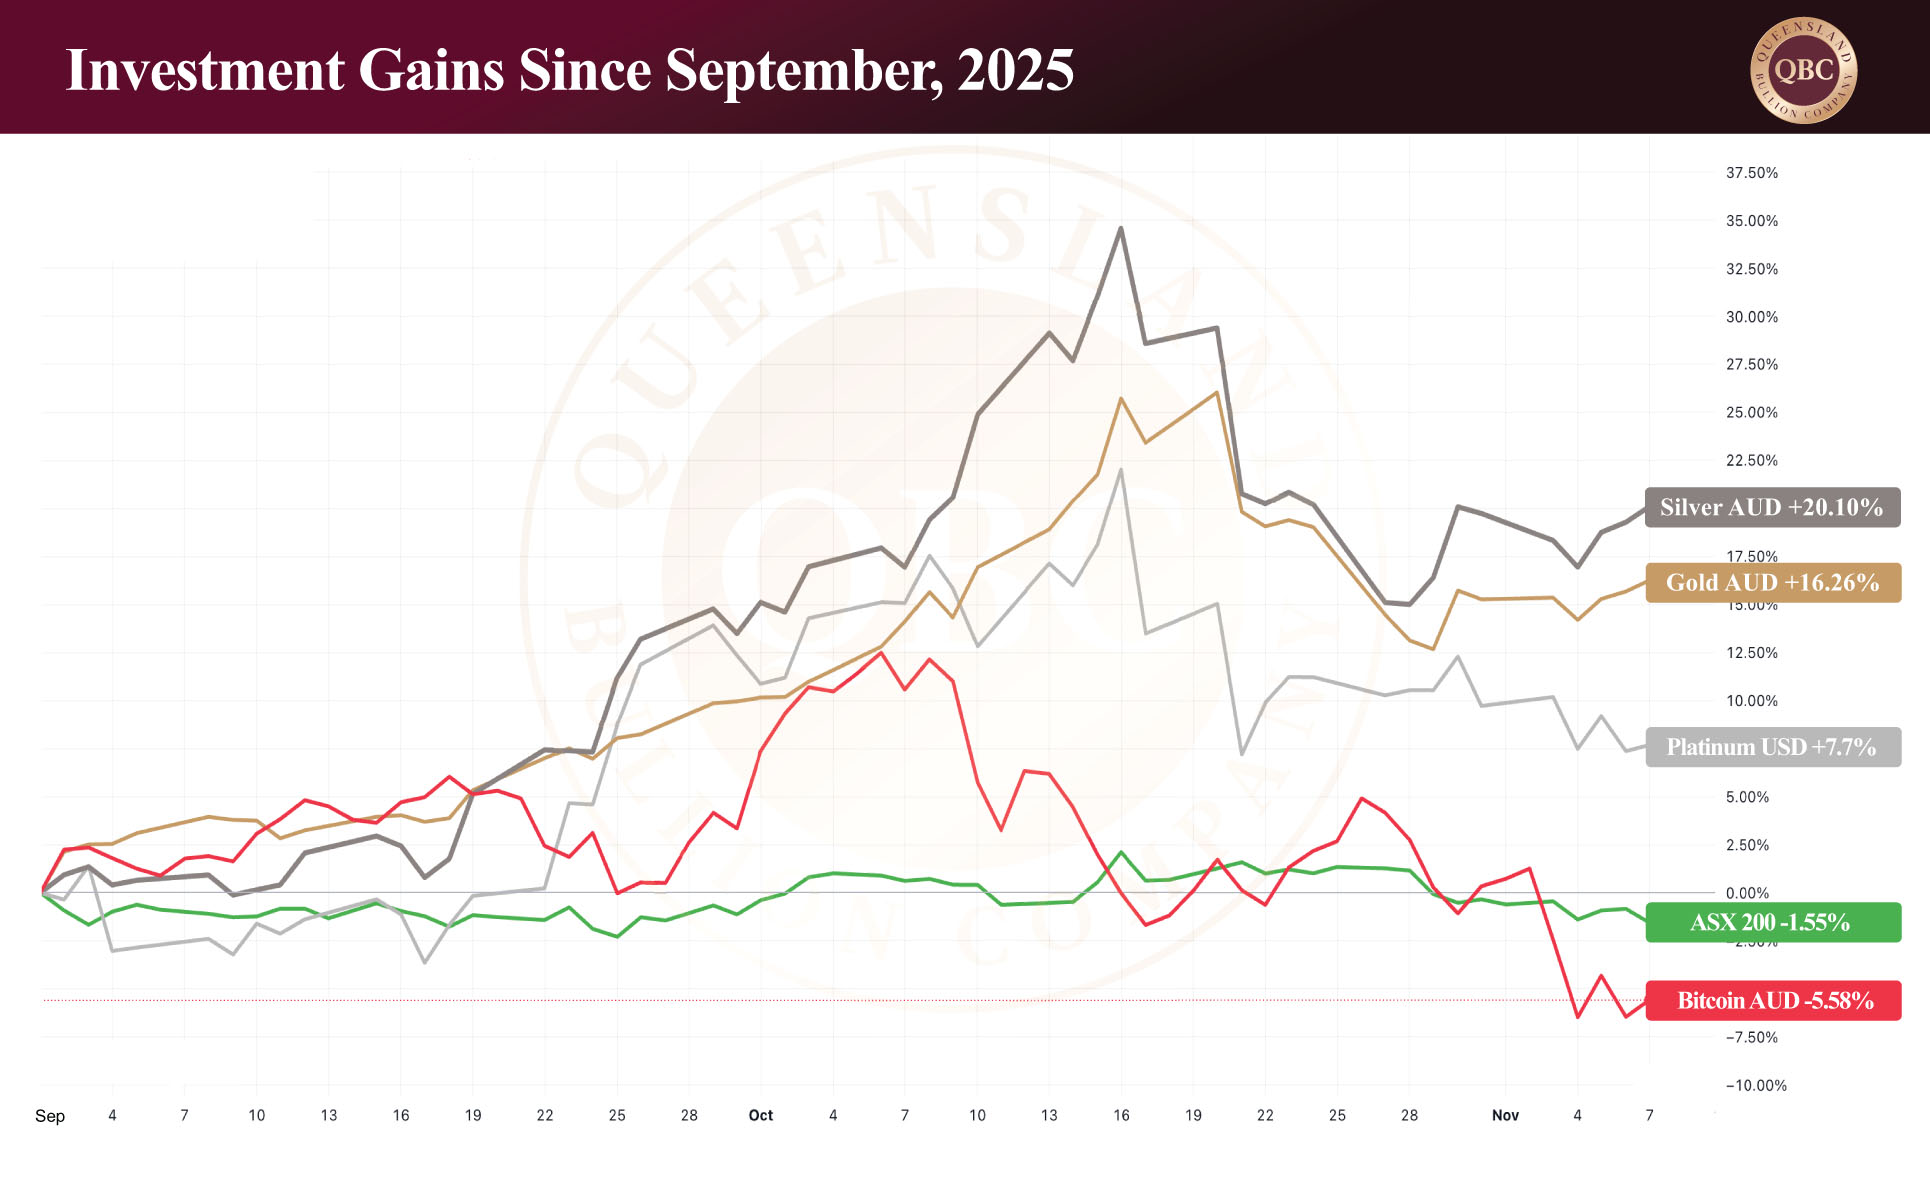
Since the September 2025 bull run, wholesale premiums for silver have increased more than tenfold as wholesale costs balloon. Importantly, these higher premiums are largely reflected in bullion merchant sell prices, not buy-back prices, meaning investors selling silver are not typically receiving the same premium expansion.

This is a supply-chain adjustment, not opportunistic pricing.


In Summary

Two overlapping forces have shaped the current retail environment. The first is volatility, (driven largely by margin hikes and forced liquidation in leveraged futures markets) which disrupted normal trading conditions and triggered sharp price swings. The second is a structural shift in sourcing as refineries have become increasingly tied to higher Shanghai-based physical pricing, resulting in sustained increases in premiums across the supply chain.

Despite the turbulence, the broader backdrop remains intact. A five-year global supply deficit continues to weigh on the market, while new silver mines require seven to twelve years from discovery to production. At the same time, approximately 65% of silver demand is industrial, embedded in the infrastructure of modern living. The underlying market drivers have not changed. Corrections serve to reset excess, premiums reflect supply chain realities, and physical metal remains finite. For long-term investors, the message is clear: understand the mechanics, look beyond the noise, and continue accruing physical metal strategically.

Posted on

Silver’s Breakout: Unprecedented Gains, Structural Strain, and What Comes Next

Silver has entered rare territory. Its recent surge is not merely strong; it is historic. October marked only the third time in the past fifty years that silver has reached a true cyclical peak, joining the explosive rally in 1980 (thanks to the Hunt brothers) and the post Global Financial Crisis (GFC) rally in 2011. Year to date, the metal has climbed an extraordinary 107%, rising from AUD $48.17 on December 17, 2024, to a historic intraday price of AUD $100. Over the past month alone silver has gained 28.77% (or AUD $22.23), pushing the gold-to-silver ratio sharply lower and reawakening long-dormant interest in the monetary metal. At the time of writing, gold trades at AUD $6,494.82 per ounce, silver at AUD $96.31, and platinum at AUD $2,821.40. With prices pushing deeper into record territory, the natural question is: what exactly is driving this spike, and what does it signal for silver in the months ahead?

This brings us to the core forces underpinning silver’s extraordinary performance, forces that extend well beyond short-term speculation and point toward deeper structural shifts now shaping global precious metals markets.


Why silver has spiked: the forces now in play

One of the most significant catalysts behind silver’s recent ascent is the growing tension between paper claims and physical availability. After five consecutive years of global supply deficits, investors in derivative markets are increasingly demanding physical settlement rather than rolling their contracts through for another term. Each contract on COMEX is typically based on 5,000 troy ounces. Yet industry estimates suggest that more than 300 paper claims may sit atop each of these original contracts. What this means is that the same ounce of silver may have multiple simultaneous claims in excess of 300 times, a structure that functions only as long as most traders do not ask for delivery.

That assumption is now being tested.  Earlier this month when silver decisively broke upward, approximately 8,300 contracts (around 41 to 42 million ounces) were simultaneously open for delivery, prompting COMEX to halt operations for several hours due to what it described as a data centre outage.  Bullion banks, including JP Morgan, are reportedly struggling to meet delivery requests, and concerns are mounting about COMEX’s ability to fulfil obligations into the March 2026 delivery cycle. Current estimates place the probability of operational strain at 70 to 80%, and the risk is not abstract. If delivery requirements exceed exchange capacity, the market could face an unprecedented structural shock.

Western paper claims have ballooned in recent years with silver derivatives thought to exceed USD $21 trillion today, potentially reaching USD $26 trillion by 2030.  The paper market consists of futures, options, forwards, and OTC derivatives, a multi-trillion-dollar paper-based tower of leverage that references silver but is rarely backed by it. In contrast, China and India have quietly become the gravitational centres of the global silver market, absorbing between 10,000 and 20,000 metric tonnes of physical per year, with additional “unofficial” flows reportedly channelled into undisclosed state vaults.

Looking ahead, the March 2026 is of particular concern: more than 118,000 contracts are currently open, representing nearly 600 million ounces of silver. Even if just 10 to 20% of these stand for delivery demand would exceed the available float. With global supply deficits stretching into their fifth year the potential for a delivery crunch is significant. For silver investors, this dynamic is now moving from theoretical to structural, and the months ahead are poised to be critical.

The gold-to-silver ratio: a signal worth watching

Another major development is the compression of the gold-to-silver ratio, now sitting at 65. This figure reflects how many ounces of silver are required to equal the value of one troy ounce of gold. Since 2000, the average has hovered around 80. During the previous century it oscillated between 50 and 70.  In April 2020 it hit an all-time high of 114 at the onset of the Covid-19 Pandemic Era. More recently, earlier this year the ratio climbed to 106 before cascading downward as silver prices accelerated.

History shows that when silver outperforms gold aggressively it tends to do so for brief, explosive windows. After the 2008 GFC, when silver peaked at AUD $44.56, the ratio reached a low of 31, a moment that delivered exceptional returns for those who rotated from silver into either gold or cash. Silver advocates will be watching this ratio closely as it continues to contract, knowing that timing exits well during such periods can dramatically amplify portfolio outcomes.

The Australian Dollar: A Hidden Catalyst

While much attention is placed on the price of the metal itself, currency movements are equally important for Australian investors. The AUD has traded sideways against the Greenback since late June but has recently strengthened from USD $0.6445 on November 20 to USD $0.6616 today, representing a $2.65% increase. Remarkably, silver is achieving all-time highs in the Australian market even with a strong local currency. The AUD is now at the upper end of its current trading range. Should the currency weaken (an outcome with precedence given Australia’s sensitivity to Chinese demand cycles) silver and gold AUD prices in would almost certainly rise from already elevated levels.

In summary

Silver has delivered one of the most remarkable years in its modern history. Its 107% twelve-month gain, its strong monthly performances, and the structural pressures building beneath the global derivatives market all point toward a metal in transition from undervalued secondary asset to a primary driver of safe-haven demand. The gold-to-silver ratio is tightening, the Australian dollar is providing additional leverage, and concerns over the resilience of Western precious metals exchanges are attracting unprecedented investor scrutiny.

For those already positioned in silver, the task now is vigilance. For those yet to secure exposure, the question is not whether silver is volatile (it always has been) but whether the structural forces now at play justify a strategic allocation despite the volatility. All evidence suggests that the conditions forming today could define the next major chapter in silver’s long and cyclical history.

If silver has indeed begun its next major secular move, preparation will matter more than timing. And right now, the opportunity sits squarely in front of us. If you are considering buying silver online, then visit this page for the latest pricing and sizing options.

Posted on

Tracking the Shift: Precious Metals vs Tech, Crypto and Equities

Markets have entered a decisive phase as investors reassess where capital is safest, and where it can still grow. Two months of heightened volatility have sharpened the contrast between risk-on and risk-off assets revealing clear winners as global uncertainty persists.  Last week we examined the theme of asset class rotation and how capital moves between risk-on and risk-off sectors as conditions evolve. Building on that discussion, today we compare how gold and silver are performing against major indexes and cryptocurrencies since early September and year to date. At the time of writing, gold trades at AUD $6,416 per ounce, and you can buy silver bars at AUD $79.89, and platinum at AUD $2,426. With these spot figures in mind, let’s explore how the rotation is playing out across markets.


Influencing Factors

One of the most interesting developments is gold’s resilience is the recent rebound in expectations for a rate cut. After the release of the U.S. Federal Reserve minutes from its November meeting, markets were reminded that rate policy is far from settled. While some Fed participants favour cuts if the economy progresses as expected, many others suggest holding rates steady for now. Chair Jerome Powell reinforced this when he stated that a December rate cut was not a “foregone conclusion.” However, since then there have been dovish comments from key officials.  Recently, New York Fed President John Williams signalled there was “room for further adjustment,” and Fed Governor Christopher Waller deeming a December 25-basis-point cut “appropriate” due to persistent labour market weakness, downplaying the resilient September jobs data as likely to be revised lower and emphasizing employment risks over sticky inflation. The CME FedWatch probability for a December cut has surged to 85.1% as of November 25, up sharply from 42.4% a week ago and well above the post-minutes low of 33.6%. That renewed consensus and optimism means that gold’s earlier decline (triggered by an overbought market) is being reversed as the market refocuses on fundamental drivers, such as lower-for-longer rates supporting safe-haven demand, rather than immediate policy uncertainty.

That shift in sentiment is playing out across the asset spectrum. Lower rates typically move demand towards non-yielding assets like gold and silver. At the same time, the expectation of a rate cut means less new liquidity for risk-on sectors such as equities and cryptocurrencies. Because of this, capital is tending to favour safe havens assets.


What This Means in Practice

When interest rates are cut, the opportunity cost of holding gold and silver falls which makes them more attractive. Currently, with the probability of a cut reduced, precious metals are holding their ground rather well. Simultaneously, with fewer rate cuts expected, less new money is flowing into equities and crypto. This dynamic is visible in the performance numbers as at last Friday: the Nasdaq Composite started September at 23,951 and now sits at 22,078, down 7.82 %. The ASX 200 began the month at 8,865 and is now 8,432, down 4.88%. Meanwhile, Bitcoin fell from AUD $165,865 to AUD $134,003, a colossal 19.2 % drop. In contrast, gold climbed from AUD $5,306 to AUD $6,315 (+19%), and silver from AUD $59.76 to AUD $78.55 (+31%).


Performance Year to Date

When we look at the full year, the contrast is even sharper. The Nasdaq began the year at 19,309, representing a 14.34 % gain to date. The ASX 200 opened at 8,215, up 2.64 %. Bitcoin began 2025 at AUD $147,610, incurring a loss of 9.22 %. By comparison, gold moved from AUD $4,241 to AUD $6,315, a 48.9 % increase. And silver posted an even stronger result, climbing from AUD $46.68 to AUD $78.55, a 68.27 % rise.


In summary

In a world of fluctuating confidence and shifting capital, the differences between asset classes have never been clearer. Equities and cryptocurrencies remain exposed to growth expectations and liquidity cycles, while gold and silver continue to demonstrate their worth during times of uncertainty. For investors focused on both wealth preservation and strategic growth, precious metals remain the go-to asset class. While no asset rises in a straight line, the relative strength of gold and silver suggests that their secular bull markets are still in the early innings, and that now may be a smart time to strengthen your position.

Posted on

Gold’s 5,000-Year Record: Lessons from History and the Road Ahead

For more than five millennia, gold has held its place as the ultimate store of wealth, a universal standard that transcends currencies, governments, and even civilisations. Its longevity is what makes it unique. Gold’s history provides the rare ability to analyse long-term trends and cycles that stretch across generations. The same cannot be said for newer markets (such as cryptocurrencies and specific equities), which have yet to prove themselves through repeated cycles of crisis and recovery. Today, gold continues to perform its ancient role with renewed relevance. At the time of writing, gold trades at AUD $6,242, silver at AUD $77.57, and platinum at AUD $2,387. Each metal has seen strong gains since early September and recent corrections appear to be part of a broader upward trajectory, the hallmark of a healthy, long-term bull market. Understanding gold’s long-term patterns allows one to place current price movements in their proper historical context and make better-informed investment decisions.


Historical secular bull markets in gold

A secular market describes a long-term trend driven by structural economic and geopolitical forces, often lasting years or decades. A secular bull market can include short-term pullbacks, yet the underlying trend remains upward. These corrections are essential for sustaining long-term growth by cooling off overbought conditions and setting the stage for renewed advances. The recent two-week correction in both gold and silver serves this purpose precisely, providing the market with the necessary pause before the next leg higher.

To appreciate the current moment it helps to look back. During the secular bull market of the 1970s, gold rose an astonishing 2,400% over nine and a half years, fueled by inflation, oil shocks, and the collapse of the Bretton Woods monetary system. The next secular bull market began in 2000 with the Dot Com bubble and consequent crash reaching record highs after the Global Financial Crisis, as gold gained 630% over ten years. By comparison, the current bull market, which began in late 2022, is up just 147%, still early in its cycle by historical standards. If history is any guide, this suggests there is considerable room for growth ahead.

Bear market or correction?

We have fielded the same question from many clients regarding the most recent pullback: are we witnessing a new bear market, or simply another correction within a broader bull run? The evidence strongly supports the latter. Gold’s recent 12% pullback (from its all-time high of AUD $6,758 to AUD $5,953 at the end of October) aligns closely with past corrections seen during earlier bull cycles. Even if gold had hypothetically fallen as low as AUD $5,676, representing a 16% decline, it would have still been consistent with historical norms. In each of gold’s previous secular bull markets, such retracements were followed by strong recoveries and new highs.

The below table shows multiple pullbacks in the U.S. gold market during the 2001 bull run.

Gold is now in the midst of its third major secular bull run since 1971, the year the U.S. abandoned the gold standard. Like the cycles of the 1970s and 2000s, this one is being shaped by a potent combination of government debt, inflation, geopolitical tension, and a weakening U.S. dollar. Gold has already broken decisively out of its short-term downtrend, confirming that the broader bull market remains intact — and, most importantly, that it still has many years left to run.


Gold versus the NASDAQ: shifting capital between asset classes

Markets move in cycles, and investors constantly rotate between asset classes in search of value. The relationship between gold and equities (particularly the NASDAQ, or technology stocks) illustrates this clearly. Generally investors shift between asset classes in response to the market and associated factors according to their risk tolerance.  For instance, when technology stocks surge, gold often lags, and when confidence in risk-on assets fades, gold typically leads. This inverse relationship has played out repeatedly over the past two decades.

After the dotcom crash in 2000, the NASDAQ lost nearly 80% of its value, while gold began a multi-year rally as investors sought safety in hard assets. From 2016 to 2024, both gold and the NASDAQ rose together — the former driven by inflation, central bank buying, and geopolitical tension; the latter by technological breakthroughs in cloud computing and artificial intelligence. Yet such dual rallies rarely last indefinitely; however, tech valuations have left gold behind and once again stretched to extreme levels. For equities in general, the Buffett Indicator (the ratio of total U.S. stock market capitalisation to GDP) is now sitting around 213%, far above the historical norm of 75%–90%. For comparison, the indicator peaked at just 140% during the 2000 dotcom bubble and 202% in 2021 after the COVID stimulus surge. The U.S. stock market is now more overvalued than at any time in the last 45 years.

Gold and the NASDAQ belong to very different classes. Gold is recognised by the International Monetary Fund as a risk-free asset for central banks, while equities, particularly technology stocks, are inherently risk-on. When capital shifts from one to the other, it often marks the turning point of a cycle. If history is any guide, we may now be entering a period where investors rotate out of overvalued equities and back into gold, a pattern that has accompanied every major correction since the 1970s.

Conclusion: Positioning for the Next Phase

History rewards investors who understand where they are positioned within a market cycle. The most successful are those who exit overvalued assets near their peak and enter undervalued ones near their base. Today, equities and particularly U.S. technology stocks show signs of being at the top, while gold is still early in what appears to be a long secular bull run.

The underlying forces driving this trend, record debt, political instability, persistent inflation, and global uncertainty, are not temporary. They are structural. Gold’s 5,000-year record as a store of wealth continues to reaffirm its role as the foundation of financial security when other markets reach speculative extremes. For investors, the message is clear: focus on value, not noise. Short-term corrections are simply pauses within a much larger movement. In a world that continues to test economic resilience and political credibility, gold remains what it has always been, the ultimate hedge, the ultimate constant, and the ultimate measure of lasting wealth.

We make it a simple process for our valued clients to buy gold online. Click here to see availability and the most up to date prices.

Posted on

Silver’s Rhythm: Lessons From the Past, Signals for the Future

After one of the strongest runs in recent memory, silver has entered a period of consolidation. The recent pullback, while sharp, is characteristic of the metal’s historical behaviour during broader upward momentum. In markets driven by media hype and increased awareness, silver is the first to sprint — and the first to stumble — yet its long-term trajectory remains upward. As of today, gold trades at AUD $6,155, silver at AUD $74.57, and platinum at AUD $2,385.

Periods like this provide perspective. When volatility replaces steady gains, looking back becomes the most valuable tool when looking forward. History does not repeat exactly, but in the case of silver, it rhymes loudly. The story of silver’s great bull markets offers important clues about where it might be heading next. Find out how silver’s next big move to the upside is reinforced by silver’s past performance.


Historical Silver Bull Runs and Corrections

The first time silver made headlines for its parabolic rise was in the early 1980s, when the Hunt brothers and their Arab partners attempted to corner the market. The result was one of the most dramatic bull runs in commodity history. Between January 1979 and February 1980, silver climbed from USD $6.02 to USD $35.52, an extraordinary 490% gain (on $6.02) in just thirteen months. Its ascent was matched only by the speed of its fall. Within sixteen months, it had plunged to USD $5.73, erasing 83% (of $35.52) of its value.

Three decades later, history repeated with a modern twist. In the aftermath of the Global Financial Crisis (GFC), silver surged again, rising from USD $9.28 in late 2008 to USD $48.70 by mid-2011, a 425% increase. And, as in 1980, the correction that followed was brutal. By the end of 2015 silver had fallen to USD $13.80, surrendering 71% from its peak price.

The lesson is simple: silver likes to party. It runs hard and crashes hard within compact timelines. It offers greater upside than gold during bull markets and greater risk for those who overstay the celebration. Timing is everything.

How History Informs the Future 

Before drawing conclusions one crucial distinction must be made between silver’s past and its present. The 1980 rally was a manipulation story, the product of two individuals, Nelson and William Hunt, exploiting a thinner, slower and more ignorant market. Their attempt to monopolise supply succeeded briefly but collapsed under regulatory pressure and margin calls.

By contrast, the 2011 bull run was driven by market fundamentals. The internet age had democratised access to information, global participation had expanded, and silver’s value was tied to legitimate financial fear in the wake of the GFC. The market was no longer a playground for a few wealthy speculators — it was driven by core economic forces, liquidity, and sentiment.

Fast forward to today. The modern silver market is too large and interconnected for individual manipulation. It takes coordination among several major institutions to shift it materially. Even then, fundamentals remain the decisive force and they are flashing bright. Unlike in 2011, the global system is now far more fragile, with governments and central banks constrained by unsustainable debt levels, inflationary pressure, and slowing productivity. Political will to enact meaningful reform is scarce, options are narrow and time is limited.

Cracks are visible across the landscape: sovereign and private debt are ballooning, inflation remains stubborn, equity and real estate valuations are stretched, and confidence in technology-driven solutions such as AI is doing little to effectively address deeper structural problems. These vulnerabilities span both East and West. The global financial system is now so deeply interconnected that any correction in one major economy reverberates quickly, and often amplifies, around the world.


The current silver status quo

Since early September silver has risen 26%, even with the latest correction. Measured from January 2024, its price has more than doubled from AUD $34.30 to AUD $74.54, a 116% increase.  Importantly it has achieved this without a major global downturn. That alone is telling. Historically, silver rallies have been reactive — responses to crises. This time, gold and silver is leading. It is rallying ahead of the correction, not because of it.

When real estate and equities (and by association some cryptocurrencies) sit at cycle highs, capital usually flows away from safe havens. Yet today, funds are quietly returning to gold and silver. This suggests investor confidence is eroding beneath the surface even as the major indices continue to climb. In short, silver’s surge is an early signal that risk tolerance is fraying and markets are stretched to breaking point.

In Summary 

When fundamentals finally give way, the global financial system may face a shake-down of historic proportions. Technically, silver has just completed a 45-year cup-and-handle formation thus setting the stage for what could be an explosive move to the upside. If history is any guide, the next bull phase will be both swift and steep, followed inevitably by an equally fierce correction.

For investors, this phase demands vigilance and preparation. The recent pullback should not be read as a warning, but as an opportunity. It represents a healthy pause within a much larger uptrend, a moment to consolidate, accumulate, or re-enter strategically. Whether through disciplined dollar-cost averaging or careful accumulation, the window remains open for those who recognise the pattern.

Silver’s rhythm has always been cyclical: euphoric surges followed by sobering retreats. But each cycle ends higher than the last. Protection requires preparation, and today’s consolidation provides precisely that: a chance to position ahead of what could be silver’s most significant run in half a century.

if you are thinking about buying silver online, or if you are local and would like to visit us, then feel free to contact us or create an account.

Posted on

Healthy Pause: Gold and Silver Pull Back After Historic Run

After one of the strongest rallies since 1979, gold and silver are experiencing a brief but orderly correction. The pullback has taken both metals back to levels seen three weeks ago, yet prices remain well above their early September starting points. Gold is currently trading at AUD $6,107.60 per ounce, silver at AUD $74.80, and platinum at AUD $2,362.86. Even after the retracement, gold is still up over 16% since the beginning of September, an impressive gain that underscores the metal’s resilience. Technical indicators suggest that the short-term correction may be nearing its end, setting the stage for renewed strength in the months ahead.


Fundamentals remain unchanged

The key drivers supporting growth in precious metals have not changed. Geopolitically global tensions remain high. In the Middle East, conflict persists between Israel and Hamas despite President Trump’s public claim that the war is over. Russia continues its Special Military Operation in Ukraine, while trade friction between the United States and China persists under the Trump Administration’s tariff policies — tensions that are increasingly being framed as a matter of national security, particularly around critical minerals, a category that now includes silver.  The world remains as fragile (and as uncertain) as ever.

From a fiscal perspective, America’s financial position continues to deteriorate. Economic growth has slowed to 2.1%, down 1% from this time last year, while the national debt has climbed beyond USD $38 trillion. Questions around Federal Reserve leadership add further uncertainty. With Chair Jerome Powell expected to be replaced in May of 2026, speculation about his successor has intensified, and the process (led by Treasury Secretary Scott Bessent, a noted gold advocate) is already sparking debate over the Fed’s independence. Political theatre around the appointment process is likely to inject additional volatility into financial markets over the coming year.

In currency markets, the AUD/USD exchange rate continues to trace a long-term flag formation, a pattern often followed by a decisive breakout once it nears completion. We maintain the view that this breakout is more likely to occur to the downside, which would support higher local pricing for gold and silver when it eventually unfolds. Read more about our AUD outlook and its implications for gold bullion pricing here.


The Federal Reserve pauses gold and silver’s comeback

This week’s Federal Reserve meeting confirmed market expectations with a 0.25% rate cut, bringing the primary credit rate down to 4%. Members voted unanimously despite limited economic data due to delayed releases of jobs, inflation, and housing reports.  This is the first time the Fed has made decisions without a full suite of data since its inception in the 1930s.  Prior to the announcement gold began recovering from its short-term pullback, gaining nearly AUD $100 in local markets; however, following the Fed’s decision, investor sentiment shifted toward risk-on assets such as equities, trimming some of those early gains. Silver followed a similar pattern though its response was more muted. As markets digest the policy shift, attention now turns to whether gold can reassert its upward momentum once the initial volatility subsides.


Short-term pullbacks within long-term bull markets

Historically, gold bull markets rarely move in a straight line. Sharp rallies are often followed by short periods of consolidation, a natural reset that allows the market to stabilise before advancing further. A similar pattern emerged this time last year when gold moved sideways for two weeks before resuming its climb. The current retracement fits neatly within this broader pattern and can be viewed as a healthy pause rather than a reversal.  Bull markets thrive on momentum, and corrections like this one typically strengthen the next phase of the rally. Technical charts suggest that both gold and silver are near the end of this corrective cycle, with momentum indicators beginning to stabilise. Given the enduring strength of global fundamental positions the longer-term trajectory for both metals remains firmly upward.


In summary

Gold is currently trading more than 11% below its all-time intraday high of AUD $6,764, providing an attractive entry point for investors seeking to accumulate at lower levels. Silver, too, remains well positioned for renewed upside once short-term selling pressure subsides. The fundamentals that have driven both metals higher — geopolitical tension, fiscal weakness, and currency instability — are unchanged. In this context, the current correction presents not a reason for concern, but an opportunity. For investors focused on long-term wealth preservation, the window to accrue while prices are temporarily depressed may prove brief. In a world of ongoing uncertainty, gold and silver continue to stand as the most reliable forms of financial protection.