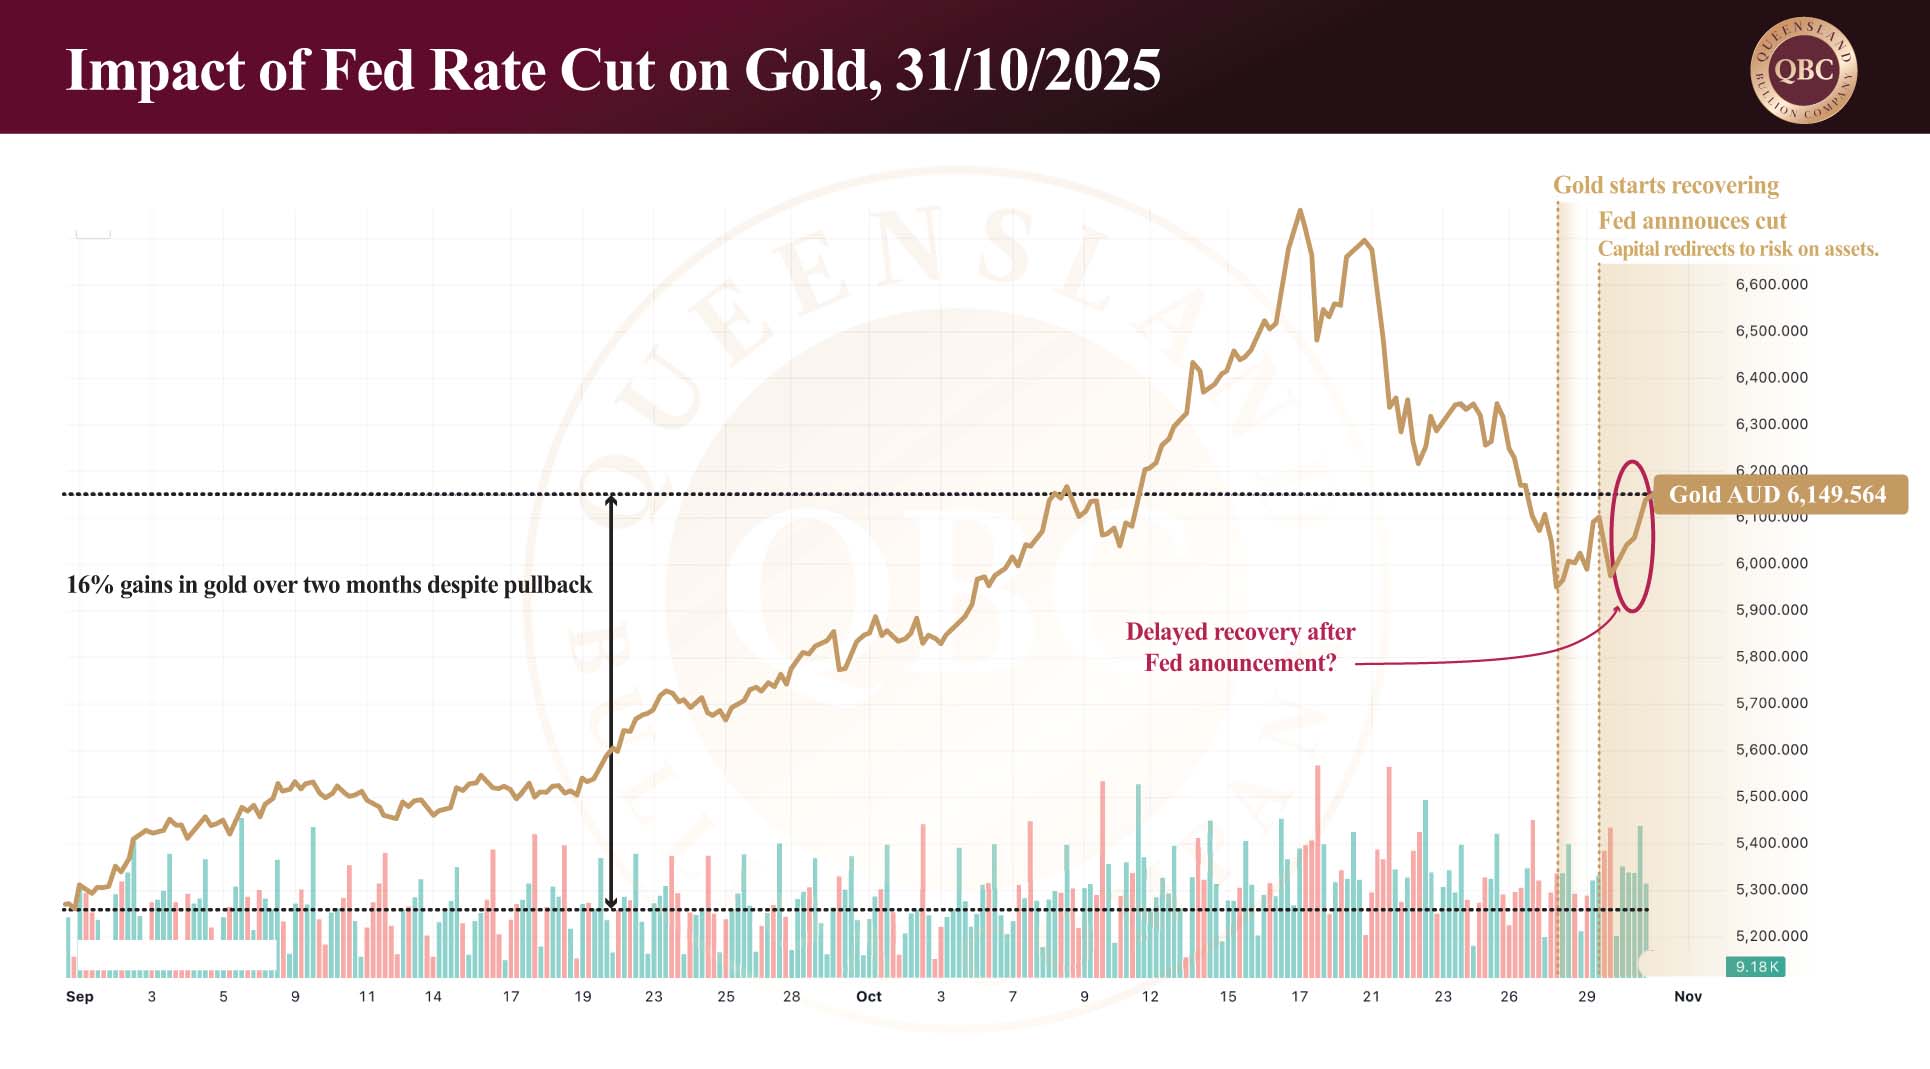
After one of the strongest runs in recent memory, silver has entered a period of consolidation. The recent pullback, while sharp, is characteristic of the metal’s historical behaviour during broader upward momentum. In markets driven by media hype and increased awareness, silver is the first to sprint — and the first to stumble — yet its long-term trajectory remains upward. As of today, gold trades at AUD $6,155, silver at AUD $74.57, and platinum at AUD $2,385.
Periods like this provide perspective. When volatility replaces steady gains, looking back becomes the most valuable tool when looking forward. History does not repeat exactly, but in the case of silver, it rhymes loudly. The story of silver’s great bull markets offers important clues about where it might be heading next. Find out how silver’s next big move to the upside is reinforced by silver’s past performance.
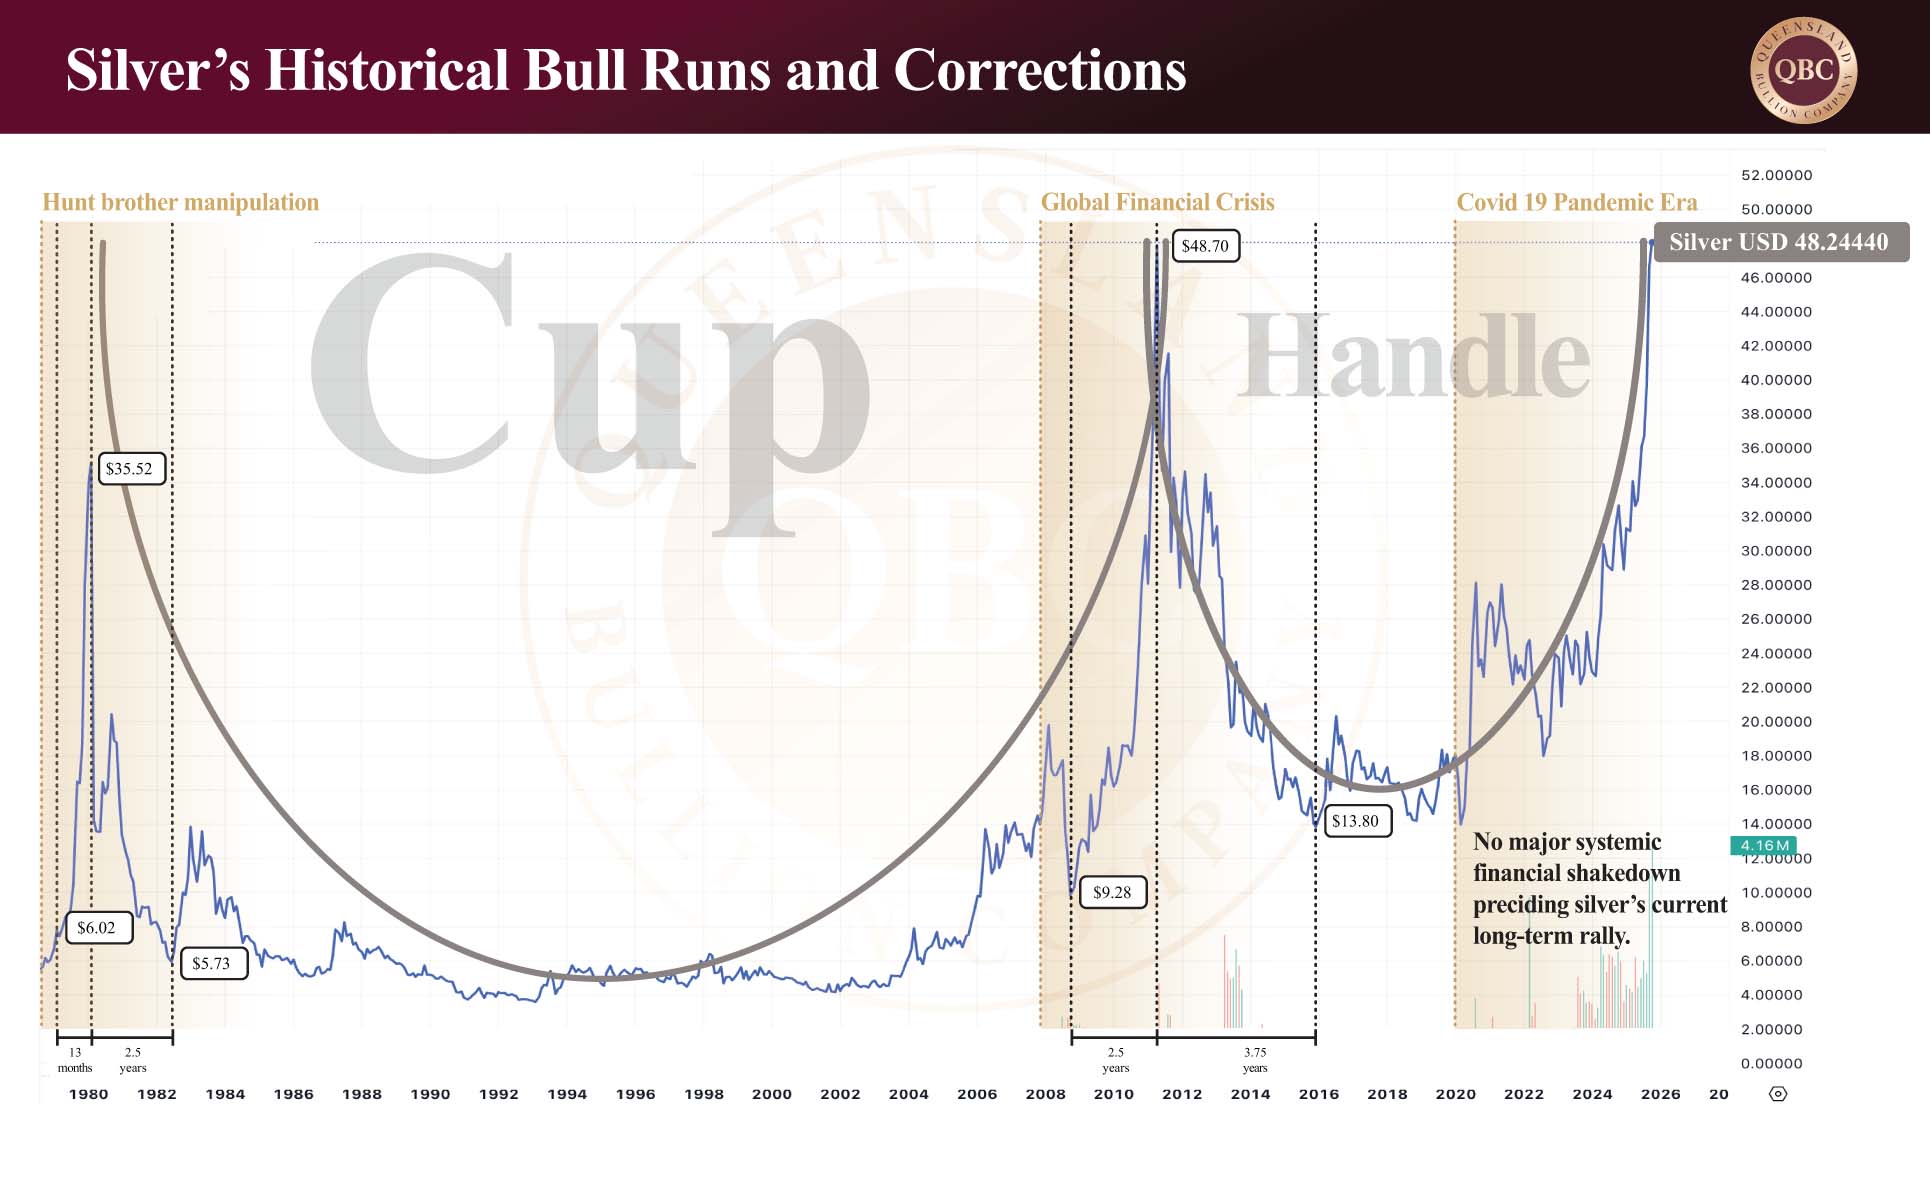
Historical Silver Bull Runs and Corrections
The first time silver made headlines for its parabolic rise was in the early 1980s, when the Hunt brothers and their Arab partners attempted to corner the market. The result was one of the most dramatic bull runs in commodity history. Between January 1979 and February 1980, silver climbed from USD $6.02 to USD $35.52, an extraordinary 490% gain (on $6.02) in just thirteen months. Its ascent was matched only by the speed of its fall. Within sixteen months, it had plunged to USD $5.73, erasing 83% (of $35.52) of its value.
Three decades later, history repeated with a modern twist. In the aftermath of the Global Financial Crisis (GFC), silver surged again, rising from USD $9.28 in late 2008 to USD $48.70 by mid-2011, a 425% increase. And, as in 1980, the correction that followed was brutal. By the end of 2015 silver had fallen to USD $13.80, surrendering 71% from its peak price.
The lesson is simple: silver likes to party. It runs hard and crashes hard within compact timelines. It offers greater upside than gold during bull markets and greater risk for those who overstay the celebration. Timing is everything.
How History Informs the Future
Before drawing conclusions one crucial distinction must be made between silver’s past and its present. The 1980 rally was a manipulation story, the product of two individuals, Nelson and William Hunt, exploiting a thinner, slower and more ignorant market. Their attempt to monopolise supply succeeded briefly but collapsed under regulatory pressure and margin calls.
By contrast, the 2011 bull run was driven by market fundamentals. The internet age had democratised access to information, global participation had expanded, and silver’s value was tied to legitimate financial fear in the wake of the GFC. The market was no longer a playground for a few wealthy speculators — it was driven by core economic forces, liquidity, and sentiment.
Fast forward to today. The modern silver market is too large and interconnected for individual manipulation. It takes coordination among several major institutions to shift it materially. Even then, fundamentals remain the decisive force and they are flashing bright. Unlike in 2011, the global system is now far more fragile, with governments and central banks constrained by unsustainable debt levels, inflationary pressure, and slowing productivity. Political will to enact meaningful reform is scarce, options are narrow and time is limited.
Cracks are visible across the landscape: sovereign and private debt are ballooning, inflation remains stubborn, equity and real estate valuations are stretched, and confidence in technology-driven solutions such as AI is doing little to effectively address deeper structural problems. These vulnerabilities span both East and West. The global financial system is now so deeply interconnected that any correction in one major economy reverberates quickly, and often amplifies, around the world.
The current silver status quo
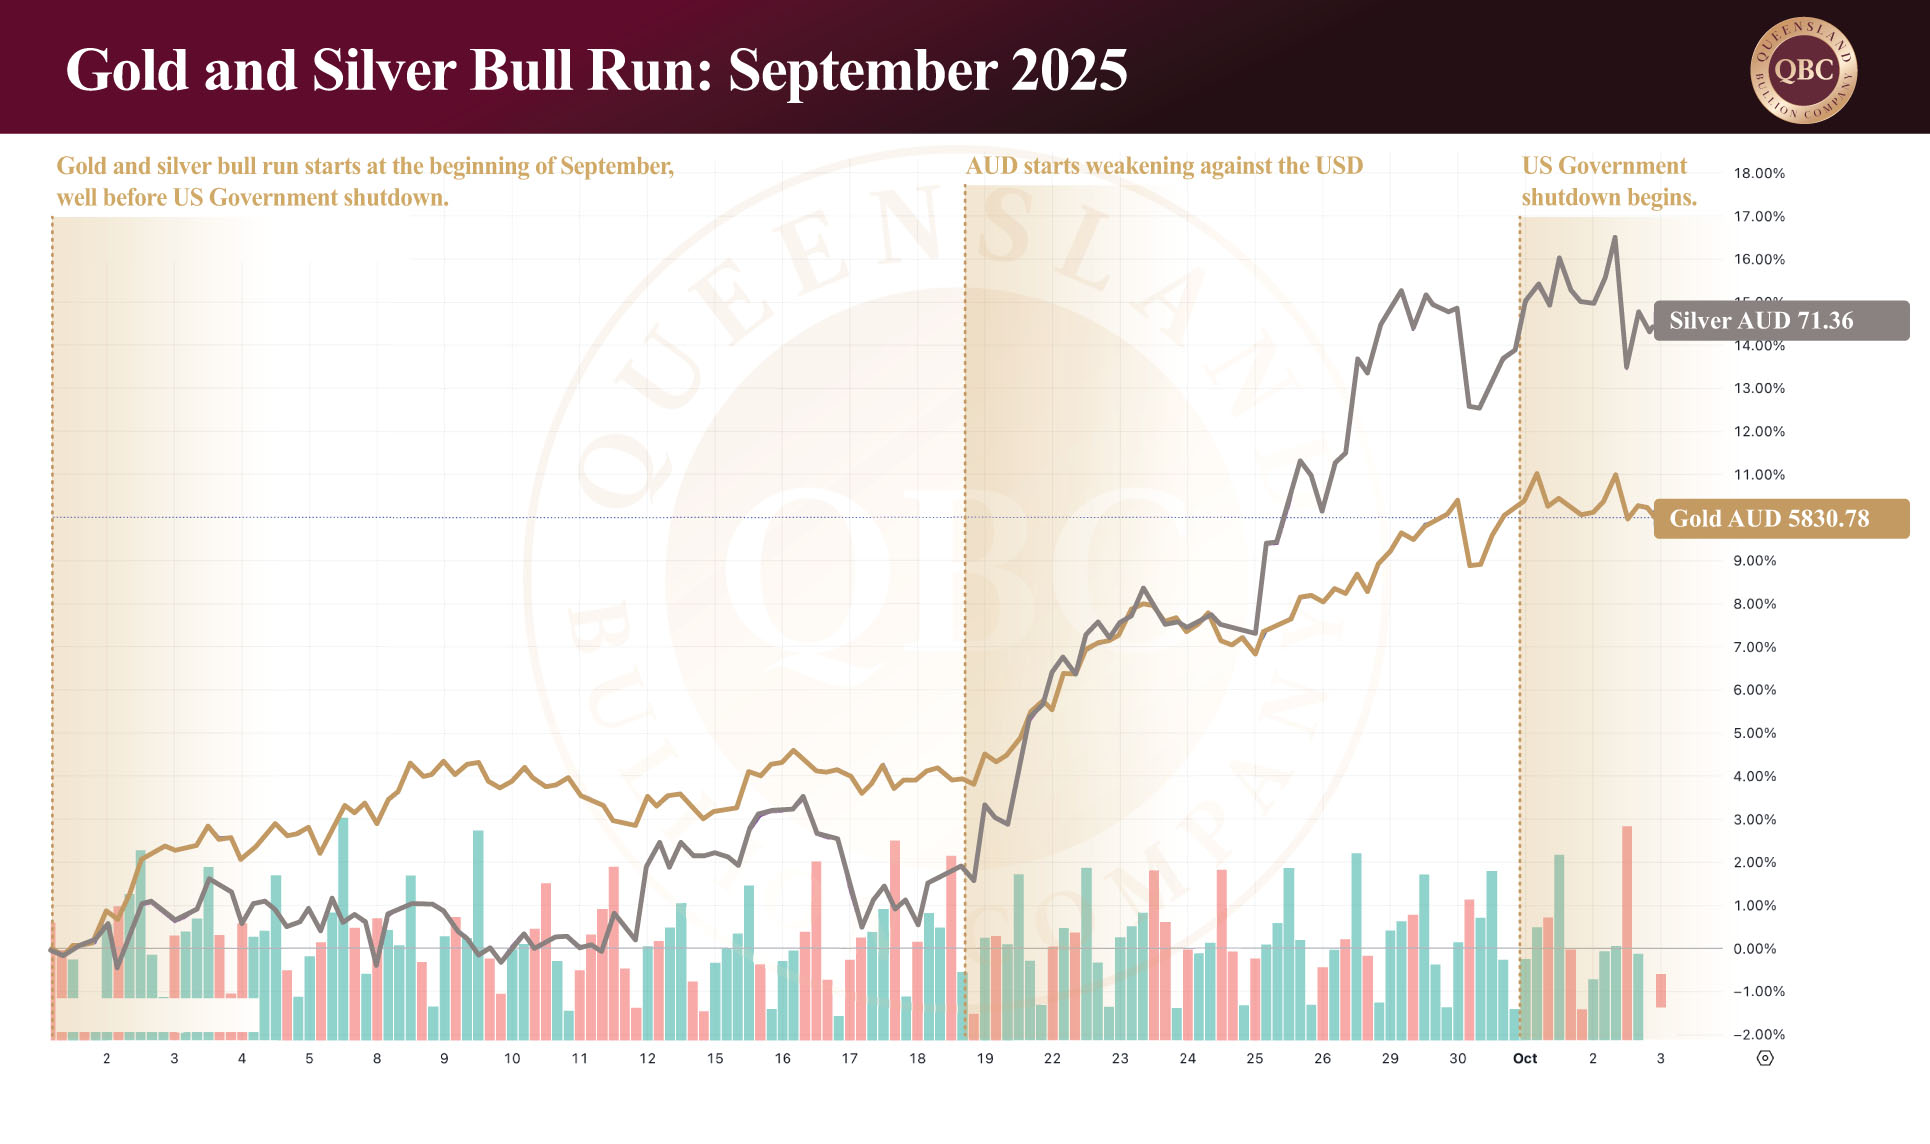
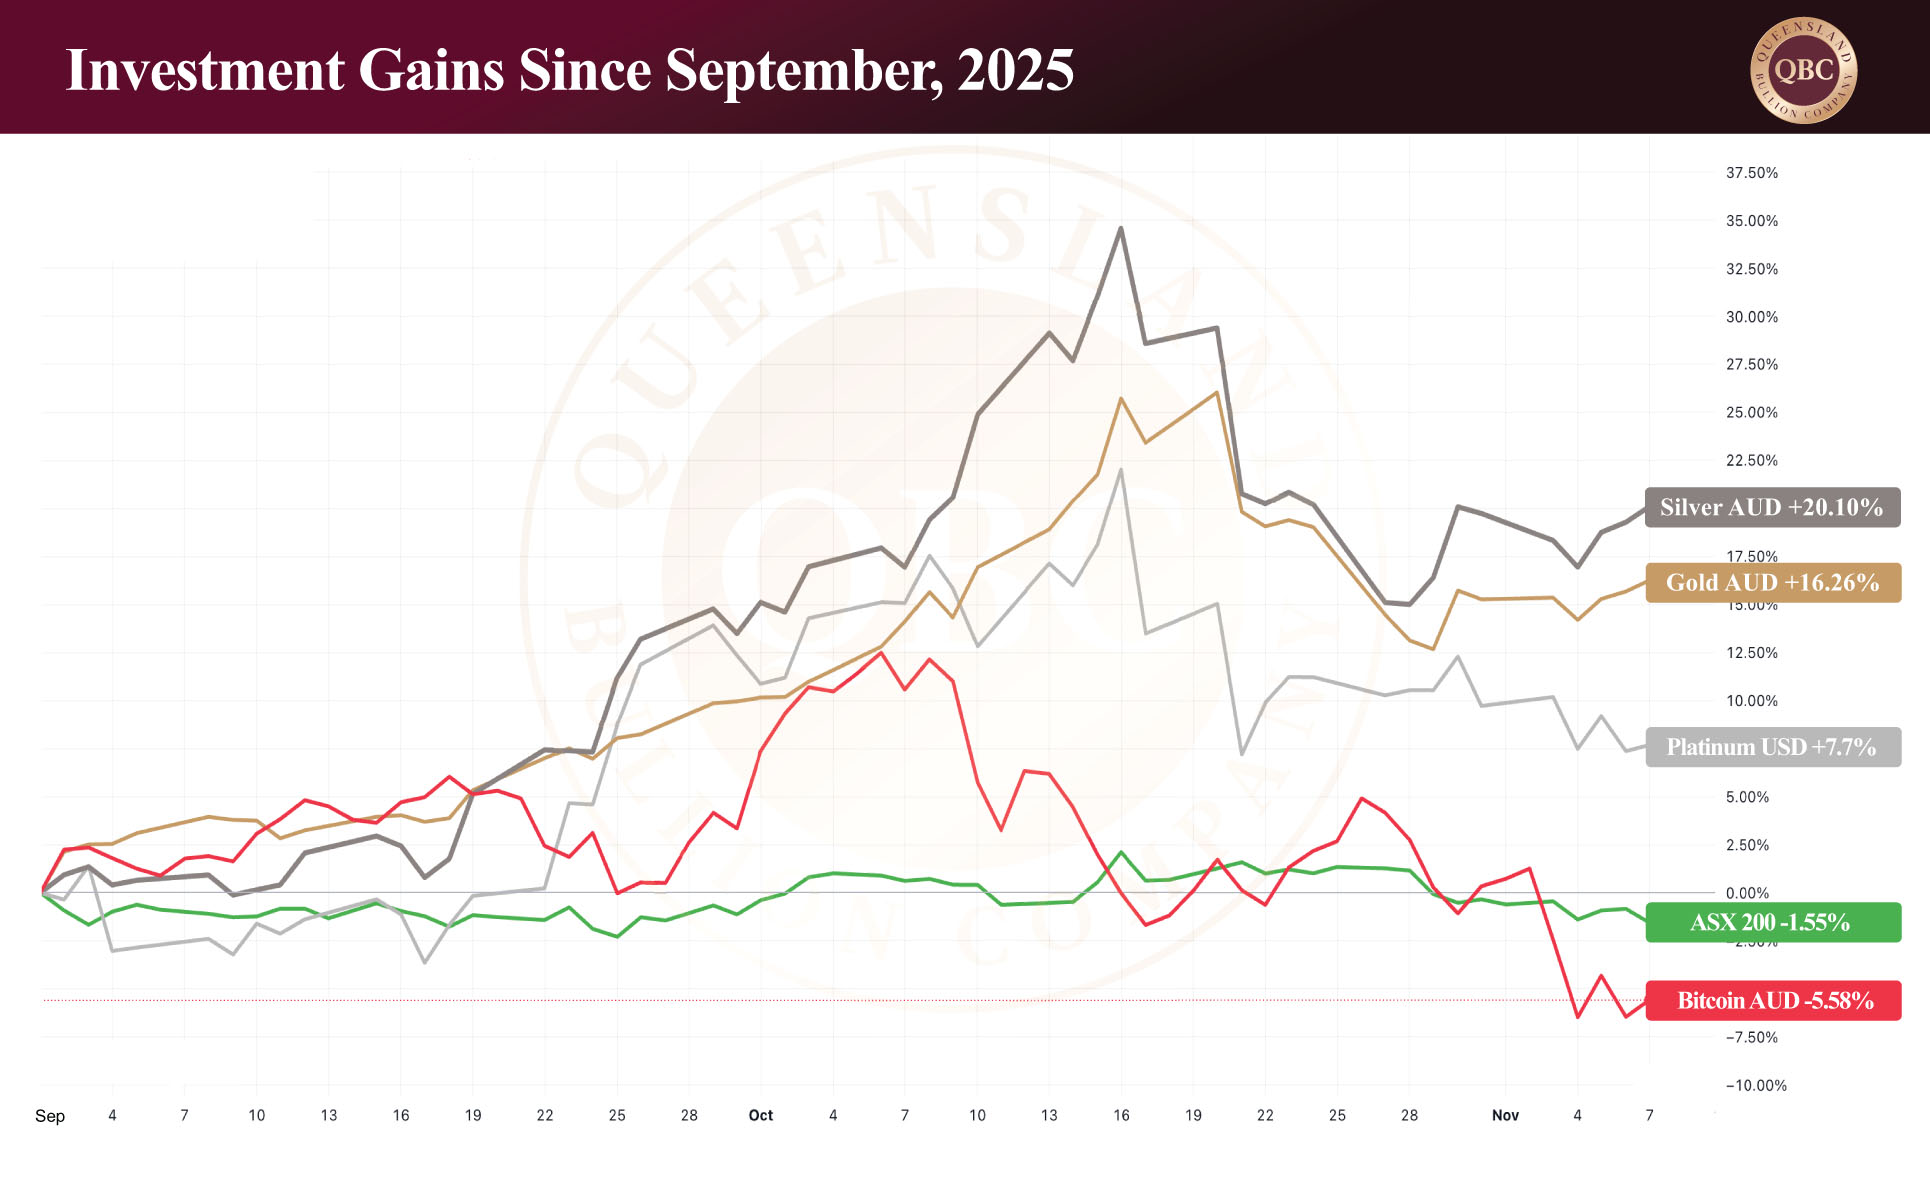
Since early September silver has risen 26%, even with the latest correction. Measured from January 2024, its price has more than doubled from AUD $34.30 to AUD $74.54, a 116% increase. Importantly it has achieved this without a major global downturn. That alone is telling. Historically, silver rallies have been reactive — responses to crises. This time, gold and silver is leading. It is rallying ahead of the correction, not because of it.
When real estate and equities (and by association some cryptocurrencies) sit at cycle highs, capital usually flows away from safe havens. Yet today, funds are quietly returning to gold and silver. This suggests investor confidence is eroding beneath the surface even as the major indices continue to climb. In short, silver’s surge is an early signal that risk tolerance is fraying and markets are stretched to breaking point.
In Summary
When fundamentals finally give way, the global financial system may face a shake-down of historic proportions. Technically, silver has just completed a 45-year cup-and-handle formation thus setting the stage for what could be an explosive move to the upside. If history is any guide, the next bull phase will be both swift and steep, followed inevitably by an equally fierce correction.
For investors, this phase demands vigilance and preparation. The recent pullback should not be read as a warning, but as an opportunity. It represents a healthy pause within a much larger uptrend, a moment to consolidate, accumulate, or re-enter strategically. Whether through disciplined dollar-cost averaging or careful accumulation, the window remains open for those who recognise the pattern.
Silver’s rhythm has always been cyclical: euphoric surges followed by sobering retreats. But each cycle ends higher than the last. Protection requires preparation, and today’s consolidation provides precisely that: a chance to position ahead of what could be silver’s most significant run in half a century.
if you are thinking about buying silver online, or if you are local and would like to visit us, then feel free to contact us or create an account.