Posted on

Gold Outpaces Property and Shares: A Long-Term View

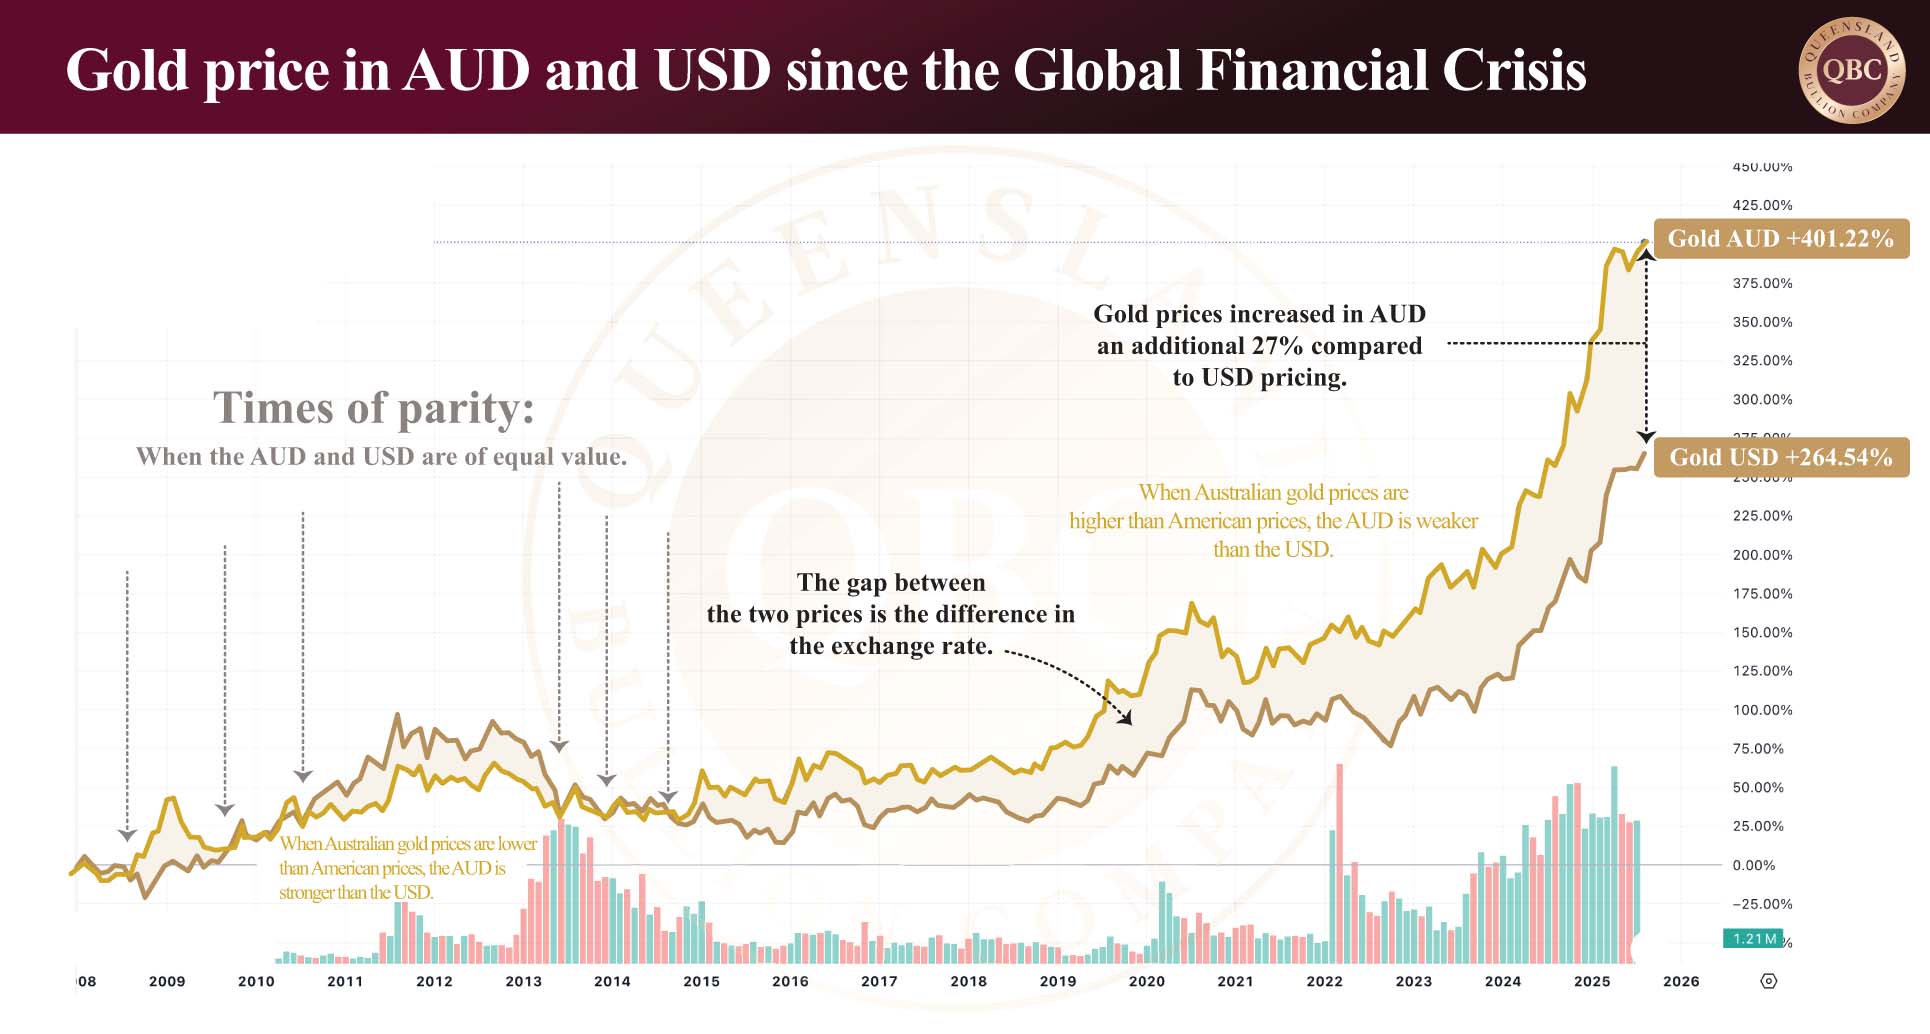
Gold and silver have set new all-time highs in 2025 for Australian markets. For local investors, the question is not whether gold has risen but how it has performed relative to other key asset classes over the last two decades. When compared with residential property and the ASX 200, the results are clear: gold has outperformed both, offering superior wealth preservation in an era of rising costs and uncertain economic growth.


A snapshot of Australia

 Australia’s economy continues to show mixed signals. Annual GDP growth sits at 1.82%, a modest pace for a developed nation. Inflation is currently 2.09% — at the lower end the Reserve Bank of Australia’s target range of 2% to 3%. Unemployment is holding at 4.19%, reflecting a long-term trend for reduced unemployment. Against this backdrop, gold is trading at $5,528 per ounce, silver at $64.26 per ounce, and platinum at $2,123 per ounce.

These figures highlight the resilience of precious metals compared to the broader economy. While economic growth is sluggish, inflation sticky, and labour markets uncertain, gold continues to provide premier net purchasing power protection despite Australia’s fiscal and financial situation.


Gold versus the Australian real estate market

From 2000 onwards, a divergence between Australian residential property prices and wages became clear. The Australian House Price Index climbed from under 40 in early 2000 to 196.15 at the start of 2025 — a 390% increase in twenty-five years. Over the same period, average adult wages rose just 40%, from $803 to $2,011 per week.  This imbalance has priced many Australians out of the property market, pushing them into long-term rental arrangements.

The 2008 Global Financial Crisis (GFC) revealed the resilience of Australian housing compared to overseas markets: while the United States saw prices collapse by 27.4% (with 50 to 60% reductions in harder hit areas), Australian residential property fell only 8.5% in eleven months. Today, however, with property prices having so far outpaced wages, the risk of a deeper correction looms.

So how has gold compared? The median Sydney property price is $1,500,543. Melbourne sits at $949,232, and Brisbane at $ 1,021,395.  In percentage terms it means that from the year 2000 Sydney prices have increased 422%, Melbourne 396%, and Brisbane 500%.  Yet gold has risen 1,046% on today’s spot price. If property prices had matched gold’s growth, Sydney’s median house price would stand at $3,002,020, Melbourne at $ 1,997,860, and Brisbane at $1,778,200.  From a household affordability perspective, it is fortunate that residential property has not risen in line with gold. Yet when viewed purely as an investment, gold has consistently outperformed.

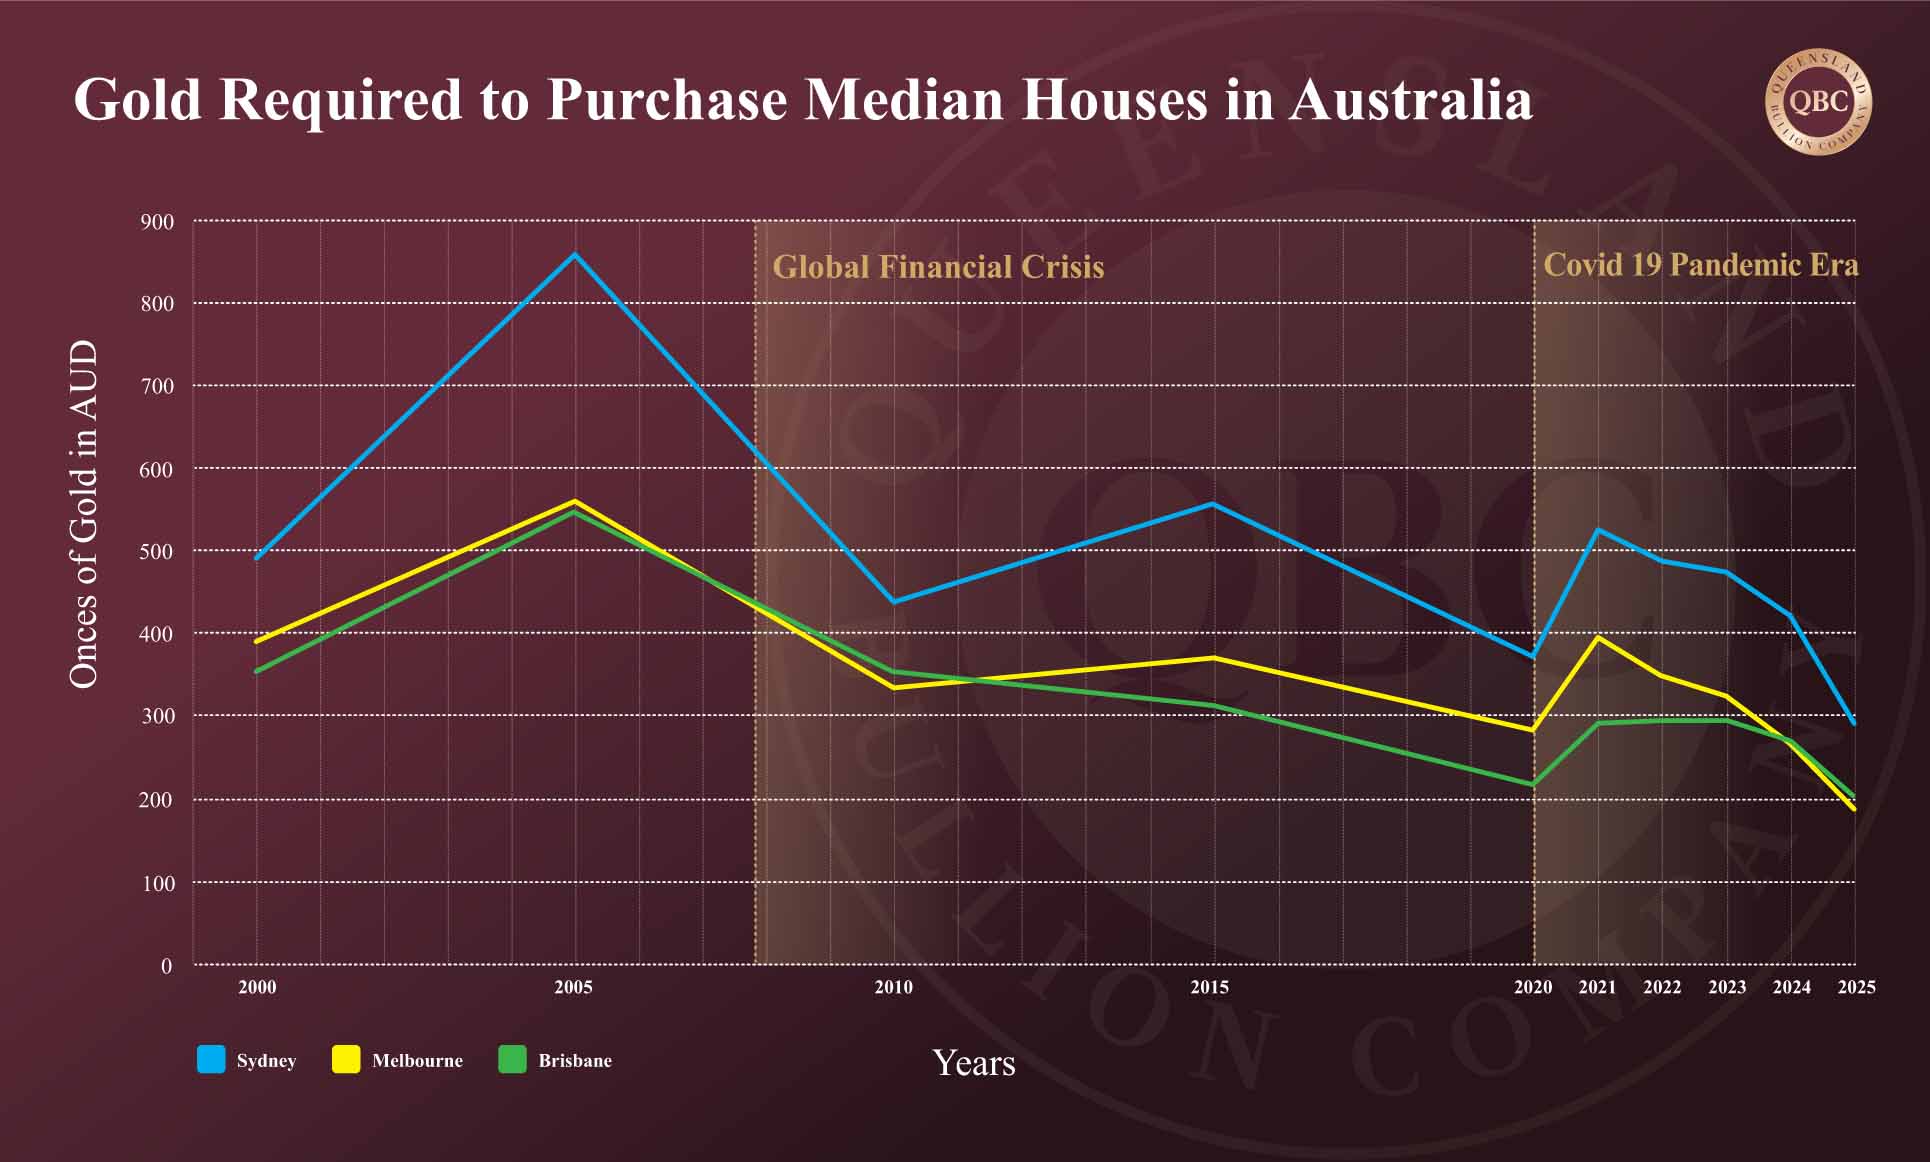
From the perspective of capital growth, 2025 Sydney and Melbourne median property are five times the value than what they were in 2000.  Brisbane median property prices are six times higher. Yet gold is more than ten times the value in the same period.  Had gold been chosen over property for investment purposes, it is possible the investor could be approximately twice as wealthy.  It should be noted that rental income and ownership costs have not been included in the above comparisons. These factors vary widely between cases, and in many instances, the expenses associated with ownership can outweigh the rental income received.

The long-term chart below shows that fewer ounces of gold are required each year to purchase a property in Australia’s major cities, despite housing prices rising exponentially relative to wages.

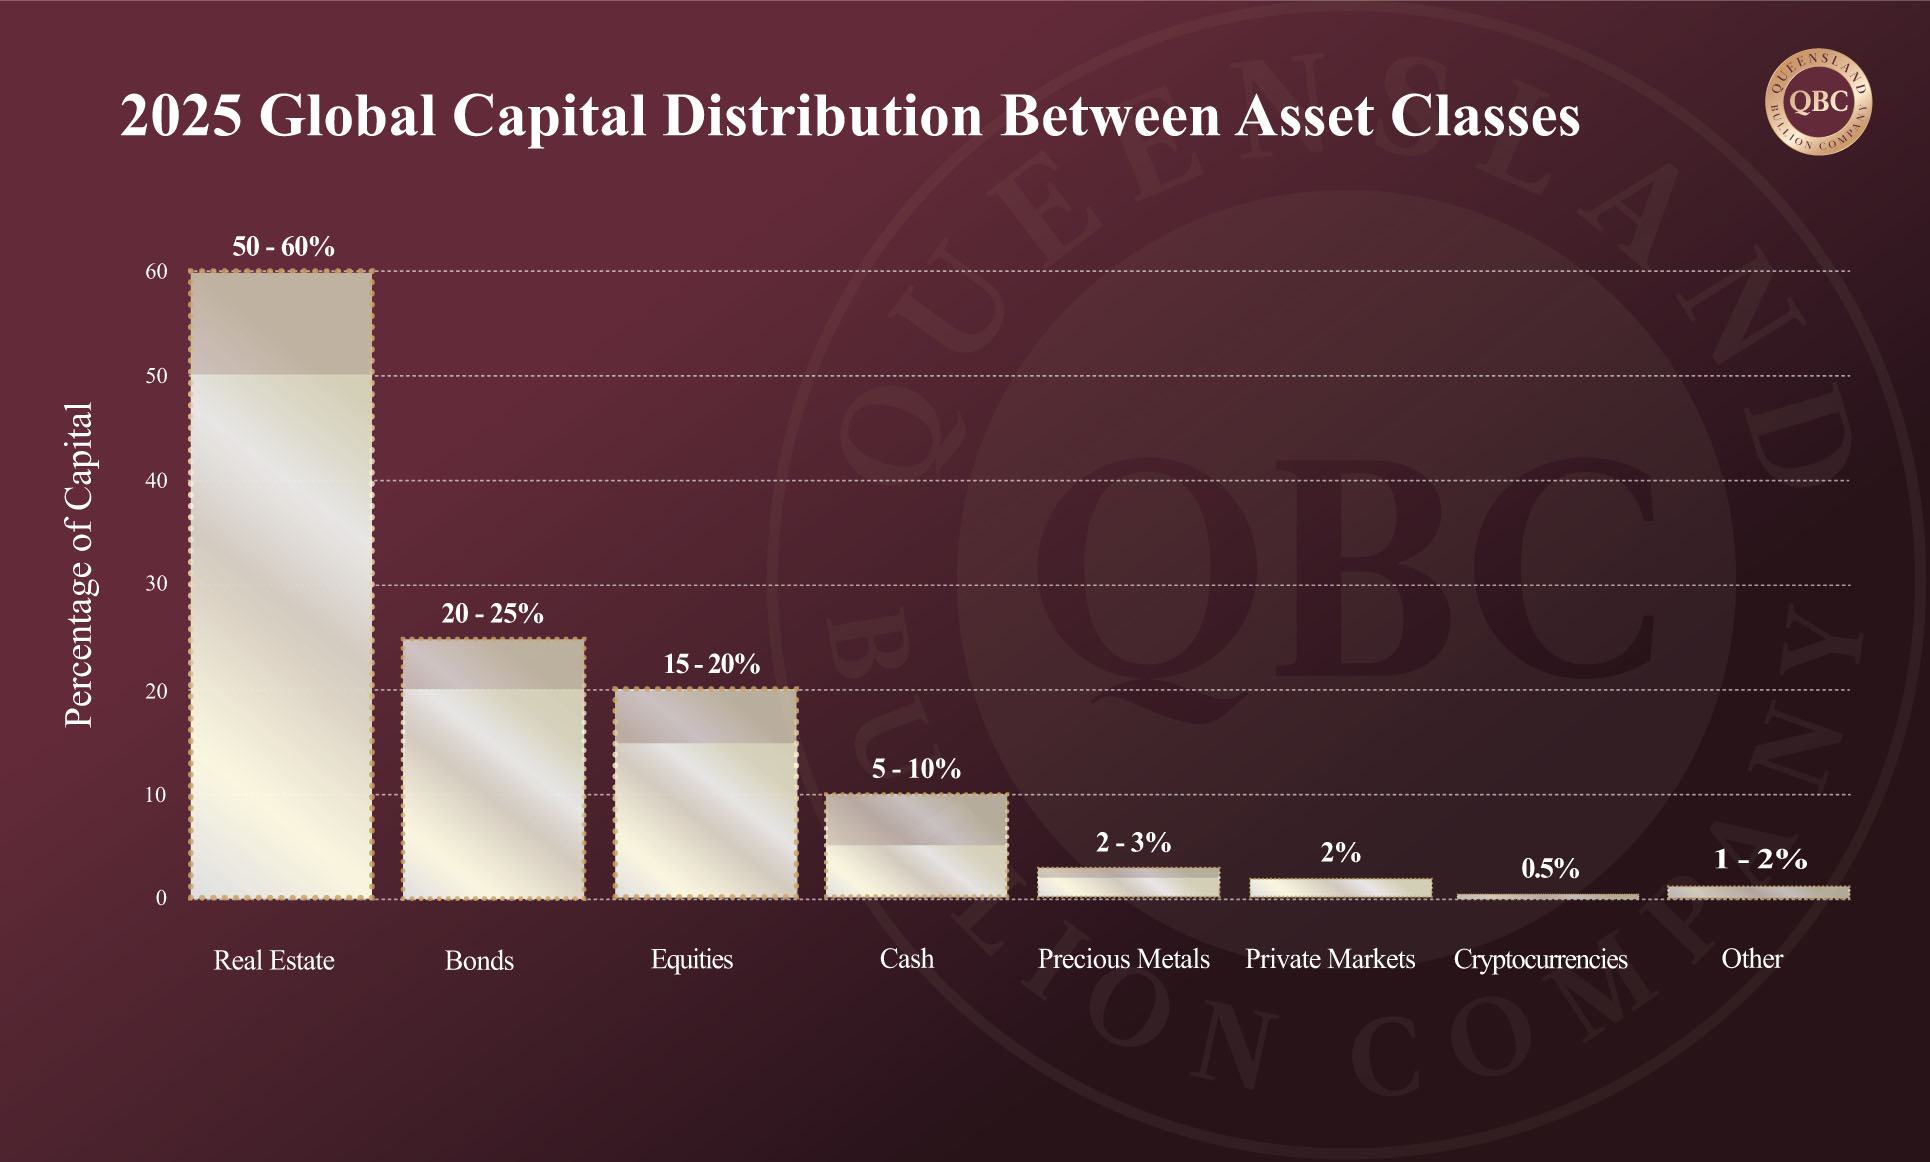
Read more about how the majority of wealth around the world is held in real estate here.


Gold Versus the ASX 200

It is a similar picture when gold is measured against equities. The ASX 200 Index, considered the benchmark for Australian shares, was launched on March 31, 2000, at 3,133 points by Standard and Poor’s (a premier credit rating company in the United States). Today it sits at 8,825 points.  The ASX 200 shows 181% increase over twenty-five years.

However, one of the fundamental differences between stocks and precious metals is that stocks can offer dividends.  For a realistic and fair comparison dividends need to be considered.  The average dividend on the ASX 200 Index between the year 2000 and 2025 is estimated at 4% per year.  If we adjust the above to include dividend payouts, the ASX 200 would be closer to 13,667 points.  This new figure shows an increase of 336%.

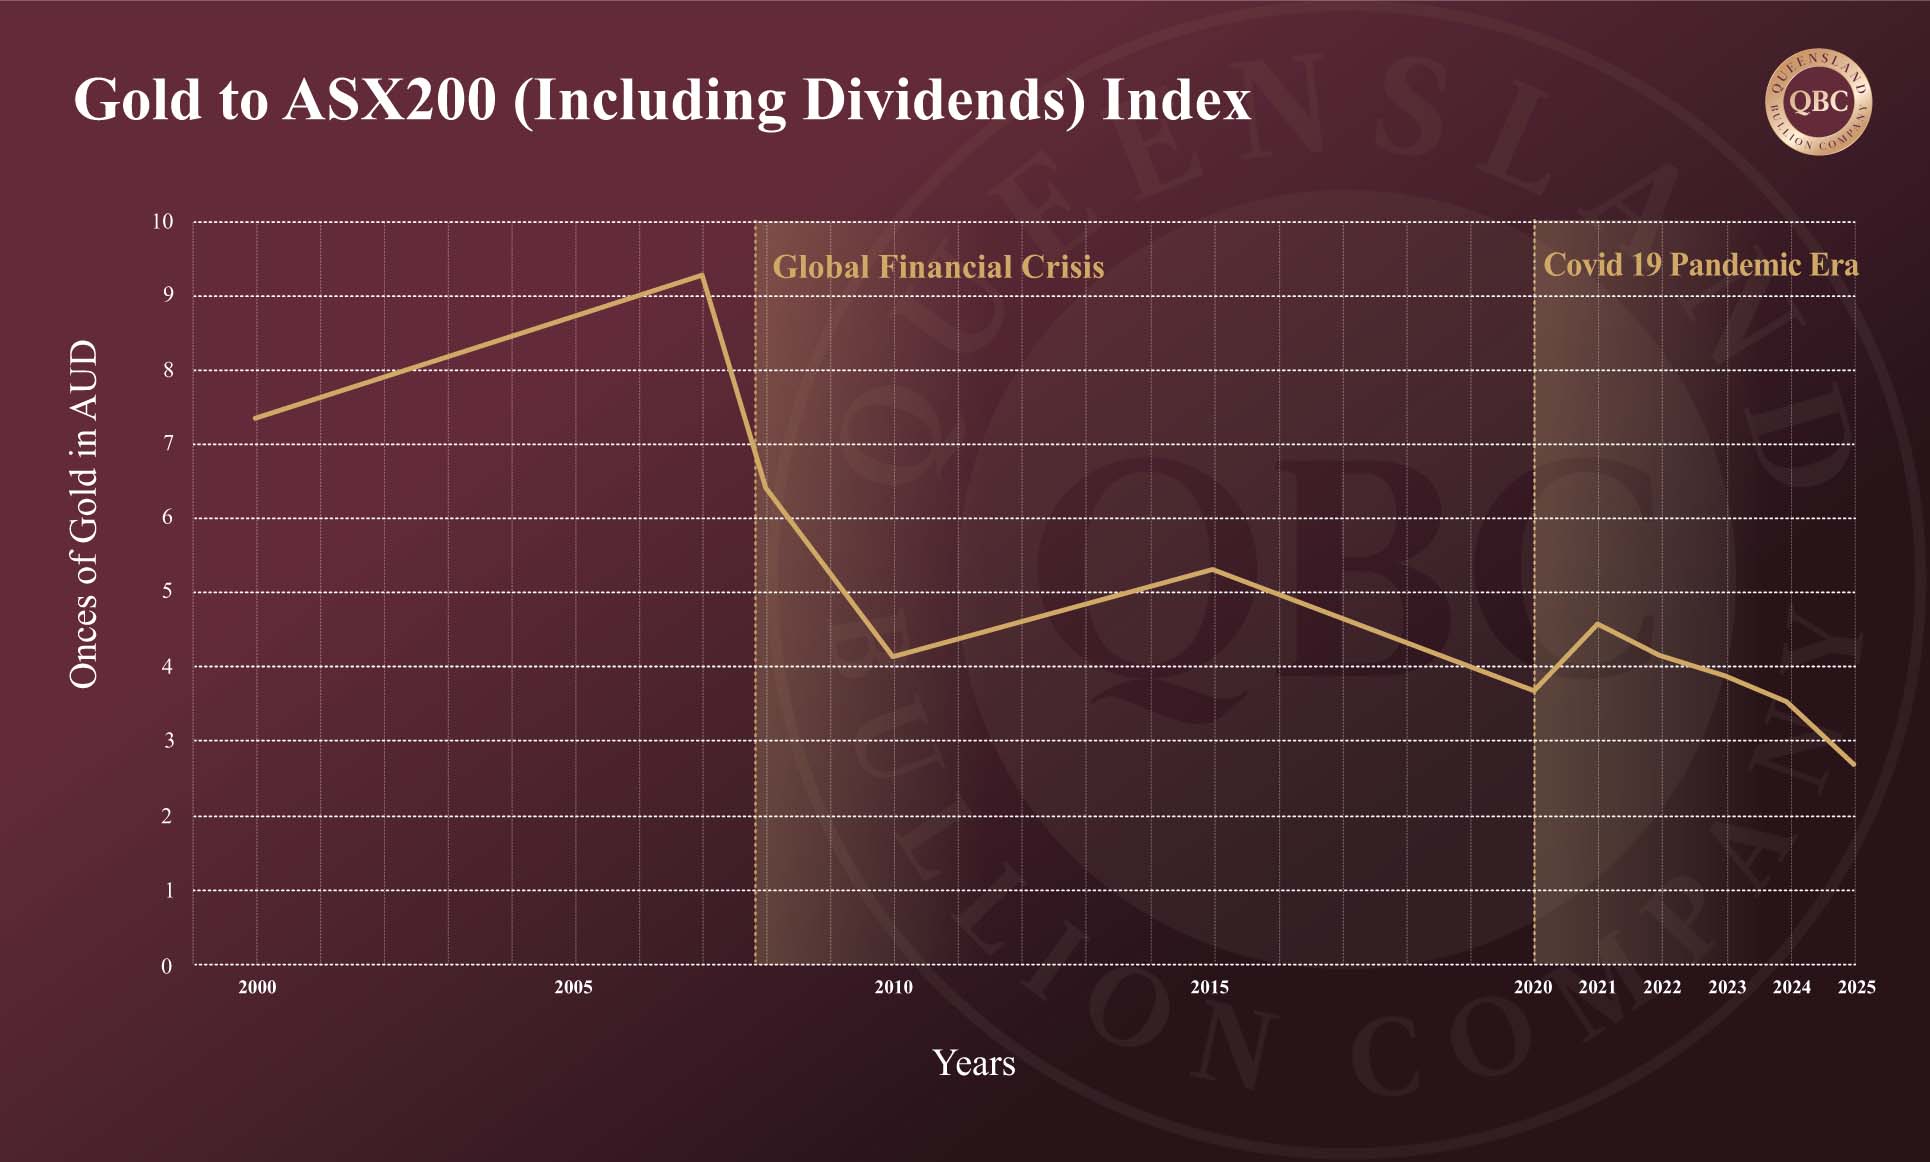
On paper, this is an impressive gain. But had the ASX matched gold’s 1,046% rise over the same period, the index would be trading at 142,956 points. In relative terms, gold has far outpaced equity markets.

The below data also shows that progressively fewer ounces of gold are required to hold the same position in the ASX 200. This demonstrates that while shares have grown in value, gold has grown faster and has done so without the volatility of equity markets or the reliance on dividend flows.


 Gold’s Enduring Advantage

The evidence is compelling. Over the past twenty-five years, gold has outperformed both residential property and equities in Australia. While the housing market has surged beyond wage growth and the ASX 200 has delivered respectable returns, neither asset class has kept pace with the relentless rise of gold.

For Australians, the lesson is clear: gold remains a cornerstone of wealth preservation. It is a hedge against inflation and an outperformer against the nation’s two most recognised asset classes. In times of uncertainty, when growth is weak and markets are stretched, gold stands out as the asset that continues to deliver.

Posted on

Is AUD $7,500 Plausible in 2026?

Gold is setting new all-time highs while silver is trading at levels not seen since 2011 and surpassing the psychologically important marker of $2000 per kilogram in Australian markets. This week’s breakout may mark the beginning of the next leg up in a broad precious metals rally. At the time of writing, gold is trading at AUD $5,434, silver at AUD $62.72, and platinum at AUD $2,127.  So what is behind the current rally and where does this place the price of gold in the next six months?  As many Western traders return from Summer holidays abroad, let us unpack five major reasons why precious metals are once again on the move.


 Expected Fed rate cut

A critical catalyst for the rally in gold prices is the market’s anticipation of a rate cut by the United States Federal Reserve on September 17, 2025. A 25-basis-point reduction is widely expected, although there is speculation the Fed could take a more aggressive step with a 50-point cut if incoming data continues to show weakness. The U.S. July jobs report revealed only 73,000 jobs created, well below expectations, with downward revisions for earlier months. Such figures underscore a softer labour market, which typically strengthens the case for rate cuts.

Lower rates support gold in two ways: they weaken the US dollar, making bullion more affordable for foreign buyers, and they reduce the opportunity cost of holding non-yielding assets. Together these factors add momentum to the current rally as capital shifts away from Treasury bonds to either higher-risk but higher-yielding equities, or safe havens such as precious metals.


Depreciation of the US dollar

Since President Trump’s return, the US dollar has depreciated by roughly 8% based on the U.S. Dollar Index. This reflects the Administration’s goal of incentivising domestic manufacturing to make it cheaper to export internationally, a mandate that President Trump campaigned on prior to his election last November. When the US dollar weakens, gold and silver often gain support as international investors see lower precious metal prices in their own currency. This depreciation has further fuelled global appetite for precious metals, reinforcing their status as preferred safe-haven assets; however, it is worth noting that since 2011 the Australian dollar against the Greenback has generally softened resulting in overall higher precious-metal prices in the Australian market.


Inflation and money supply growth

Another key factor is the expansion of the US money supply. After a rare contraction in 2022–23, the M2 money supply (available cash) has surged by USD $1.36 trillion since late 2023, reaching a record USD $22 trillion. Such growth is usually inflationary. Precious metals have long been viewed as natural hedges against monetary expansion, and gold has responded strongly to these conditions. Importantly, this trend is global, as central banks worldwide continue to expand balance sheets in response to economic fragility.


Rising US national Ddbt

The US national debt has now reached USD $37.19 trillion and is projected to surpass USD $40 trillion by the end of this year. Policy measures under the One Big Beautiful Bill Act (passed on July 4, 2025, America’s Independence Day) are expected to accelerate this trend, adding more than USD $3.4 trillion in direct spending and even more when accounting for interest. The relentless rise in debt erodes long-term confidence in fiat currencies, and perception of the Government and Fed’s ability to meet their debt obligations.  This jeopardises the bond market (another safe haven asset), and strengthens the case for holding precious metals as insurance against monetary debasement.


Capital rotation out of equities

Perhaps the most significant shift underway is a gradual rotation of capital from equities into precious metals. The Dow-to-gold ratio broke below its long-term uptrend line in 2024 that has been in place since the Global Financial Crisis, signalling a structural change: momentum has moved from stocks to metals. Historically, such rotations last 10–15 years. With US equities trading at valuations even higher than those preceding the Dot-com bust and the Great Depression, a correction appears inevitable. The Buffett Indicator currently sits at 214%, far above its historical average of 86%. When this bubble deflates, what is currently a small trickle can potentially become a substantial flow of capital finding its way into gold and silver.


Australian Gold Prices in April 2026

The foundations for another bull run in precious metals are now firmly in place. The question is what comes next. History often provides the clearest guide to the future. Between September 2024 and April 2025, gold rose 42%, a gain of AUD $1,591. So far this year, the price has closely mirrored last year’s chart patterns (as detailed in our earlier article). If that rhythm were to repeat, another 42% increase would imply a potential price of AUD $7,584 by April 2026. Even a more conservative trajectory suggests a range between AUD $6,000 and AUD $7,580 is plausible.

This outlook aligns with major institutional forecasts. Both JP Morgan and Goldman Sachs project gold to reach USD $4,000 (around AUD $6,125) by mid-2026. Goldman Sachs has even suggested that USD $5,000 (AUD $7,658) per ounce cannot be ruled out under certain conditions. In this context, today’s highs may not be an end point, but the makings of a much larger move.

In summary

Gold’s bull market is still in its early stages, driven by a powerful mix of catalysts: the prospect of a US rate cutting cycle, persistent inflation, ballooning debt, and the beginning of a capital rotation out of stocks. For silver, the rally is amplified by its dual role as both an industrial metal and a store of wealth, with technical patterns suggesting there is still significant upside potential.  For gold, central banks continue to accumulate at record levels, the metal’s role as the cornerstone of monetary security is being reaffirmed.

For Australian investors, these forces highlight why gold and silver remain essential holdings. With both metals outperforming equities over the past year, and with economic uncertainty unlikely to ease soon, precious metals continue to offer stability, protection, and long-term opportunity.

Posted on Leave a comment

Precious Metals Strengthens as Rate Cuts Loom and Silver Surges

Gold is currently trading at AUD $5,217, silver at AUD $59.64, and platinum at AUD $2,075. With prices consolidating close to record highs for both gold and silver, two key forces are coming into focus for investors: the anticipated cycle of rate cuts in the United States and the accelerating appetite for retail investment for silver in Australia. Together, these developments signal that gold and silver may have greater room to run.


The Rate Cut Cycle and Gold

For over a year markets have debated when the United States Federal Reserve would shift from tightening to cutting rates. That moment is now drawing close.  Each move is significant because it lowers the yield on short-term government bonds, reducing the “opportunity cost” of holding precious metals which generate no return.  When bonds pay less, investors look for safety elsewhere. History tells us that gold thrives in these conditions. Lower front-end yields (such as the U.S. two-year Treasury bond) remove one of the last barriers for large-scale institutional funds to allocate into bullion. At the same time, longer-dated yields in the American market remain elevated, a signal that investors demand greater compensation for risks such as political interference and unrestrained government spending. This cocktail of falling short-term rates and sticky long-term risks creates the perfect backdrop for gold to rise further.

Gold has already gained close to 30% this year in America (and just over 20% in Australia), but the environment remains supportive. Inflation in the United States is proving stubborn, government spending continues at record levels, and political risks weigh heavily on the credibility of monetary policy. These conditions strengthen gold’s dual role as both an inflation hedge and a safe haven against financial instability.

Looking back at history, gold has proven to climb more than 30% in the two years following the first rate cut. If the current cycle repeats that pattern, then the next leg of gold’s bull market may only just be beginning.  Read more about U.S. Fed rate cutting cycles and their relationship with recessions in our previous article.  By way of the Fed cutting rates, pressure will mount on the U.S. dollar, which in turn places pressure on gold purchased in AUD.


Silver’s Rising Influence in Australia

While gold continues to dominate headlines, silver has quietly outperformed in both American and Australian markets. So far this year, silver has climbed more than 31% in America, outpacing gold’s 28%.  Similarly, in Australia silver has seen over 25% gains compared to gold’s gains at 21%.  Much of this strength reflects growing demand from retail investors, and Australia has emerged as one of the largest markets worldwide for physical silver bars and coins.

As recently as 2019, Australian silver demand stood at under 3.5 million ounces. By 2022 it had surged to more than 20 million ounces, making Australia the fourth-largest market for physical silver retail investment globally. This growth has been supported by the favourable tax environment for bullion: generally, investment-grade precious metals carry no goods and services tax and, when held through retirement accounts, can ultimately benefit from reduced capital gains tax.

Although 2023 and 2024 saw a period of profit-taking, demand has remained far above pre-pandemic levels with expectations for silver investment to continue rising again this year. Many investors also hold the view that silver is undervalued relative to gold, strengthening its appeal.


Silver’s Dual Character: Industrial and Monetary

Unlike gold, which derives most of its demand from investors and central banks, silver enjoys a dual advantage as both an industrial metal and a monetary one. The global transition to renewable energy continues to drive consumption, with solar panels expected to absorb a record 140 million ounces of silver this year. Growth in electric vehicles, batteries, and data centres is adding further momentum.

At the same time, silver’s traditional role as a safe haven is once again in the spotlight. Rising global debt, persistent inflation, and escalating geopolitical risks are pushing investors toward tangible stores of value.  The price of silver compared to gold also offers a lower entry point into the precious metals markets. Technical patterns also suggest further potential, with the gold-to-silver ratio sitting well above historical averages. If that gap were to close, silver prices would need to rise meaningfully from current levels.

Preparing for What Comes Next

Taken together, the signals are clear. Gold is positioned to benefit from the global shift toward lower rates, while silver is finding strength in both industrial and investment demand. For Australians, the dual advantages of a supportive exchange rate and favourable taxation make these metals especially compelling.  The combination of weakening domestic currency, declining real yields, and surging silver demand paints a picture of continued resilience in the precious metals market. For those positioned early, the next stage of this cycle could prove to be transformative.

Posted on Leave a comment

Is Cash in the Bank High Risk? Bank Bail-In Laws

Gold finished strongly for the week. After early resistance near AUD $5,150, it pushed above $5,200, and currently trades at $5,189.  Silver, on the other hand, saw a more volatile $2 trading range before reaching higher and is at $59.53.  Platinum, at $2101, remained steady largely moving sideways. Precious metals continue to benefit from uncertainty in global financial systems, with one issue coming into sharper focus as we edge closer to a major correction: Australian bank bail-in laws. These laws, introduced in 2018, could directly impact those holding cash deposits, and highlight why gold, silver, and platinum remain critical stores of value outside of the banking system.  Passed by the Senate on Valentine’s Day, the laws are less of a love letter to Australian bank depositors and more like a tightly sealed pre-nuptial agreement that you probably never read before investing in the relationship.


Australia’s bail-in laws

In 2018, amendments to the Banking Act 1959 via the Financial Sector Legislation Amendment (Crisis Resolution Powers and Other Measures) Act brought Australia in line with the Bank for International Settlements’ (BIS) global “bail-in” framework, agreed at the 2014 Brisbane G20. Unlike the 2008 bail-outs that used taxpayer money to rescue failing banks, bail-ins place the burden on a bank’s creditors which, crucially, can include depositors.

Under the law, APRA (the Australian Prudential Regulation Authority) has “crisis powers” to step in, run distressed banks, and convert certain securities or deposits into capital to stabilise the institution. SMSF cash holdings are explicitly exposed, while ordinary deposit accounts are not excluded, which opens them to the possibility that they also could be written down or confiscated in a crisis. Rather than curbing risky investment behaviour by banks, the framework prioritises repayment of banks’ derivatives obligations ahead of depositors, raising concerns that everyday savers could be sacrificed to protect interbank exposures.

Bail-in versus bail-out

A bail-out involves taxpayer-funded capital injections, as seen during the Global Financial Crisis when governments rescued banks in the U.S. and Europe. Australia has historically avoided direct bail-outs, though during 2008–09 it guaranteed deposits and wholesale funding to protect stability. Bail-ins, by contrast, recapitalise failing banks by forcing creditors (including bondholders, hybrid investors, and potentially depositors) to absorb losses. This reduces taxpayer exposure but shifts risk squarely onto the private sector, potentially including those with cash in the banks.  By passing bail-in laws, Australia is just one of the G20 countries positioned to prioritise banks over people by legally being able to confiscate cash deposits in banks.


Who are the creditors that bail-in applies to?

In essence, when you deposit money into a bank account you lend that money to the bank.  This is why they pay you interest.  The banks then use your money to fund other projects, all of which allow them to produce a profit.  They do this under a fractional reserve system and retain only a small portion as liquid reserves.  You hold the right to demand payment which is what happens when you withdraw your money from the bank.  But until you withdraw it they loan it from you.  Because you lend your money to the bank, you hold the status of unsecured creditor.  And as a creditor, you could be subject to bail-in laws.  Under bail-in law, your right to claim payment can be written down if a bank is in distress, putting depositor funds at risk.


The $250,000 deposit guarantee is not absolute

People are generally more aware of Australia’s Financial Claims Scheme (FCS) than bail-in laws.  The FCS may provide a government guarantee of up to AUD $250,000 per account holder, per authorised deposit-taking institution (ADI).  Falling back on the FCS is often the first response from people on learning of the bail-in laws in an effort to dismiss risk.

However, this protection has limits:

Multiple banks under a single licence are treated as one entity. This means that if a person’s wealth is spread across two entities that share a licence, the guarantee is split between them.  For example if an individual has $50,000 deposited with St George, another $200,000 with Bank of Melbourne, and $300,000 with Westpac, they are only guaranteed a total of $250,000 across all accounts because these banks all use the same licence.  They could lose at least $300,000 (if not more) should the FCS ever be activated to “protect” their financial assets.

The $20 billion cap per ADI may be insufficient for large institutions. Refer to the table below and consider how far this will stretch across each bank and their deposits, and subsidiaries.

Critically, bail-in powers are applied before the FCS is triggered, meaning depositor funds could be used to stabilise the bank first. And only if the bank fails outright would the FCS potentially provide reimbursement.

Due process guarantees a delayed payment. FCS are to be paid out “within seven days.”  However, this starts after APRA’s attempt to first rescue the failing institution (by implementing bail-in), then they must apply to the Treasurer for support to declare the institution insolvent.  This process must go through the courts, then FCS is implemented, and you get the remainder of your money after bail-in “within seven days.”


Why this matters for investors

The IMF has noted that bail-in laws indemnify bank executives from liability, further shielding institutions and reducing accountability. This framework makes clear that in a crisis, depositor protection is not absolute. Holding significant cash in banks exposes savers to the risk of their funds being used to rescue the very institutions meant to safeguard them.

With bail-in laws enshrined in Australia, cash in the bank is not risk-free. Depositors are legally creditors and their funds could be at risk should a bank faces distress. This reinforces the case for precious metals as a decentralised, tangible store of wealth that sits outside the banking system. Gold, silver, and platinum cannot be “bailed in,” written down, or subjected to derivative losses. At a time when global monetary policy and financial stability are under strain, bullion offers investors independence and protection that bank deposits simply cannot guarantee.  Those savvy with their wealth understand what Shakespeare meant when he penned “it is better to be three hours early than one minute late.”  Preparation with a layered defence before a financial correction allows time for unexpected delays, avoids panic, reduces stress, and provides stability and strategy for the investor and consequently their dependents.  There has never been a better reason to invest in gold and silver today.

Posted on Leave a comment

Where the World’s Wealth Really Sits And Why the Skew Matters

Precious metals like gold, silver, and platinum have served as anchors of value for centuries, yet today they occupy only a fraction of global wealth. Spot prices currently stand at AUD $5,145 for gold $58.76 for silver, and $2,098 for platinum — levels that, when viewed against other asset classes, suggest precious metals have a long way to go despite enjoying record pricing. Meanwhile, vast sums are concentrated in asset classes where valuations are flashing warning signs.


Real Estate – The Global Asset Juggernaut

Real estate remains the preeminent asset class worldwide, often seen as an essential first goal for most retail investors. The industry totals at an estimated $300–400 trillion. This includes everything from owner-occupied homes and farmlands to multi-billion-dollar commercial developments. Although real estate is traditionally viewed as a stable, inflation-protected asset, there are emerging vulnerabilities. Post-pandemic, office spaces face structural demand shifts, and financing costs are tightening as central banks recalibrate interest rates. Demographic shifts and a mixed outlook for commercial use further cloud the picture. Added to this, the 18.6 year economic and real estate cycle suggests there could be up to another twelve months of high times for estate agents as they squeeze the last commissions out prior to the expected correction.  As a case in point, Sydney now “stands alone” as the most expensive city in the world for housing.  Extrapolate this around the country and it suggests the real estate bubble in Australia could be the largest elephant in the room.


Bonds – A System Under Strain

The global bond market remains the second largest financial asset class, valued at $130–150 trillion, encompassing government, corporate, and municipal debt. What’s particularly striking is how the debt ceiling has evolved from a legal limit into a baseline expectation for perpetual government spending. With central banks expanding their balance sheets and inflation proving sticky, policymakers appear trapped, facing a lose-lose between maintaining credibility and ensuring solvency. These are problems that cannot simply be printed away and this, in turn, chips away at confidence in fiat currency systems.

In this context, traditional safe-haven assets like U.S. Treasuries lose their appeal as yields drop. In comparison, physical gold and silver (non-counterparty, tangible, and historically resilient) emerge as rare stores of value that are not subject to the same fiscal pressures.  And despite not offering regular yields, they don’t rely on sovereign promises and are immune to default or devaluation risk, reinforcing their role as essential portfolio hedges.  As central bank interest rate cutting cycles ramp up look to see if there is a transfer of capital away from bonds and into precious metals.


The Equity Bubble – $100–120 Trillion

The global stock market, valued at USD $100 to 120 trillion, is not just large — it is historically expensive. A Bank of America survey indicates 91% of global fund managers believe U.S. stocks are overvalued, the highest since 2001, reflecting widespread concern about a potential bubble.  The Buffett Indicator (total stock market capitalisation divided by GDP) is now above 170% globally and over 210% in the U.S., far beyond the long-term average of approximately 100%. This signals a market priced for perfection to take profits but also highly vulnerable to economic shocks.

U.S. equities dominate with USD $50 to 60 trillion in value, and a staggering 55% of that is now tied to technology and tech-related companies. The “Magnificent Seven” alone account for 34% of the S&P 500’s total market capitalisation, up from 12% just a decade ago. Such concentration not only inflates valuations but also magnifies systemic risk; if one sector falters, the ripple effect could be severe.

While equities are celebrated for their growth potential, the current valuations imply minimal margin for error. For investors seeking safety, this is a time to question whether they are overpaying for future returns.


Precious Metals – The Overlooked Hedge

Despite their enduring role as stores of value, gold and silver account for just 2 to 3% of global financial assets (approximately USD $12 to15 trillion), with physical bullion holdings representing a tiny 0.1%. Retail investors typically allocate about 1% of their portfolios to gold, with silver allocations even smaller; professional wealth managers often hold none at all.

This low allocation stands in stark contrast to expert recommendations of 10 to 20% in precious metals. The material reality is that financial advisors simply do not recommend physical metals to retail investors because there is no commission on offer.  And if an investor prioritises regular yields (as opposed to wealth preservation) then capital gains may not be appealing enough to recommend.

Historically, gold and silver have preserved purchasing power through recessions, inflationary spikes, and market collapses. With stocks trading at historically stretched valuations and sovereign debt at record highs, the opportunity cost of holding bullion has rarely been lower. For patient investors, precious metals may be one of the few undervalued, time-tested safe havens left.


The Bigger Picture

Currently capital is skewed towards risk-on assets.  Of the estimated $500 to 600 trillion in global financial assets, the vast majority is concentrated in real estate (50 to 60%), bonds (20 to 25%), and equities (15 to 20%). Precious metals occupy a fractional share, far smaller than cash, private markets, or even cryptocurrencies. Given the extreme valuations in stocks and the lowering yield prospects for bonds, this imbalance raises a simple question: when the tide turns, will capital flow back to the one asset class that has proven itself for over 5000 years?

Posted on Leave a comment

Crisis Assets in Times of Chaos

Gold and silver have long been viewed a crisis hedge (assets that hold or gain value when markets turn volatile).  Over the last two decades, two major crises—the 2008 Global Financial Crisis (GFC) and the 2020 COVID crash—have tested this thesis.  Gold currently trades at $5,210, silver at $58.81, and platinum at $2,092.  All have offered significant gains to investors year to date.  Today, as global markets show signs of slowing and gold enjoys support above $5,100 in Australian dollars, it’s worth examining how these metals performed during those past upheavals and what the current technical landscape reveals about their evolving role in investor portfolios.


Gold crisis case study one: the GFC, a golden opportunity

During the Global Financial Crisis (GFC) gold proved its mettle. As with all asset classes it experienced a brief correction of 11.5% in late 2008 as liquidity evaporated and investors sold off assets indiscriminately to protect their wealth.  This sell off is typical of all major corrections and occurs in almost all asset classes, a knee-jerk reaction triggered by market panic. The only difference is that some asset classes bounce back faster than others.  Gold rebounded quickly and by 2011 (just over two years later) it reached a then-record high of AUD $1,714 (or an 85% increase), driven in Australia mainly by central bank easing, near zero interest rates, and ballooning sovereign debt.

The increase was amplified by a weakening AUD, offering domestic investors exceptional returns; however, note how currency exchange is the one variable that affects local precious metal prices beyond the spot price which is in USD.  The graph below illustrates the difference in gold prices in AUD versus USD.  Since the GFC, gold increased an additional 27% in local markets compared to the American market to date.  This is due to the Australian dollar weakening against the Greenback over the same period.  In fact, the difference in the two prices directly reflects the variation in the exchange rate between the two currencies.

For example, if gold was to remain steady in USD and the Australian dollar weakens against the U.S. dollar, more local currency is needed to purchase the same amount of metal. Hence it increases in Australian dollars.


Gold crisis case study two: the Covid 19 Pandemic Era, the shock and the surge

The COVID financial crash of March 2020 initially hit all asset classes, including gold and silver. But by mid-year, gold had broken through AUD $2,700 for the first time, with the gold price in American dollars also reaching unprecedented highs. Massive global stimulus, near-zero interest rates, and fears of long-term inflation turbocharged the move.  This time gold initially increased as the stock market crashed, providing protection for those investing in safe haven assets; however, it did eventually correct as the pandemic unfolded and then travelled sideways until the end of 2022 when it started its current climb to new heights.

So why was this time different?  Simply put, markets were unable to play out the expected way due to government interference. The purpose of the interference was to maintain confidence in the economy and it worked: Australia avoided a formal recession that many parts of the world endured.  In this time the government gave away free money through a raft of measures such as Job Keeper payments, Job Seeker supplements, cash flow boosts for businesses, early access to Superannuation, cash payments to households, home-builder grants, loan guarantees and more.  Similarly, the Reserve Bank of Australia engaged in quantitative easing measures such as bond buy backs, cheap funding for banks, and record low rates.

While every government aims to avoid recession, the cost shows on the RBA’s balance sheet.  From AUD $180 billion, it ballooned to $640 billion at the height of the pandemic by early 2022.  It is a similar story in the U.S.  To learn more about the Federal Reserve’s predicament read our article, The Fed is Boxed In While Gold and Silver Look Ready to Fly.  While quantitative easing was employed after the GFC, the significance of its use during Covid is its cumulative effects.  Neither balance sheets for the RBA or the Fed are as healthy as pre-GFC and the Covid 19 Pandemic Era conditions.  It has been exacerbated despite attempts to curb the debt. The problem with holding too much debt is that eventually markets will lose confidence in the RBA or the Feds ability to honour their debt obligations which leads to a precarious financial position that could end in an almighty shakedown in various sectors of the economy.


Precious metals in 2025: consolidation or take off?

Today, gold and silver are again in focus but under different conditions. Gold in AUD terms has climbed over 400% since 2008, while silver is up over 280%. Technical data indicates a strong upward channel for gold, with repeated breakouts followed by consolidations, suggesting a healthy bull market rhythm. Furthermore, a comparison between 2024 and 2025 reveals striking symmetry, where both years saw explosive moves into April followed by mid-year consolidation, setting the stage for potential spring breakouts.  We first predicted this in May and the three months since has proven the theory to be true.

Silver’s technical analysis is also compelling. The recent push above AUD $58 comes after a bullish recovery from $56.18. Historical patterns show that silver tends to outperform gold in the final stages of a bull cycle. The gold-to-silver ratio, now around 1:88, remains far above historic norms such as 1:60 – 70, or the 2024 ratio of what is coming out of the ground at 1:15, implying further upside for silver if a true bull leg begins.


The Broader Market Context

Compared to the equity markets, gold and silver have offered resilience, but not the staggering gains of tech-heavy indices. The NASDAQ has risen over 1,173% since the 2008, while gold has increased 403% in AUD and 266% in USD. However, such growth in equities comes with significant risk, especially as the current cycle nears what the 18.6-year economic model identifies as the “Winner’s Curse” phase: the euphoric end of expansion before correction.  For example, the NASDAQ (tech stocks) has expanded almost six times faster than the M2 money supply (current cash available in America).  This indicates that the NASDAQ is probably at the top end of valuations.  Those invested in tech stocks may feel constrained if the financial corrections are quick and violent, whereas real estate investors are more likely to experience a slow burn as capitulation unfolds in stages over time.

With global debt at record levels and central banks approaching the end of their tightening cycles, conditions are ripe for a return to the monetary expansion playbook, one that historically favours precious metals. If rate cuts resume and inflation expectations rise, the setup may mirror the post-GFC years (early 2010s), where metals staged strong gains in response to policy shifts.


Final Thoughts

History does not repeat, but it often rhymes. During both the GFC and COVID, gold and silver offered protection. As we approach another inflection point, facing economic fragility, shifting rate expectations, and historically strong technical setups, precious metals may once again be poised to outperform.  With September approaching, which is traditionally viewed as crash season in the stock markets, the coming months may determine whether gold and silver are simply pausing… or preparing to leap.