Posted on

War, Rates, Reality, and Precious Metals Pricing

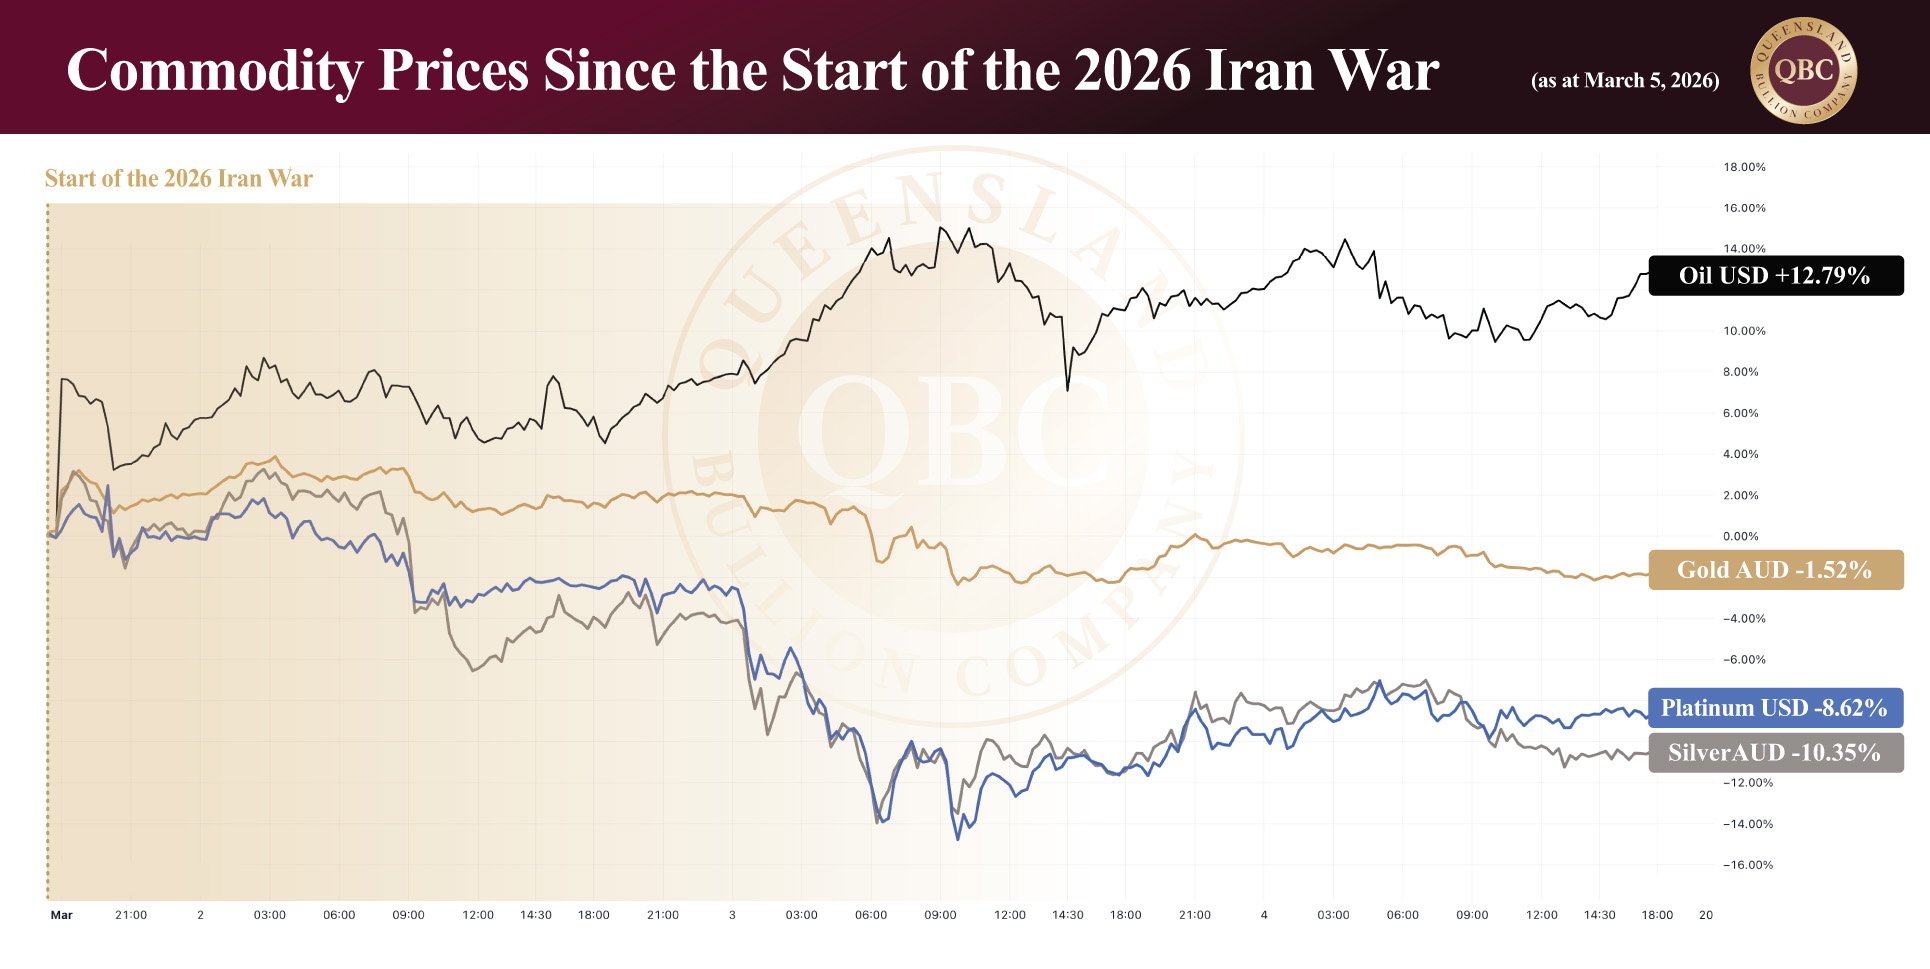
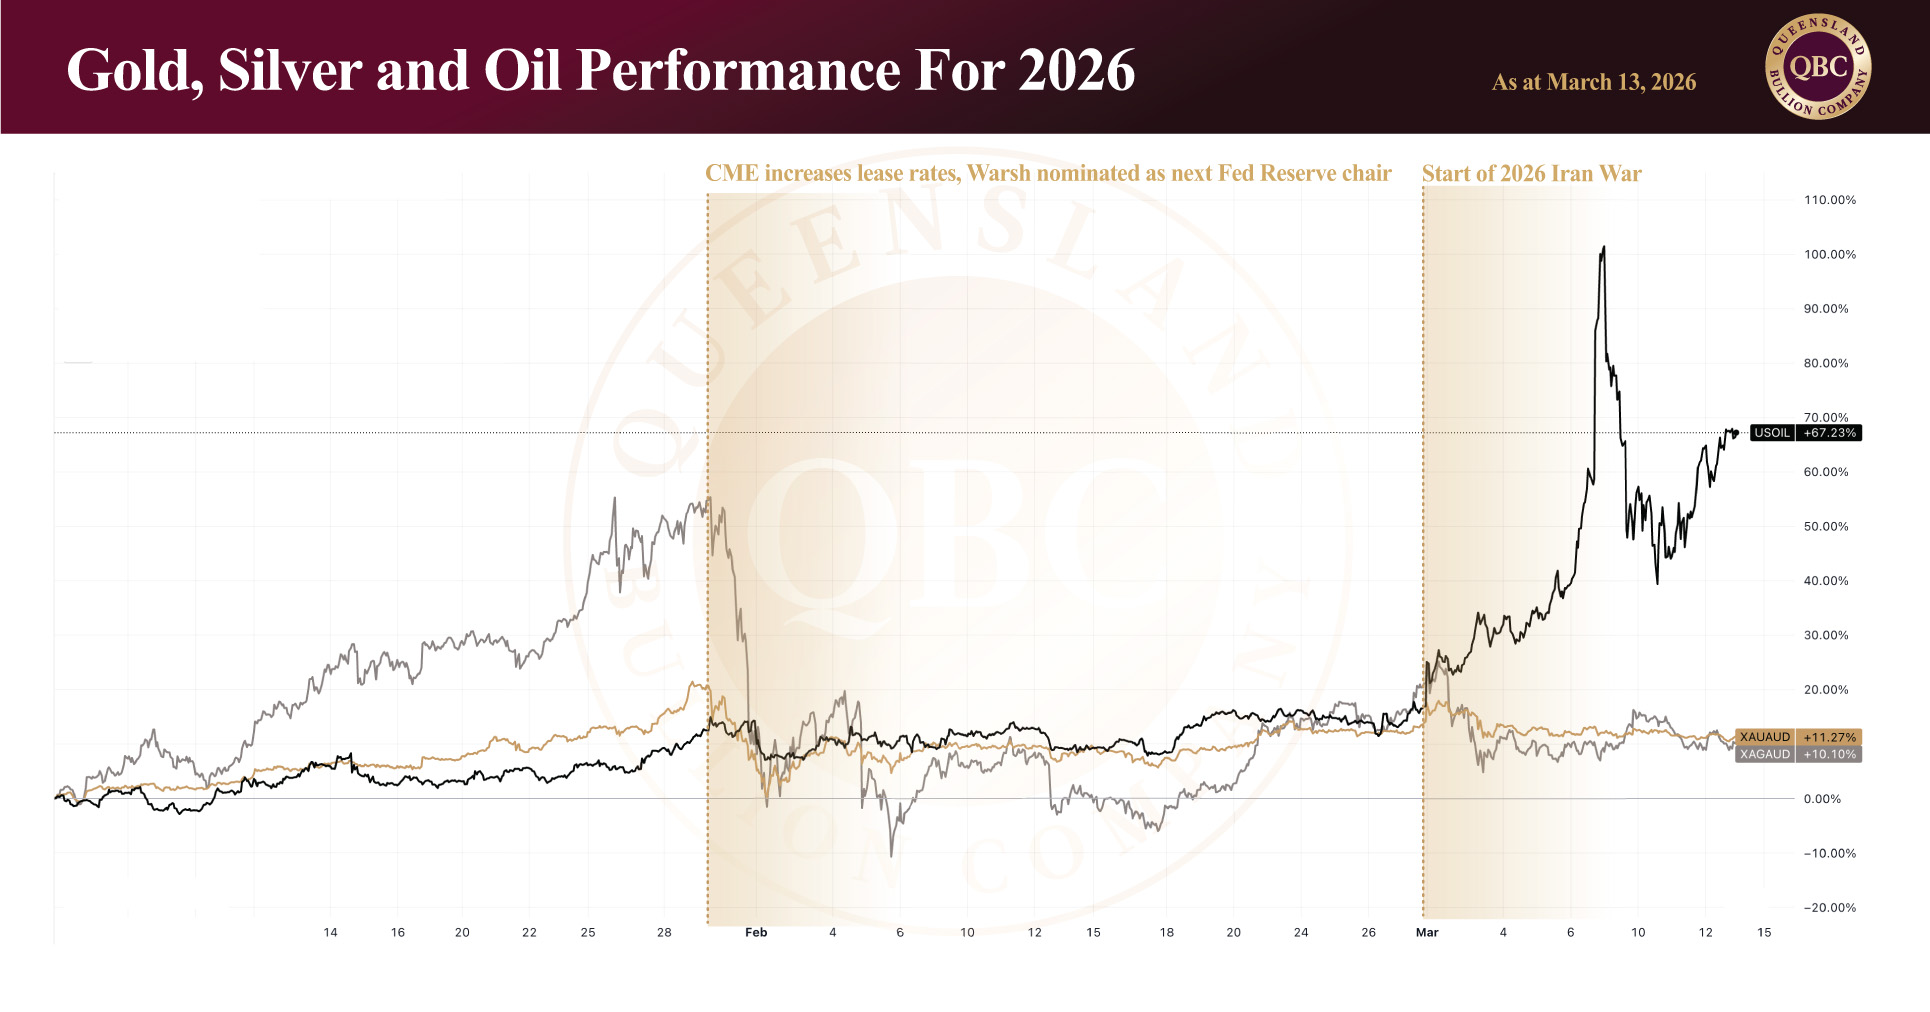
Since the outbreak of the 2026 Iran War, precious metals markets have behaved in a way that has surprised many observers. Rather than surging dramatically on geopolitical risk, gold and silver have largely traded sideways, with only brief spikes followed by consolidation. At the time of writing, gold trades around AUD $7,226 per ounce, silver sits near AUD $119.20, and platinum around AUD $3019.88.

This muted response has sparked a wave of explanations across financial media. Many commentators have pointed to oil prices, inflation expectations and the prospect of Federal Reserve rate cuts as the key drivers of precious metals demand. Yet when examined closely, these explanations fail to fully account for the market’s behaviour. To understand what is actually happening, investors must look at three interconnected forces shaping the current environment: interest rate expectations, inflation dynamics, and the unfolding reality of the conflict itself.

The Market Reaction: A Narrative That Doesn’t Quite Fit

Last week we explored the possibility of high oil prices increasing inflation over time and thus pushing the U.S. federal funds rate higher.  This week the market entertains different ideas.  The explanation circulating most widely in financial media centres is a simple idea: cooling oil prices reduce inflation fears, which in turn increases expectations for Federal Reserve rate cuts and creates a more dovish policy outlook. Under this framework, investors would naturally rotate into precious metals as monetary conditions loosen.

It is a tidy narrative. It also does not hold up under scrutiny.

A look at the CME FedWatch tool (the instrument traders use to price interest rate expectations in real time) tells a very different story. The probability of the Federal Reserve holding rates steady at next week’s FOMC meeting currently sits at 99.4%. That meeting is only days away.

More revealing than the number itself is the trajectory behind it. A month ago, markets were already assigning roughly 80% probability to no change in policy, meaning the outcome has been widely anticipated for weeks. Rather than softening as the meeting approaches (which the rate-cut narrative would require) expectations have only hardened. The probability of a rate cut has significantly reduced and now sits at around one-fifth of where it was a week ago.

In other words, the Federal Reserve is not moving, and markets know it. The metals market knew it as well and precious metals held its ground. That alone suggests the mainstream explanation is incomplete.


Inflation, Oil and the Real Yield Equation

While the market is focused on oil prices and inflation data, the key issue for investors is not simply whether inflation rises or falls, but how it compares to available yields. In the current environment, the Federal Reserve is expected to maintain its policy stance, leaving bond yields relatively stable while inflation risks remain tied to developments in global energy markets.

What ultimately matters for capital allocation is the relationship between inflation and those yields. Investors measure returns in real terms, the difference between the income provided by bonds and the erosion of purchasing power caused by inflation. If yields exceed inflation, Treasury bonds tend to attract capital. If inflation rises above those yields, assets that preserve purchasing power, such as gold typically hold more appeal.

Markets are therefore attempting to price several competing forces simultaneously: the possibility of inflationary pressure from oil, a Federal Reserve that appears unwilling to move rates in the near term, and geopolitical uncertainty surrounding the conflict in the Middle East. The result is a delicate equilibrium in which safe-haven flows are divided between U.S. Treasury bonds, the U.S. dollar, and precious metals, rather than concentrating in any single asset class.


Reality on the Ground

While financial markets appear to be pricing in a relatively short conflict between U.S.–Israeli forces and Iran, developments on the ground suggest a far more fluid situation.

President Donald Trump stated earlier in the week that the United States and Israel were making significant progress in the war and that the conflict could end “very soon,” comments that temporarily eased energy markets and moderated oil prices. Yet within hours, the administration’s messaging shifted. Defence Secretary Pete Hegseth indicated that the next wave of strikes would be the most intense bombing campaign yet, suggesting the conflict could expand before any resolution emerges.

As the second week draws to a close, the Western public has been told that the military campaign has already struck nearly 2,000 targets inside Iran since operations began on February 28. Iranian officials have made it clear that Tehran — not Washington — will determine when hostilities end. And Iran’s foreign minister has dismissed any immediate return to diplomatic negotiations.

The conflict’s economic consequences are also beginning to spread. Iran has declared the Strait of Hormuz closed, a move that threatens one of the most critical chokepoints in global energy trade. The disruption has already forced Iraq to curtail production and led Saudi Arabia’s largest refinery to suspend operations.  Recently two oil tankers carrying Iraqi oil have been attacked with one dead and both tankers ablaze.  Additionally, three merchant ships have been struck with a Thai registered bulk carrier sustaining significant damage with crew rescued by the Omani Navy.

Even brief interruptions in the Strait of Hormuz can send shockwaves through energy markets. Despite a temporary pullback in oil prices earlier this week, the broader supply shock remains unresolved. In that context, the brief dip in gold and silver attributed to dollar strength was quickly absorbed by the market.


In Summary

Financial markets currently appear to be operating under one central assumption: the conflict will be short-lived. Asset prices, including gold, silver and oil, reflect this expectation.

Yet history suggests that wars rarely unfold according to early forecasts.

The last major regime-change operation conducted by the United States was in Iraq which began in March 2003 and lasted nearly nine years, concluding only in December 2011. More recently, Russia announced in February 2024 that its “Special Military Operation” in Ukraine would last ten days. Two years later, the conflict remains ongoing.

If the Iran conflict resolves quickly as President Trump suggests, markets may remain relatively stable. Risk-on sentiment would strengthen, oil prices could retreat, and precious metals might consolidate further after their recent advances.

But if the conflict continues or expands the current market assumptions may prove incorrect. In that case, volatility could increase sharply. Risk-off sentiment would return, and safe-haven demand for gold and silver could reassert itself.

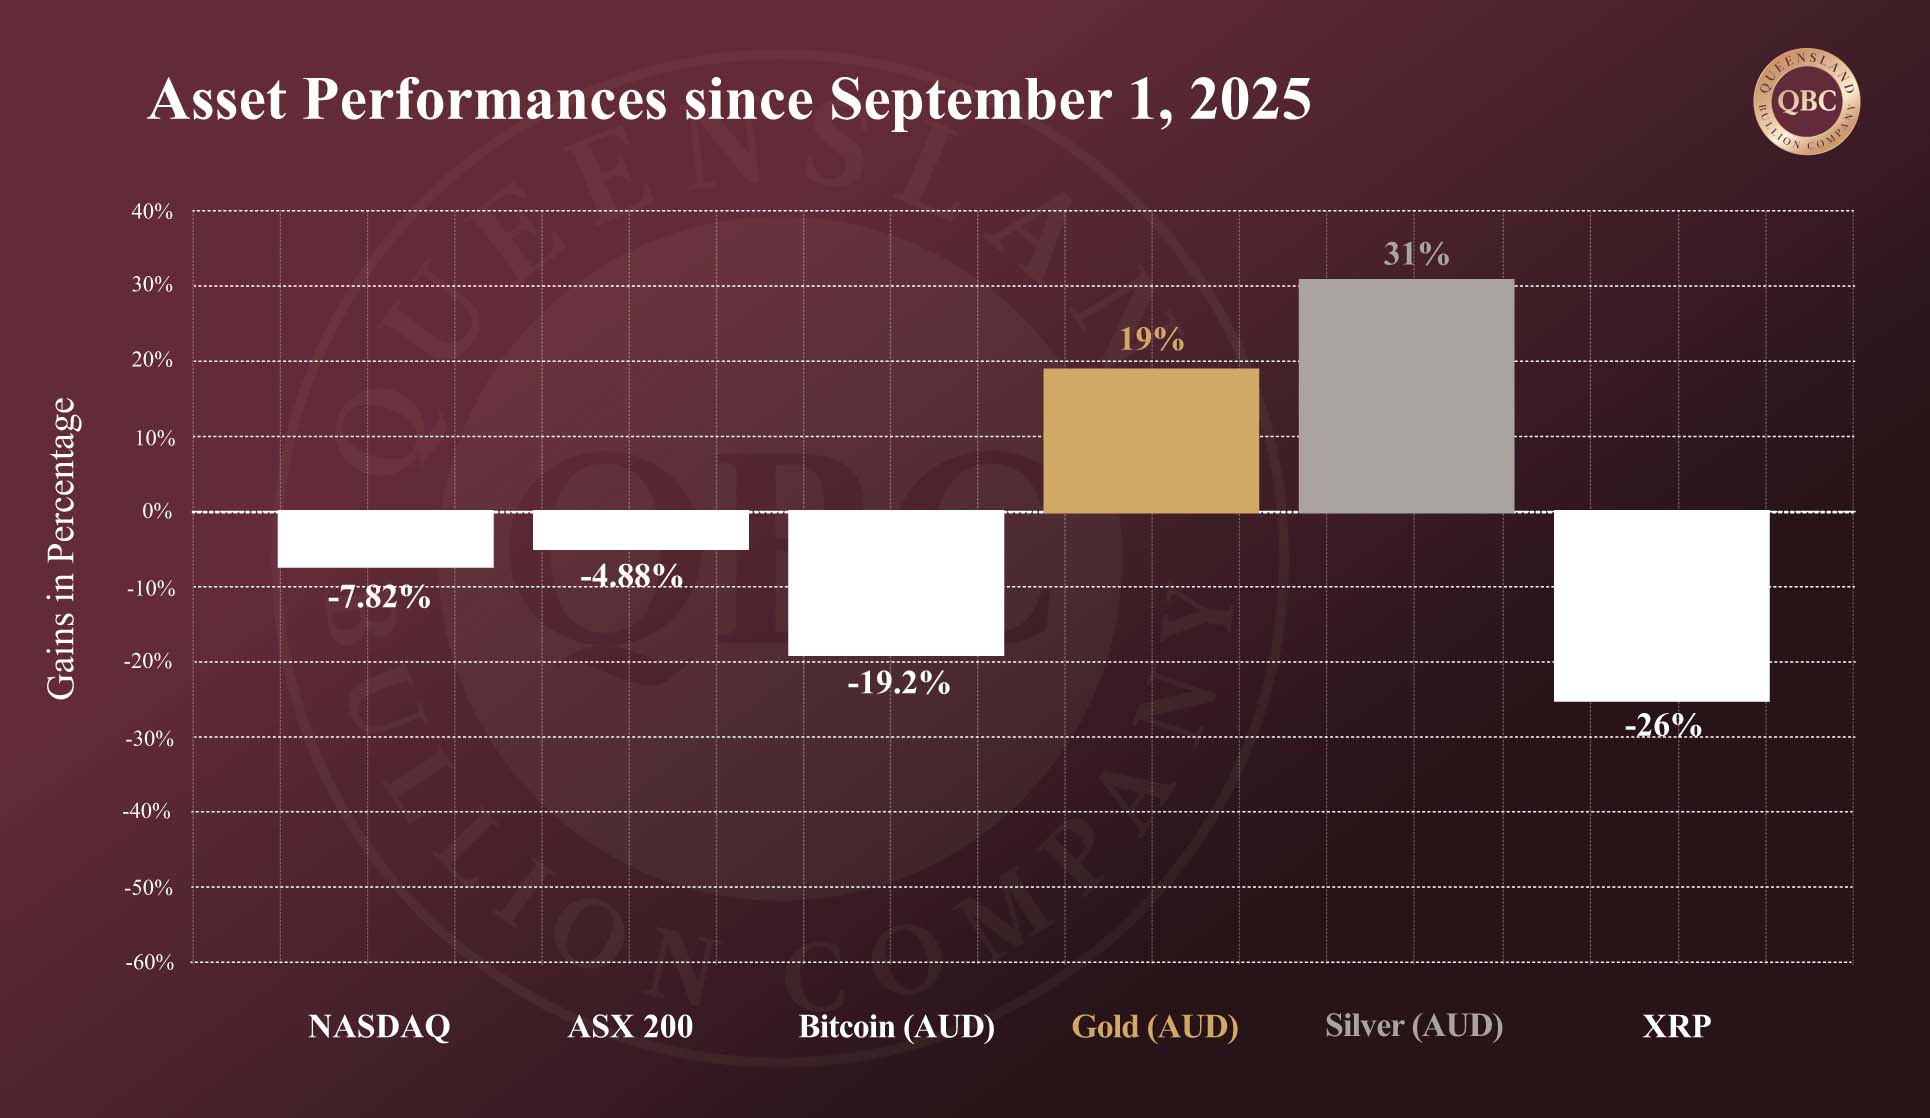
Current geopolitical risk has followed historical corrections in the metals markets.  Since the highs in January, gold dropped 17.5% and silver 42% in less than a week. Since then they have both made progress in recovering with gold reducing this pull back to just 8.5% and silver to 29%.  Periods like this often test market consensus. Investors tend to position themselves according to what they believe will happen next. Yet history repeatedly shows that major market shifts occur when those expectations turn out to be wrong. If that moment arrives again, precious metals may once again move rapidly as investors reassess the true scale of geopolitical risk.

Posted on

War Without a Rally: Understanding the Precious Metals Response

The escalation of conflict in the Middle East has once again placed global markets on high alert. What began as rising tensions between Israel and Iran has quickly evolved into a broader regional war involving multiple state and non-state actors. Traditionally, such geopolitical instability sends investors rushing toward safe-haven assets like gold and silver. Yet the latest market reaction has been more complex than expected.

At the time of writing, gold trades around AUD $7,269 per ounce, silver sits near AUD $118, and platinum has also experienced downward pressure in recent sessions currently at AUD $3066. While precious metals initially surged when the war erupted, price action has since diverged. Gold has largely moved sideways, while silver and platinum have declined from their conflict-driven highs. To understand this unusual behaviour, investors must look beyond the battlefield itself and examine the wider forces shaping markets, particularly oil prices, inflation expectations, and global monetary policy.


The war expands

The current crisis has rapidly grown into a multi-front regional conflict involving the United States, Israel, Iran, Hezbollah in Lebanon, and several Gulf states that host American military bases and assets. President Donald Trump has suggested the war could last five weeks or longer, raising concerns about broader regional destabilisation.

Israeli officials have described the military campaign as a “broad and joint operation to thoroughly degrade the Iranian terrorist regime and remove existential threats to Israel over time,” noting that the current escalation follows months of close strategic coordination between themselves and America. Western allies have begun to participate in varying capacities. France has entered the war in what it describes as a strictly defensive role, deploying naval and air assets to the region. The United Kingdom has also positioned forces in Cyprus and reportedly intercepted drones over Jordan as tensions intensify.

Civilian safety concerns are escalating alongside military operations. On March 2, the U.S. State Department advised American citizens to “depart immediately” from fourteen Middle Eastern countries, including Bahrain, Egypt, Iran, Iraq, Israel, the West Bank, Gaza, Jordan, Kuwait, Lebanon, Oman, Qatar, Saudi Arabia, Syria, the United Arab Emirates and Yemen. Similar warnings have been issued by allied governments. More than 100,000 Australians are currently in the Middle East, and the Australian government has advised citizens to avoid travel to key transit hubs such as Qatar and the UAE.

Public opinion remains deeply divided. Public opinion in America indicates that only 25% of respondents support the U.S.–Israeli attacks on Iran, highlighting the controversial nature of the expanding war.


Oil, inflation and the precious metals puzzle

One of the most immediate economic consequences of the conflict has been disruption to global energy markets. The Strait of Hormuz, one of the world’s most critical energy chokepoints, has become a focal point of concern. Iranian Revolutionary Guard forces reportedly warned vessels that passage through the strait was prohibited, effectively threatening a key artery for global energy trade.

Approximately 20% of global oil supply and roughly $500 billion worth of energy shipments pass through the Strait of Hormuz each year. The waterway also handles shipments of chemicals and fertilisers, meaning prolonged disruption could ripple through agriculture and food supply chains worldwide. Following the initial attacks, oil prices surged from USD $70.51 to USD $76.07, a 7.8% increase since the start of the conflict. Analysts warn that if the war significantly disrupts supply, crude oil could rise toward USD $100 per barrel, potentially adding 0.6–0.7 percentage points to global inflation.  How this translates to the cost of living is that there could be a significant inflationary increase between 20 and 30%.

Higher oil prices have important implications for monetary policy, particularly in the United States. The Federal Reserve operates under a dual mandate: maintaining price stability and promoting maximum employment. Inflation currently sits slightly above target at 2.68%, while the Federal Open Market Committee (FOMC) has maintained the federal funds rate between 3.5% and 3.75% in an effort to curb inflation.

If rising oil prices push inflation higher, the Fed may respond by tightening monetary policy or maintaining higher interest rates for longer. When interest rates rise, U.S. Treasury yields become more attractive to investors, drawing capital into bond markets and strengthening the U.S. dollar. Both Treasuries and the dollar are also considered safe-haven assets, meaning that during periods of geopolitical stress, capital can flow into these assets instead of precious metals.

This dynamic helps explain the recent market behaviour. Rather than seeing a broad surge in commodity pricing, investors have split capital across multiple safe havens: Treasury bonds, the U.S. dollar, and precious metals. Because gold does not produce a yield, stronger bond returns can temporarily reduce its appeal. Meanwhile silver has a significant industrial component, meaning concerns about slower global growth (potentially triggered by higher energy costs) can weigh on its price in the short term.

In summary

The muted reaction in precious metals despite escalating geopolitical tensions highlights the complexity of modern markets. In the short term, the lack of a dramatic surge in gold and silver suggests two factors could be playing out. Firstly, investors may have already priced in a significant degree of geopolitical risk before the conflict escalated. Secondly, markets may be assuming the confrontation will remain limited in duration compared to previous large-scale regime-change conflicts; however, wars based on regime change have not historically lasted weeks as anticipated by the American government, rather it usually takes years (the Iraq War being case in point).

Over the longer term, the broader outlook for precious metals remains strong. The underlying drivers (persistent geopolitical instability, structural debt pressures, ongoing inflation risks, and silver supply deficit) have not disappeared. If the conflict deepens or begins to threaten global energy supply more severely (especially if it takes more time than anticipated), markets may rapidly reassess their positioning. If it does last longer, military application of silver will no doubt put upward pressure on pricing as both sides look to accumulate sufficient supply to achieve their military goals.  In that scenario, gold and silver could once again move sharply higher as investors seek protection against both geopolitical and economic uncertainty.

Posted on

Forecasts and Fire Horses: Navigating Precious Metals Volatility

Short-term volatility has once again taken centre stage in precious metals markets. After an extraordinary run into January, silver’s sharp correction, gold’s consolidation near recent highs, and renewed currency strength have combined to produce swift price swings in a compressed timeframe. At the time of writing, gold trades at approximately AUD $7,031 per ounce, silver at AUD $108.65, and platinum at AUD $2,943.

This article unpacks three key focusses: the Lunar New Year liquidity vacuum and associated volatility, and global gold and silver price forecasts for 2026. We begin with the immediate catalyst, the temporary withdrawal of Asian liquidity during the Lunar New Year, and why it matters more than many realise.


Lunar New Year Liquidity Vacuum and U.S. Data Risk

An additional layer of short-term volatility has come from the Lunar New Year holiday across Asia. Official announcements from the Shanghai Gold Exchange (SGE) and Shanghai Futures Exchange (SHFE) confirm February 15–23 as the core shutdown period in honour of the Spring Festival. During this time, physical markets, retail gold shops, and related bullion activity across Mainland China largely pause. When trading resumes, markets often experience volatility driven by pent-up demand and order imbalances accumulated during the break.

China’s absence is particularly significant. Mainland China, Hong Kong, Singapore, Taiwan and South Korea stepping away from trading creates a noticeable liquidity vacuum in global precious metals markets. With the SGE and SHFE offline, the so-called “Shanghai Premium” temporarily disappears, reducing one of the key physical pricing anchors for gold and silver. In thinner conditions, price movements become more sensitive to Western futures flows and currency shifts. It is easier to create larger ripples in a smaller pond.

With much of Asia celebrating the Year of the Fire Horse rather than participating in markets, influence shifts decisively toward U.S. drivers. This week’s calendar adds further fuel: the release of the Federal Open Market Committee minutes by the Reserve Bank (released today), initial jobless claims and trade deficit data (February 20), and advance Q4 GDP figures (February 21). In a thinner global environment, these events can amplify volatility. Strong growth data would likely pressure precious metals further, while signs of economic strain could trigger renewed safe-haven buying. Without Asian markets to absorb and balance flows, the reaction to U.S. headlines may be sharper than usual.


Global gold forecasts for 2026

Following gold’s recent intraday high of USD $5,600 (AUD $7,934), major global banks are now projecting a further leg higher over the next 12–18 months. Current institutional forecasts cluster well above recent highs, with several targets extending into the low-to-mid USD $6,000 (AUD $8,497) range and beyond into 2026. Even the more conservative outlooks still imply resilience from present levels rather than a structural reversal.

The consistency of these projections signals a broad institutional view that gold’s secular bull market remains intact. Geopolitical tension, persistent fiscal imbalances, central bank accumulation, and structural debt pressures continue to underpin long-term demand. In that context, the recent move through USD $5,600 (AUD $7,934) may prove less a peak and more a stepping stone within a larger multi-year advance.

Global silver forecasts for 2026

The updated silver projections reveal one clear theme: conviction is high, but consensus is not. On the bullish end, major institutions and global banks are forecasting a return to (and in some cases well beyond) the recent spike, with targets clustering around USD $150–$160 and even wider upside scenarios extending materially higher. These forecasts reflect the structural argument: persistent supply deficits, tightening physical availability, and the growing tension between paper leverage and real-world metal. In this camp, volatility is viewed not as a warning sign, but as a feature of an emerging structural repricing.

By contrast, the more conservative projections sit in a broad USD $75–$85 range, with some banks outlining trading bands rather than outright breakout targets. These estimates acknowledge the same supply backdrop but place greater weight on cyclical slowdowns, policy uncertainty, and silver’s well-documented tendency to overshoot in both directions. The unusually wide spread between bullish and conservative forecasts is itself a consequence of volatility. Silver has demonstrated its capacity for extreme price acceleration and equally sharp retracements, making forward projections inherently sensitive to timing assumptions. In short, the dispersion in targets is not confusion; it is a reflection of a market that has entered a high-velocity phase where long-term structural forces and short-term swings create an interesting juxtaposition.  Time remains of the essence in such circumstance, being the only factor that can provide clarity moving forward.

In summary

Short-term volatility rarely arrives with warning, but it rarely changes the long-term trajectory either. The Lunar New Year liquidity vacuum has temporarily amplified price swings, U.S. economic data continues to inject headline-driven reactions, and the divergence in global forecasts reflects a market recalibrating after extreme moves. Yet beneath the noise, the structural themes remain unchanged: central bank demand for gold persists, fiscal pressures continue to build, and silver’s supply constraints remain unresolved.

Periods like this tend to test conviction. Liquidity thins, headlines dominate, and price action feels exaggerated. But volatility does not negate the secular trend — it simply accelerates sentiment shifts within it. As Asian markets reopen and U.S. data is absorbed, clarity will return. In the meantime, investors would do well to distinguish between temporary dislocation and structural change. Gold’s broader advance remains intact, and silver’s high-velocity phase underscores both opportunity and risk. In markets such as these, preparation and positioning matter far more than reacting to each ripple in a thinner pond.

Posted on

Purchasing Precious Metals: How to Make Sense of Premiums

The past fortnight delivered one of the most dramatic reversals in silver’s modern history. After surging into overbought territory in January, silver’s euphoric run came to an abrupt end. At its peak on January 29th, silver reached an intraday high of AUD $172, only to plunge to AUD $92.90 by February 6th, a staggering $79 correction in just one week. It marked the most significant weekly decline since the volatility of the 1980s.

At the time of writing, gold trades at approximately AUD $7,093, silver at AUD $106.66, and platinum at AUD $2876. While the headline price moves captured attention, Australian retail investors quickly discovered that spot price is only one part of the equation. Two overlapping forces, extreme volatility and rising wholesale premiums, have shaped the local buying environment. Understanding both is essential when navigating precious metals markets during periods of stress.


Volatility: what really caused the crash?

Mainstream commentary was quick to attribute the sudden drop in asset prices to U.S. President Donald Trump’s nomination of Kevin Warsh as the next Federal Reserve Chair. Markets had largely anticipated a more dovish appointment, someone more likely to lower interest rates to support growth. Instead, Warsh is widely regarded as more hawkish, potentially favouring continued quantitative tightening and even rate hikes if inflation persists.  News outlets framed the sell-off as a market repositioning event, investors adjusting expectations around interest rates and economic growth after Trump suggested Warsh could help deliver 15% economic expansion, something the U.S. has historically achieved only during wartime mobilisations.

However, while political headlines dominated coverage, a more mechanical force was unfolding beneath the surface.  The CME Group (owners of the COMEX) raised margin requirements on silver from 15% to 18%, and on gold from 8% to 9%. In the following two weeks, margin requirements were adjusted upward three separate times.

When margin requirements rise, leveraged traders must either inject additional capital or liquidate positions. In a market already heavily leveraged, this can trigger cascading forced sales. Automatic stop-loss orders are hit. Positions are unwound. Selling feeds on itself.  The result was not simply a change in economic expectations, it was a forced liquidation cycle. Historically, margin hikes have been used during overheated conditions to cool speculative excess. In this instance, the scale of leverage amplified the impact dramatically.  Read more about the paper versus physical divide within Western markets here.


How did this affect the Australian market?

Volatility at this magnitude does more than move prices; it alters trading behaviour.  Bullion merchants must constantly manage inventory risk. When silver swings $79 in a week, the ability to hedge exposure becomes strained. Depending on previous positioning and risk appetite, many dealers responded differently.  Some temporarily closed trading; others limited online or in-store transactions; still others introduced minimum purchase thresholds.

Queensland Bullion Company was one of a very few operators that remained open and trading throughout the volatility, both in-store and online, but the broader industry response highlights how extreme paper market movements can disrupt physical retail access.


Western spot vs Shanghai spot: the physical disconnect

To understand premiums, one must understand the divergence between Western and Shanghai spot pricing.  Western spot prices are derived primarily from futures contracts traded on the COMEX in New York and the London market. Each silver futures contract typically represents 5,000 troy ounces. However, for every contract backed by physical silver, estimates suggest there may be 350 or more paper claims referencing the same underlying metal.  The result is a pricing mechanism dominated by leveraged financial instruments (paper contracts), not necessarily by physical supply.

China operates differently. Through a licensing system as at January 1, 2026, the Chinese government has limited exporters to approximately 44 approved entities and maintains tighter strategic control over silver flows, indicating its willingness to maintain as much control of physical silver as possible.  Hence, Shanghai pricing reflects a market far more influenced by physical metal than derivatives.

Traditionally, Western and Shanghai spot prices track closely. But during January’s volatility, the gap widened dramatically. On January 30th the divergence reached USD $38.69, an unprecedented spread and a clear signal of strain within the Western paper market and the lack of silver in the system. When physical demand outpaces available supply and paper claims exceed deliverable metal disconnects appear.

Sourcing silver in Australia

Australian refineries historically sourced much of their stock domestically. That dynamic has now shifted.

With tight global supply conditions and a persistent five-year deficit between mined output and industrial demand, refineries are increasingly sourcing silver from Asia. Asian markets reference Shanghai pricing, not Western paper pricing.  This means refinery input costs have risen materially.  Those higher wholesale costs flow downstream: refineries pass increased costs to bullion merchants and bullion merchants adjust retail pricing via higher premiums.

Since the September 2025 bull run, wholesale premiums for silver have increased more than tenfold as wholesale costs balloon. Importantly, these higher premiums are largely reflected in bullion merchant sell prices, not buy-back prices, meaning investors selling silver are not typically receiving the same premium expansion.

This is a supply-chain adjustment, not opportunistic pricing.


In Summary

Two overlapping forces have shaped the current retail environment. The first is volatility, (driven largely by margin hikes and forced liquidation in leveraged futures markets) which disrupted normal trading conditions and triggered sharp price swings. The second is a structural shift in sourcing as refineries have become increasingly tied to higher Shanghai-based physical pricing, resulting in sustained increases in premiums across the supply chain.

Despite the turbulence, the broader backdrop remains intact. A five-year global supply deficit continues to weigh on the market, while new silver mines require seven to twelve years from discovery to production. At the same time, approximately 65% of silver demand is industrial, embedded in the infrastructure of modern living. The underlying market drivers have not changed. Corrections serve to reset excess, premiums reflect supply chain realities, and physical metal remains finite. For long-term investors, the message is clear: understand the mechanics, look beyond the noise, and continue accruing physical metal strategically.

Posted on

Silver’s Breakout: Unprecedented Gains, Structural Strain, and What Comes Next

Silver has entered rare territory. Its recent surge is not merely strong; it is historic. October marked only the third time in the past fifty years that silver has reached a true cyclical peak, joining the explosive rally in 1980 (thanks to the Hunt brothers) and the post Global Financial Crisis (GFC) rally in 2011. Year to date, the metal has climbed an extraordinary 107%, rising from AUD $48.17 on December 17, 2024, to a historic intraday price of AUD $100. Over the past month alone silver has gained 28.77% (or AUD $22.23), pushing the gold-to-silver ratio sharply lower and reawakening long-dormant interest in the monetary metal. At the time of writing, gold trades at AUD $6,494.82 per ounce, silver at AUD $96.31, and platinum at AUD $2,821.40. With prices pushing deeper into record territory, the natural question is: what exactly is driving this spike, and what does it signal for silver in the months ahead?

This brings us to the core forces underpinning silver’s extraordinary performance, forces that extend well beyond short-term speculation and point toward deeper structural shifts now shaping global precious metals markets.


Why silver has spiked: the forces now in play

One of the most significant catalysts behind silver’s recent ascent is the growing tension between paper claims and physical availability. After five consecutive years of global supply deficits, investors in derivative markets are increasingly demanding physical settlement rather than rolling their contracts through for another term. Each contract on COMEX is typically based on 5,000 troy ounces. Yet industry estimates suggest that more than 300 paper claims may sit atop each of these original contracts. What this means is that the same ounce of silver may have multiple simultaneous claims in excess of 300 times, a structure that functions only as long as most traders do not ask for delivery.

That assumption is now being tested.  Earlier this month when silver decisively broke upward, approximately 8,300 contracts (around 41 to 42 million ounces) were simultaneously open for delivery, prompting COMEX to halt operations for several hours due to what it described as a data centre outage.  Bullion banks, including JP Morgan, are reportedly struggling to meet delivery requests, and concerns are mounting about COMEX’s ability to fulfil obligations into the March 2026 delivery cycle. Current estimates place the probability of operational strain at 70 to 80%, and the risk is not abstract. If delivery requirements exceed exchange capacity, the market could face an unprecedented structural shock.

Western paper claims have ballooned in recent years with silver derivatives thought to exceed USD $21 trillion today, potentially reaching USD $26 trillion by 2030.  The paper market consists of futures, options, forwards, and OTC derivatives, a multi-trillion-dollar paper-based tower of leverage that references silver but is rarely backed by it. In contrast, China and India have quietly become the gravitational centres of the global silver market, absorbing between 10,000 and 20,000 metric tonnes of physical per year, with additional “unofficial” flows reportedly channelled into undisclosed state vaults.

Looking ahead, the March 2026 is of particular concern: more than 118,000 contracts are currently open, representing nearly 600 million ounces of silver. Even if just 10 to 20% of these stand for delivery demand would exceed the available float. With global supply deficits stretching into their fifth year the potential for a delivery crunch is significant. For silver investors, this dynamic is now moving from theoretical to structural, and the months ahead are poised to be critical.

The gold-to-silver ratio: a signal worth watching

Another major development is the compression of the gold-to-silver ratio, now sitting at 65. This figure reflects how many ounces of silver are required to equal the value of one troy ounce of gold. Since 2000, the average has hovered around 80. During the previous century it oscillated between 50 and 70.  In April 2020 it hit an all-time high of 114 at the onset of the Covid-19 Pandemic Era. More recently, earlier this year the ratio climbed to 106 before cascading downward as silver prices accelerated.

History shows that when silver outperforms gold aggressively it tends to do so for brief, explosive windows. After the 2008 GFC, when silver peaked at AUD $44.56, the ratio reached a low of 31, a moment that delivered exceptional returns for those who rotated from silver into either gold or cash. Silver advocates will be watching this ratio closely as it continues to contract, knowing that timing exits well during such periods can dramatically amplify portfolio outcomes.

The Australian Dollar: A Hidden Catalyst

While much attention is placed on the price of the metal itself, currency movements are equally important for Australian investors. The AUD has traded sideways against the Greenback since late June but has recently strengthened from USD $0.6445 on November 20 to USD $0.6616 today, representing a $2.65% increase. Remarkably, silver is achieving all-time highs in the Australian market even with a strong local currency. The AUD is now at the upper end of its current trading range. Should the currency weaken (an outcome with precedence given Australia’s sensitivity to Chinese demand cycles) silver and gold AUD prices in would almost certainly rise from already elevated levels.

In summary

Silver has delivered one of the most remarkable years in its modern history. Its 107% twelve-month gain, its strong monthly performances, and the structural pressures building beneath the global derivatives market all point toward a metal in transition from undervalued secondary asset to a primary driver of safe-haven demand. The gold-to-silver ratio is tightening, the Australian dollar is providing additional leverage, and concerns over the resilience of Western precious metals exchanges are attracting unprecedented investor scrutiny.

For those already positioned in silver, the task now is vigilance. For those yet to secure exposure, the question is not whether silver is volatile (it always has been) but whether the structural forces now at play justify a strategic allocation despite the volatility. All evidence suggests that the conditions forming today could define the next major chapter in silver’s long and cyclical history.

If silver has indeed begun its next major secular move, preparation will matter more than timing. And right now, the opportunity sits squarely in front of us. If you are considering buying silver online, then visit this page for the latest pricing and sizing options.

Posted on

Tracking the Shift: Precious Metals vs Tech, Crypto and Equities

Markets have entered a decisive phase as investors reassess where capital is safest, and where it can still grow. Two months of heightened volatility have sharpened the contrast between risk-on and risk-off assets revealing clear winners as global uncertainty persists.  Last week we examined the theme of asset class rotation and how capital moves between risk-on and risk-off sectors as conditions evolve. Building on that discussion, today we compare how gold and silver are performing against major indexes and cryptocurrencies since early September and year to date. At the time of writing, gold trades at AUD $6,416 per ounce, and you can buy silver bars at AUD $79.89, and platinum at AUD $2,426. With these spot figures in mind, let’s explore how the rotation is playing out across markets.


Influencing Factors

One of the most interesting developments is gold’s resilience is the recent rebound in expectations for a rate cut. After the release of the U.S. Federal Reserve minutes from its November meeting, markets were reminded that rate policy is far from settled. While some Fed participants favour cuts if the economy progresses as expected, many others suggest holding rates steady for now. Chair Jerome Powell reinforced this when he stated that a December rate cut was not a “foregone conclusion.” However, since then there have been dovish comments from key officials.  Recently, New York Fed President John Williams signalled there was “room for further adjustment,” and Fed Governor Christopher Waller deeming a December 25-basis-point cut “appropriate” due to persistent labour market weakness, downplaying the resilient September jobs data as likely to be revised lower and emphasizing employment risks over sticky inflation. The CME FedWatch probability for a December cut has surged to 85.1% as of November 25, up sharply from 42.4% a week ago and well above the post-minutes low of 33.6%. That renewed consensus and optimism means that gold’s earlier decline (triggered by an overbought market) is being reversed as the market refocuses on fundamental drivers, such as lower-for-longer rates supporting safe-haven demand, rather than immediate policy uncertainty.

That shift in sentiment is playing out across the asset spectrum. Lower rates typically move demand towards non-yielding assets like gold and silver. At the same time, the expectation of a rate cut means less new liquidity for risk-on sectors such as equities and cryptocurrencies. Because of this, capital is tending to favour safe havens assets.


What This Means in Practice

When interest rates are cut, the opportunity cost of holding gold and silver falls which makes them more attractive. Currently, with the probability of a cut reduced, precious metals are holding their ground rather well. Simultaneously, with fewer rate cuts expected, less new money is flowing into equities and crypto. This dynamic is visible in the performance numbers as at last Friday: the Nasdaq Composite started September at 23,951 and now sits at 22,078, down 7.82 %. The ASX 200 began the month at 8,865 and is now 8,432, down 4.88%. Meanwhile, Bitcoin fell from AUD $165,865 to AUD $134,003, a colossal 19.2 % drop. In contrast, gold climbed from AUD $5,306 to AUD $6,315 (+19%), and silver from AUD $59.76 to AUD $78.55 (+31%).


Performance Year to Date

When we look at the full year, the contrast is even sharper. The Nasdaq began the year at 19,309, representing a 14.34 % gain to date. The ASX 200 opened at 8,215, up 2.64 %. Bitcoin began 2025 at AUD $147,610, incurring a loss of 9.22 %. By comparison, gold moved from AUD $4,241 to AUD $6,315, a 48.9 % increase. And silver posted an even stronger result, climbing from AUD $46.68 to AUD $78.55, a 68.27 % rise.


In summary

In a world of fluctuating confidence and shifting capital, the differences between asset classes have never been clearer. Equities and cryptocurrencies remain exposed to growth expectations and liquidity cycles, while gold and silver continue to demonstrate their worth during times of uncertainty. For investors focused on both wealth preservation and strategic growth, precious metals remain the go-to asset class. While no asset rises in a straight line, the relative strength of gold and silver suggests that their secular bull markets are still in the early innings, and that now may be a smart time to strengthen your position.