Posted on

The AI IPO Wave: Boom or Bubble?

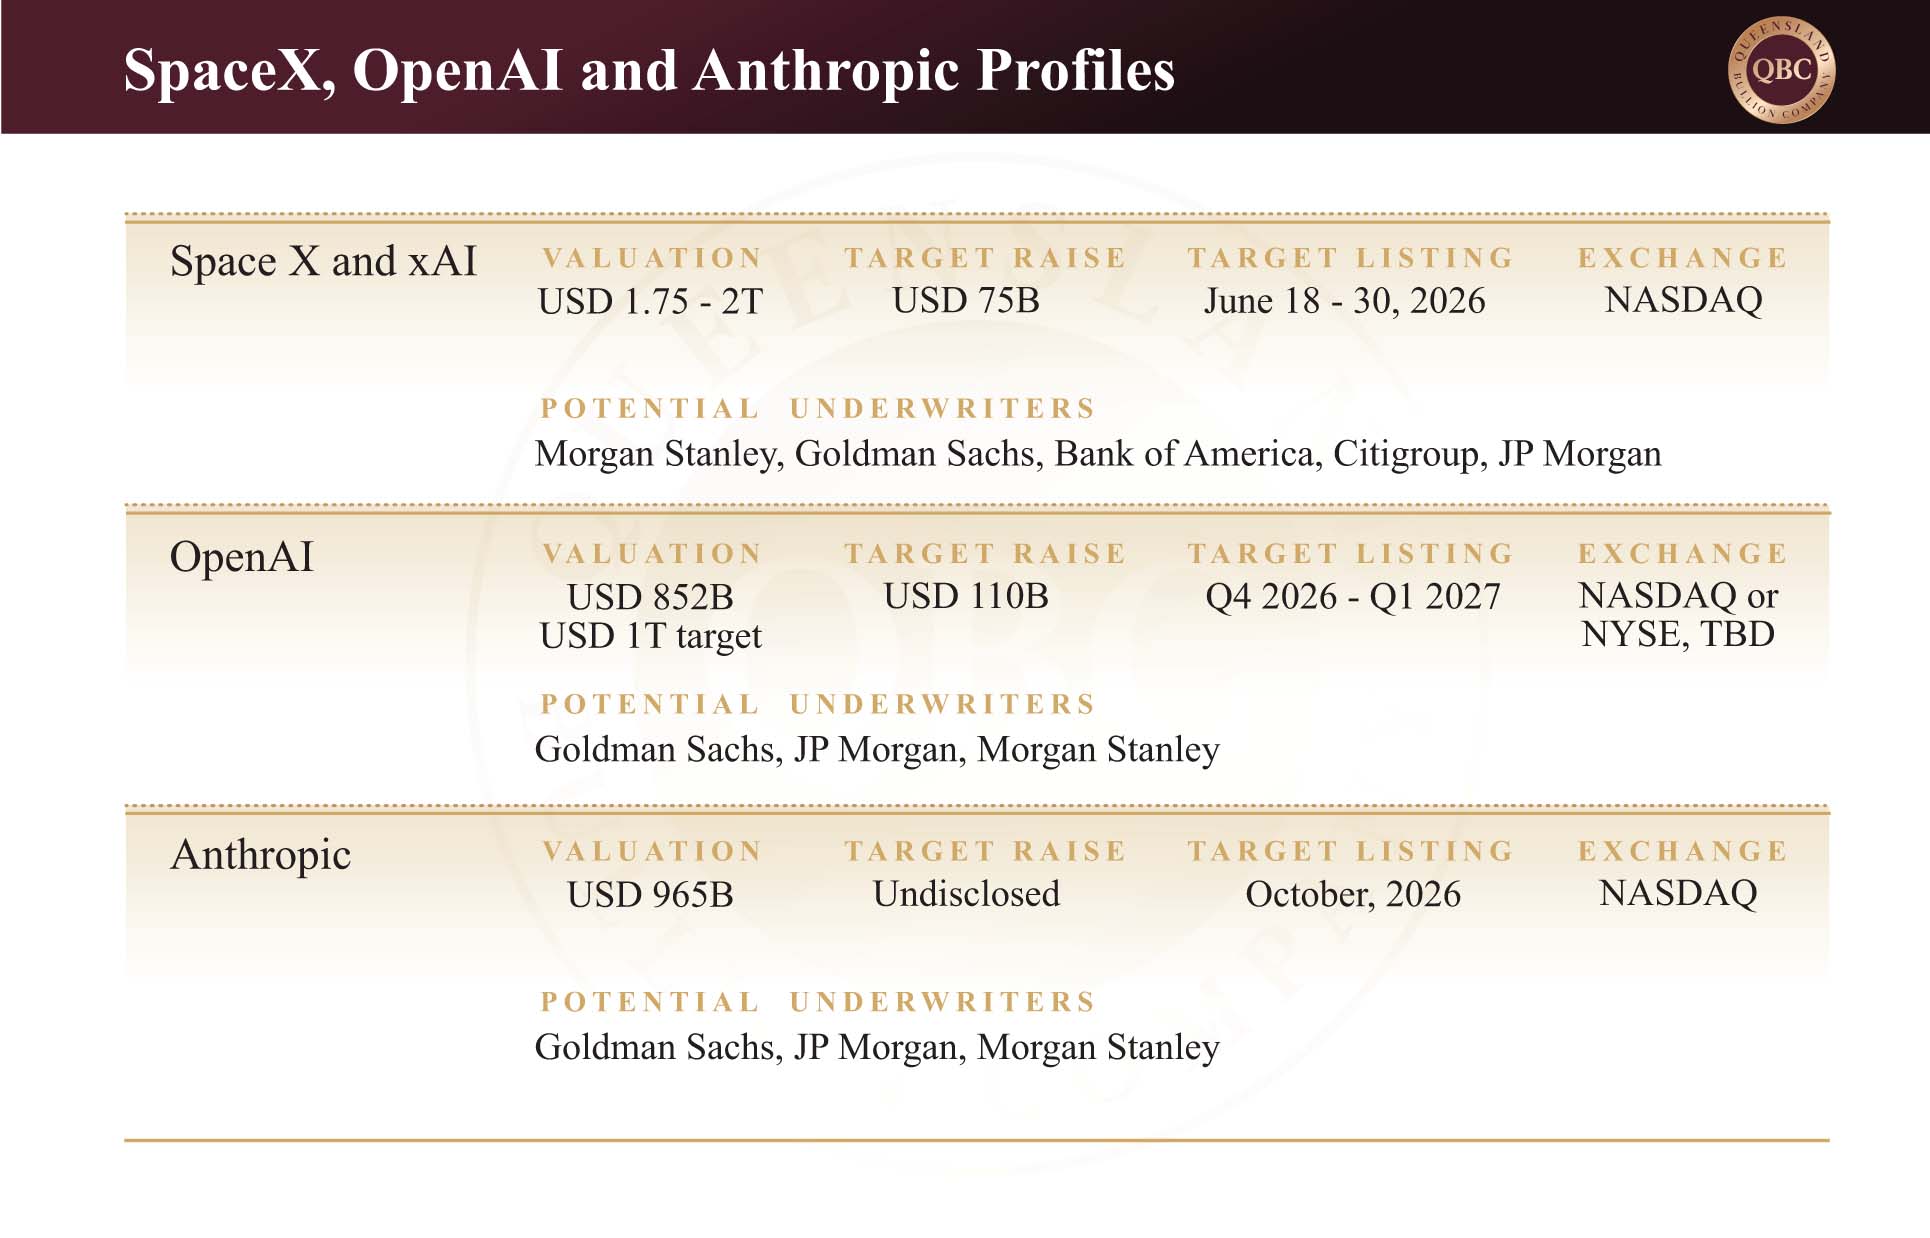
Financial markets appear poised for one of the largest concentrations of initial public offerings (IPOs) in modern history.  Over the coming months, three of the most prominent names in artificial intelligence and advanced technology, SpaceX, OpenAI and Anthropic, are expected to seek public listings with combined valuations approaching USD $4 trillion.  With Morgan Stanley, Goldman Sachs, Bank of America, Citigroup and JPMorgan as typical underwriters confidence is brimming.  At the time of writing, gold trades at approximately AUD $6,123 per ounce, silver at AUD $95, and platinum at AUD $2,496.  While precious metals have spent much of the year consolidating, equity markets continue to chase growth, particularly anything associated with artificial intelligence.

The question facing investors is whether these listings represent the next stage of technological innovation or the latest chapter in a speculative cycle that increasingly resembles previous market manias.  More importantly, what happens to broader financial markets when trillions of dollars of capital are required to fund a handful of highly anticipated public offerings?


Valuations reach extraordinary levels

While the companies themselves are undeniably influential, valuation remains a separate question.  Based on reported 2025 revenue of approximately USD $18.67 billion, SpaceX’s proposed valuation of USD $1.75 trillion implies a trailing price-to-revenue ratio of roughly 94 times, compared to Tesla at approximately 17 times revenue when it floated.  Supporters argue such comparisons struggle to account for businesses creating entirely new industries as SpaceX is expected to achieve.  Critics, however, point to the dot-com boom of the late 1990s when investors similarly argued conventional valuation methods no longer applied.  While many of those technologies ultimately transformed the world numerous share prices proved unsustainable.  The same debate now surrounds artificial intelligence: the technology may be revolutionary, but investors must still determine how much future growth has already been incorporated into current valuations.

A historically crowded IPO calendar

The scale of what is being proposed is difficult to overstate.  SpaceX is targeting a valuation of approximately USD $1.75 to $2 trillion.  OpenAI will pursue near USD $1 trillion, while Anthropic seeks a valuation exceeding USD $965 billion.  Combined, these three companies potentially represent around USD $3.7 to $4 trillion in market capital.  To place this into perspective, the entire Australian Securities Exchange (ASX) currently carries a market capitalisation of approximately AUD $3.2 trillion (or USD $2.28 trillion).  The implications are significant.

An initial public offering is the process by which a private company sells shares to public investors for the first time.  Of the 5% that SpaceX is selling, the company intends to reserve up to 30% of the offering for retail investors.  This is significantly above the industry norm of 5% to 10%.  The smaller than normal exposure to the wholesale market presents questions that only time will answer.


The liquidity question

Beyond valuation, another issue receives far less attention: liquidity.  Every dollar invested in an IPO must come from somewhere.  When multiple mega-capitalisation listings occur within a compressed timeframe they compete for the same pool of investment capital.

SpaceX alone is expected to sell approximately 555.6 million shares at around USD $135 per share to raise roughly USD $75 billion.  OpenAI and Anthropic could collectively seek hundreds of billions more as they transition into public ownership.  This creates an unusual dynamic.  Large allocations into new offerings can therefore drain liquidity from other areas of the market.  Investors seeking exposure to these listings may fund their participation by reducing positions in existing technology giants such as Apple, Microsoft, Alphabet, Amazon, Nvidia and Meta, and above all, Bitcoin.  Such a rotation could create heightened volatility across the broader technology sector as capital is redistributed toward a small number of highly anticipated IPOs.


 Dotcom Bubble Déjà Vue?

The closest historical comparison may be the dot-com boom of the late 1990s.  As internet adoption accelerated, investors poured capital into technology companies at an unprecedented rate, often placing growth potential ahead of profitability, cash flow and conventional valuation metrics.  The result was a speculative frenzy that drove the Nasdaq to a peak of 5,048 on 10 March 2000.  What followed was a sharp reversal.  By 4 October 2002, the index had fallen to 1,139, wiping out 76.81% of its value and destroying trillions of dollars in market capitalisation.  More importantly, the recovery was measured not in months but in decades.  The Nasdaq did not reclaim its previous high until April 2015, approximately fifteen years later.

Today, artificial intelligence is generating a similar level of enthusiasm, and the proposed IPOs are arriving into a market already willing to assign extraordinary valuations to future growth.  The 18.6-year Real Estate and Economic Cycle places this IPO wave at the height of broader market euphoria that typically occurs just before a significant economic downfall that could see 30% wiped off the stock market overnight.  Are we certain this will happen in the near future?  No.  But could the IPO event turn into one of the largest dotcom-esque “pump and dump” schemes in history?  Yes.  At this stage in the cycle, anything is possible.


Echoes of previous cycles

None of this means the AI revolution is not real.  Artificial intelligence is already reshaping software development, research, automation, customer service, healthcare and defence applications.  Unlike many speculative themes of previous decades, genuine revenue and commercial adoption exist today.  However, history demonstrates that transformative technologies and speculative excess often arrive together.  Railways transformed transportation.  Electrification transformed industry.  The internet transformed communication.  Yet each of those innovations was accompanied by periods where investor enthusiasm pushed valuations far beyond what fundamentals could justify.  The danger for investors is not necessarily choosing the wrong technology.  It is paying too much for the right technology.  That distinction becomes increasingly important when market participants begin valuing future possibilities rather than present realities.


What it means for precious metals

At first glance, the AI IPO boom appears unrelated to precious metals.  In practice, the connection is straightforward.  Periods of speculative enthusiasm typically attract capital away from defensive assets such as gold and silver.  Investors become willing to accept greater risk in pursuit of higher returns.  Money flows toward growth sectors, emerging technologies and momentum trades.  This dynamic can create temporary headwinds for precious metals; however, speculative cycles also tend to increase systemic risk over time.  Elevated valuations, concentrated capital flows and excessive leverage create vulnerabilities that often remain hidden during the boom phase.  When expectations eventually collide with reality, capital frequently rotates back toward defensive assets.  Gold and silver have performed this role repeatedly throughout history.

For precious metals investors, the key takeaway is that the broader macroeconomic backdrop has not changed.  Debt continues to rise, fiscal deficits continue to widen, and central banks remain trapped between inflation and economic growth.  Whether the AI boom ultimately becomes the next great technological success story or the next great market bubble, those longer-term fundamentals remain supportive of gold and silver.  As always, the challenge is distinguishing between excitement and value before the market does it for you.


Posted on

The Rise of Bond Yields

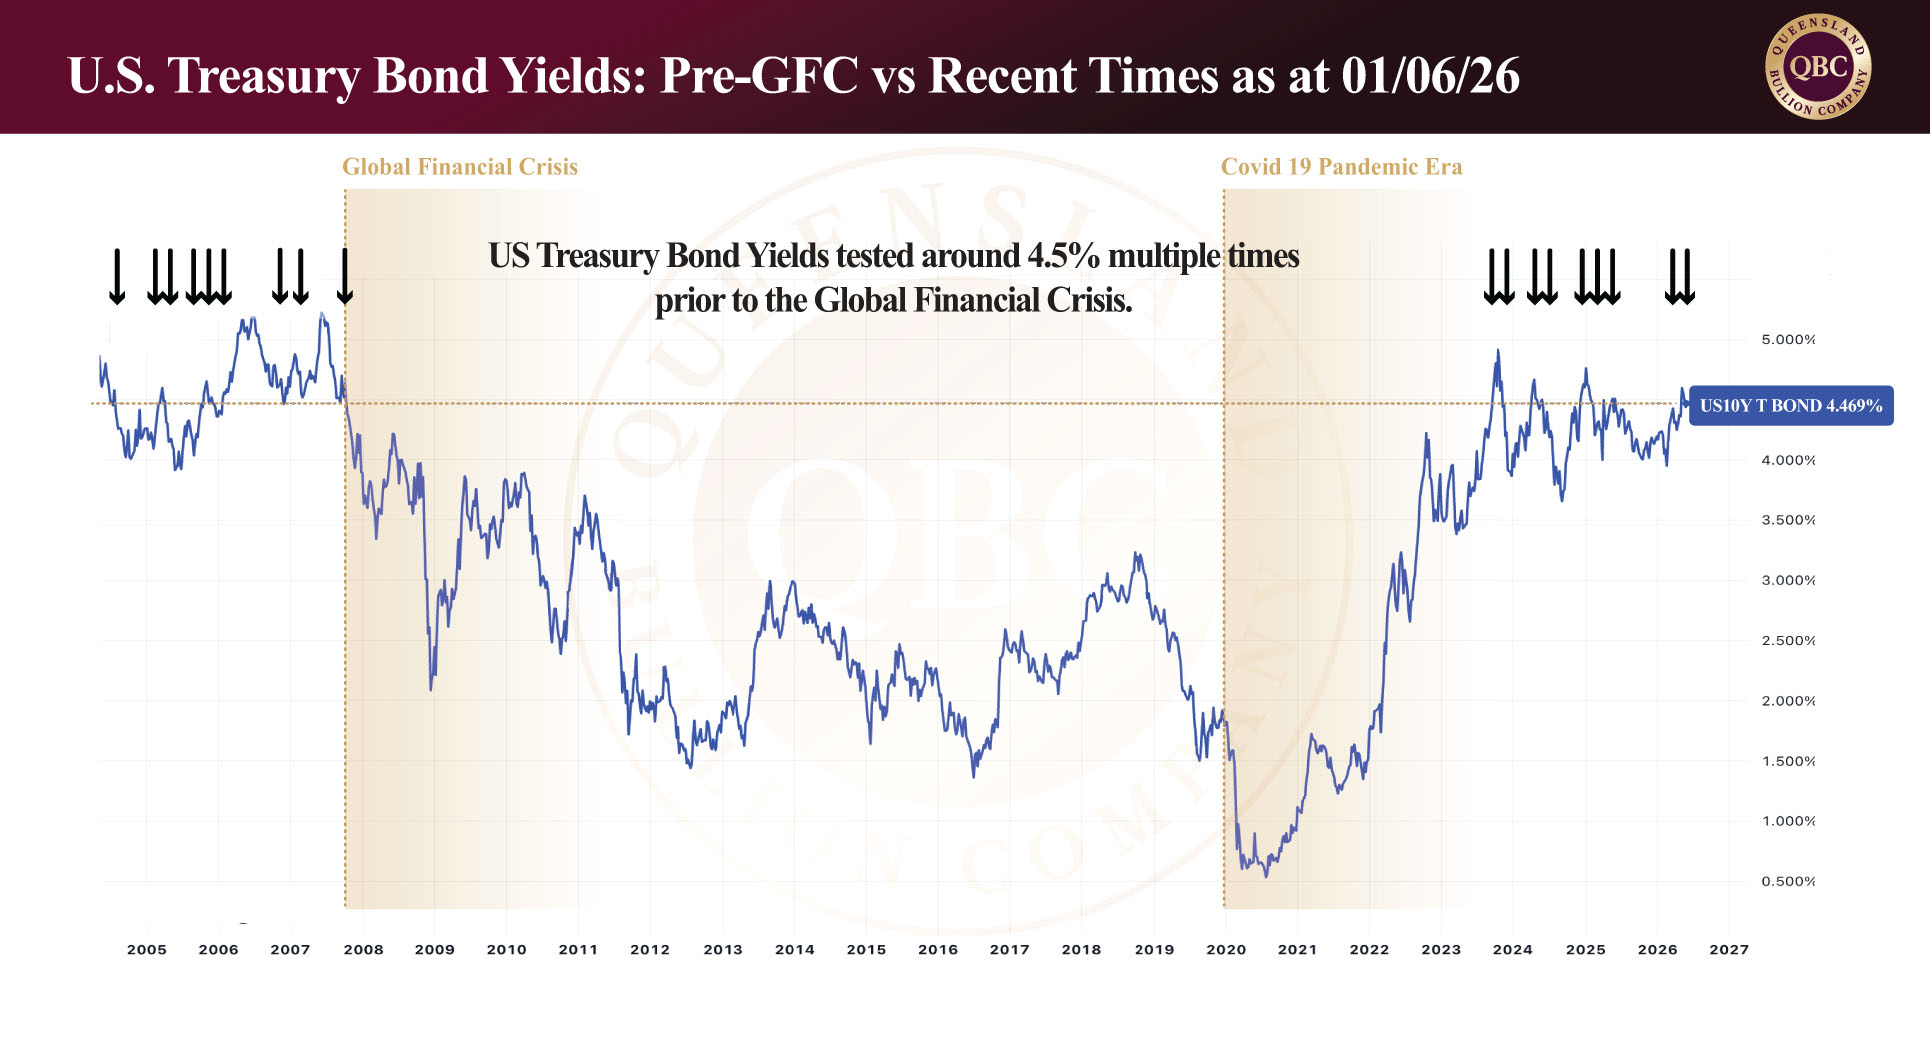
Financial markets are increasingly focused on one metric that quietly influences almost every asset class: the yield on U.S. Treasury bonds.  While equities, precious metals and cryptocurrencies often dominate headlines, Treasury yields arguably provide one of the clearest measures of investor confidence in the broader economy.  At the time of writing, gold trades at AUD $6,307 per ounce, silver at AUD $105.90, platinum at AUD $2,730, and the U.S. 10-year Treasury yield sits at approximately 4.46%.


While this marks the fourth occasion the 10-year yield has reached this level in the past three years, it has not sustained these levels consistently since October 2007, immediately preceding the Global Financial Crisis (GFC).  Interestingly, the period leading into the GFC displayed a similar pattern, with yields testing this level four times across a three-year period before broader financial stresses emerged.  While history does not repeat exactly, it often rhymes.  Understanding why yields are rising, and what investors are attempting to price into the market, provides valuable insight into the outlook for precious metals and financial markets more broadly.

Why are yields rising?

At its simplest, a bond yield is the return investors receive for lending money to a government.  When investors become concerned about inflation, fiscal sustainability, or future economic uncertainty, they demand a higher return to compensate for taking on additional risk.  The result is higher yields on newly issued bonds and lower bond prices in secondary markets.

The United States provides no shortage of reasons for concern.  According to the U.S. Treasury, national debt has reached approximately USD $39 trillion while the country currently runs an unsustainable 7% account deficit.  The debt-to-GDP ratio now sits at roughly 100.2%, the first time it has exceeded 100% since World War II.  For the 2026 financial year, federal interest payments alone are expected to reach approximately USD $1.039 trillion, while the annual budget deficit remains around USD $2.5 trillion.  The Congressional Budget Office projects debt could climb to 175% of GDP by 2056 if current trends continue.  The United States now spends 50% of its annual tax revenue on making interest-only payments towards its debt.  The scale of borrowing is difficult to comprehend.  U.S. debt is currently increasing by approximately USD $55 to 88 billion every day.  As more debt is issued larger volumes of Treasury bonds must be absorbed by the market, increasing supply and placing upward pressure on yields.

Viewed through a business lens, the explanation becomes relatively straightforward.  When a company takes on increasing amounts of debt without a corresponding improvement in its financial position, lenders demand a higher rate of return to compensate for the growing risk.  Governments are no different.  While the United States remains the world’s largest economy and the issuer of the global reserve currency, investors are increasingly scrutinising its fiscal trajectory.  Rising debt levels, persistent deficits, and rapidly growing interest expenses are prompting bond markets to demand greater compensation for lending money to the U.S. government.


When higher yields are not good news

What makes the current environment particularly interesting is that the apparent strength in bond yields may actually be signalling a deeper weakness in the underlying currency itself.  Throughout history, governments confronted with excessive debt burdens have ultimately resorted to some form of currency debasement to ease the pressure.  The 1970s provide a useful example.  During that decade, the U.S. dollar lost roughly half its purchasing power while gold rose from USD $35 to USD $850 per ounce.  Importantly, that move was not a straight line.  Sharp corrections and periods of investor pessimism repeatedly interrupted the broader trend before gold ultimately reached new highs.  Today, many investors remain focused on the attraction of higher bond yields, yet those yields exist partly because markets are demanding greater compensation for fiscal and monetary risks.  In that sense, rising yields and rising gold prices need not be opposing forces over the longer term.  Both can be interpreted as different market responses to the same underlying concern: preserving purchasing power in an increasingly debt-laden financial system.


The inflation problem

Rising debt would be less concerning if economic growth was strong and inflation remained contained.  However, investors are now attempting to price multiple risks simultaneously.  The ongoing disruption to global energy markets, particularly surrounding the Strait of Hormuz, has pushed oil prices materially higher causing fundamental supply and demand issues.  Higher energy costs eventually filter through transport, manufacturing, agriculture and consumer goods, creating a flow-on effect of inflationary pressure throughout the economy.

This places central banks in a difficult position.  If inflation remains elevated, policymakers may be forced to keep interest rates higher for longer.  If they lower rates too quickly, inflation risks accelerating once again.


What does this mean for gold and silver?

Traditionally, rising bond yields can create short-term headwinds for gold because Treasury bonds begin offering more attractive income streams.  Investors comparing a non-yielding asset such as gold against a government bond yielding close to 5% may favour the bond initially; however, yields alone do not tell the whole story.  The more important measure is the real yield, being the difference between bond yields and inflation.  If inflation continues rising faster than yields, investors still lose purchasing power despite earning interest.  This is the point where gold often begins outperforming.

History shows that precious metals tend to struggle during the early stages of rising yields but perform strongly when markets begin questioning whether governments can realistically control debt and inflation simultaneously.  The current environment is increasingly moving in that direction.


In summary

Rising bond yields are not occurring in isolation.  They reflect growing concerns surrounding inflation, government borrowing, fiscal sustainability and the long-term health of the global financial system.  With U.S. debt approaching USD $39 trillion, annual deficits more than USD $2 trillion, and interest costs exceeding USD $1 trillion per year, yields on Treasuries are bound to increase.

In the short term, higher yields may continue to compete with gold and silver for investment capital.  However, if inflation persists and debt continues expanding at its current pace, the market may eventually reach a point where bond yields can no longer adequately compensate for the loss of purchasing power.  Historically, that is when precious metals become increasingly attractive.  Rising yields may appear bearish for gold today, but they may ultimately be signalling the very conditions that support higher precious metals prices tomorrow.

Posted on

Oil’s Shrinking Buffer

Global oil markets are entering increasingly dangerous territory as the 2026 U.S-Isreal-Iran War continues to disrupt flows through the Persian Gulf.  What initially appeared to be a temporary supply shock is now evolving into a deeper structural problem: the world is rapidly burning through the inventories that normally protect against severe shortages and price spikes.  At the time of writing, gold trades at approximately AUD $6,342 per ounce, silver at AUD $107.31 and platinum at AUD $2,745, while oil markets remain under sustained pressure.

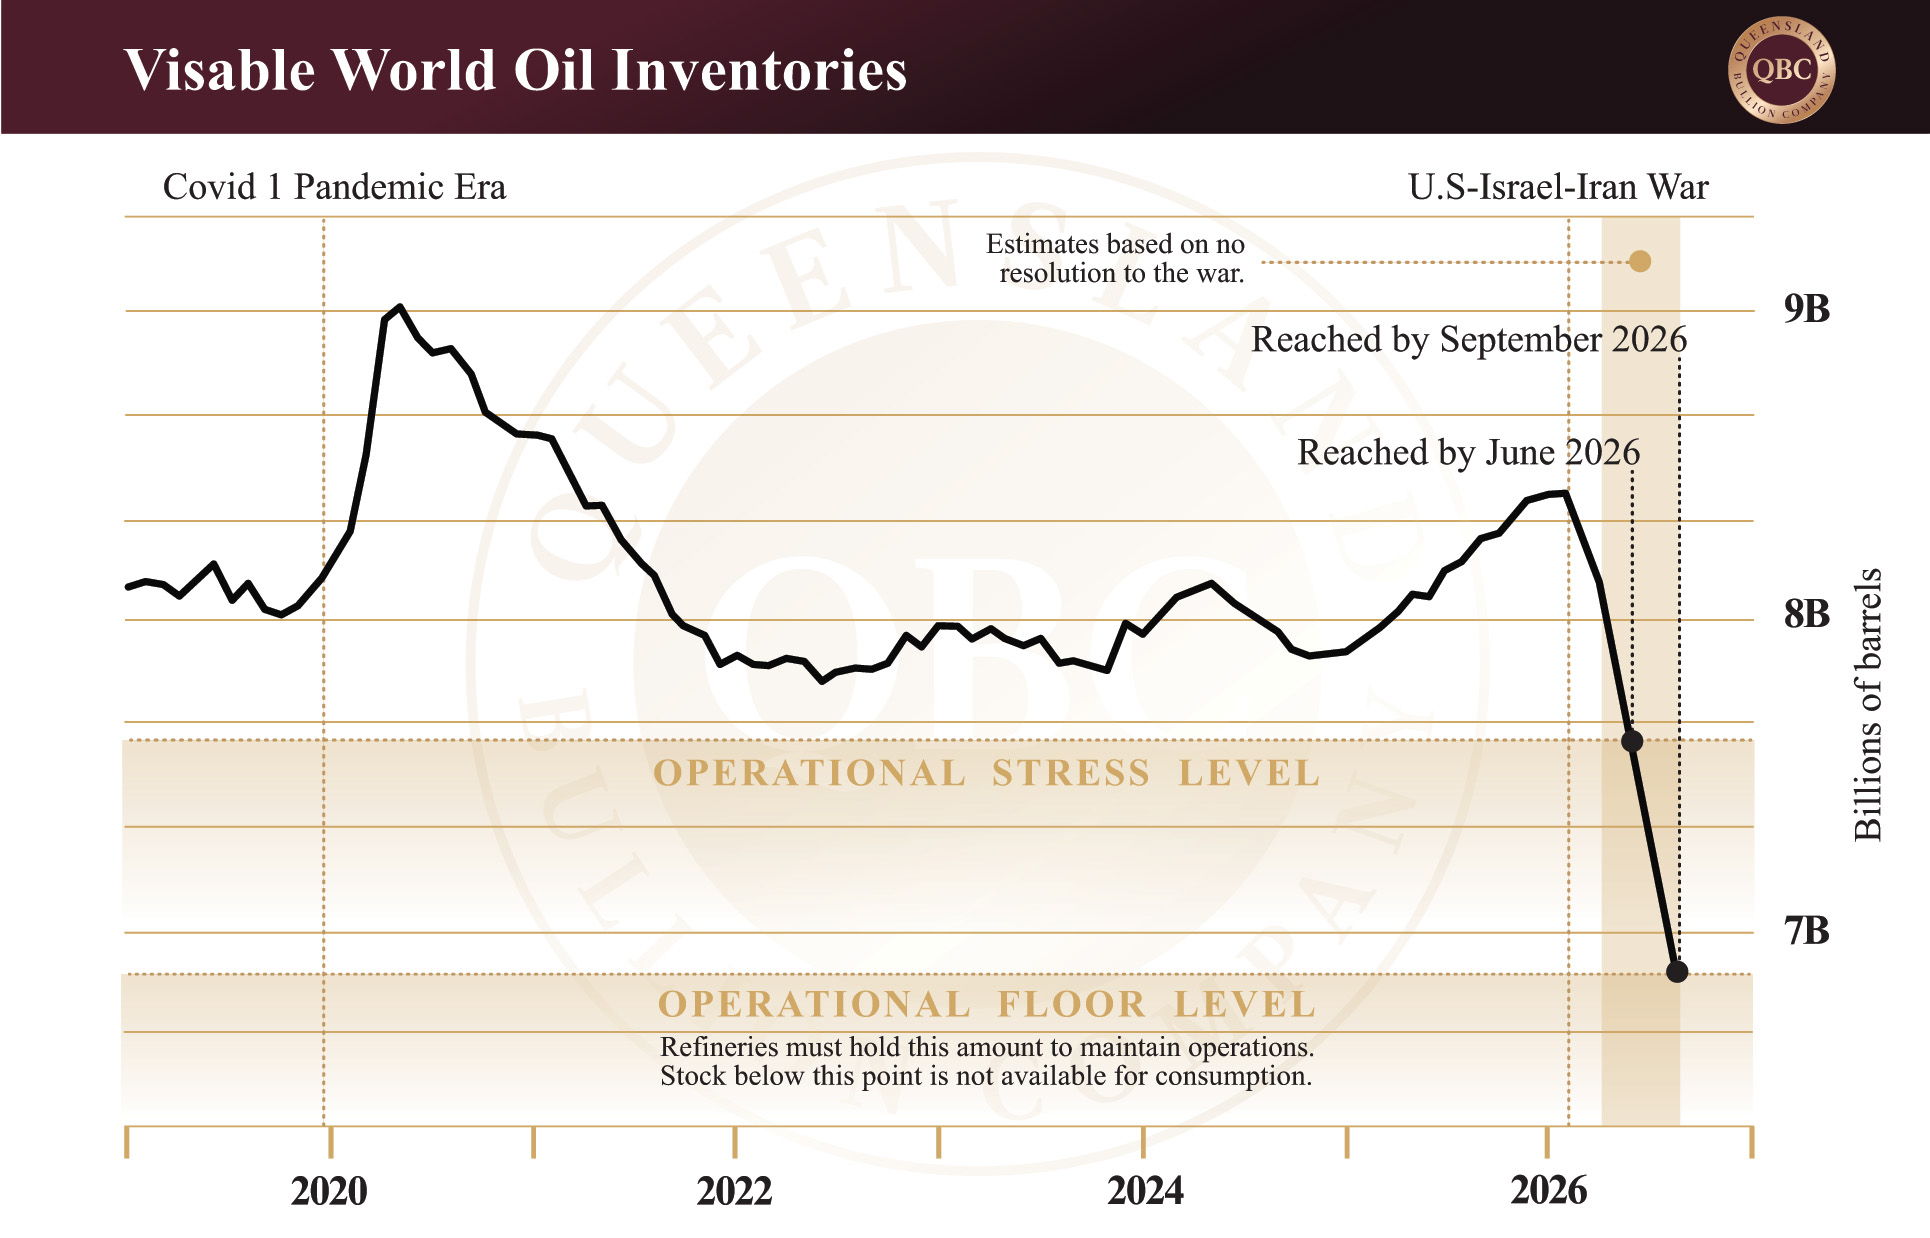
Since the Strait of Hormuz has moved toward near closure, the global oil system has been forced to rely heavily on stored reserves to maintain supply.  These inventories act as the shock absorber of the global energy market and cushions disruptions when production or shipping becomes impaired.  The problem is that the buffer is now being depleted at record speed.  Morgan Stanley estimates global oil inventories fell by approximately 4.8 million barrels per day between March 1 and April 25, well beyond any previous quarterly drawdown recorded by the International Energy Agency.  Crude oil accounted for almost 60% of the decline, with refined fuels making up the balance.  This is not a minor adjustment in supply chains; it is a historically significant depletion of emergency capacity across the global energy system.  So far, supply loss from Gulf producers exceed more than one billion barrels.


The operational minimum

Importantly, oil inventories do not need to reach zero before markets break down.  Energy systems require a minimum amount of crude and refined fuel simply to continue functioning.  Pipelines, export terminals, refineries and storage infrastructure all rely on what analysts call an “operational minimum.”  JPMorgan has warned that inventories of the Organisation for Economic Co-operation and Development (OECD) could reach “operational stress levels” as early as next month if the Strait of Hormuz remains restricted, with “operational minimum” conditions potentially emerging by September.  Indeed OECD countries have seen the sharpest declines in oil inventories at 146 million barrels, versus non-OECD countries seeing a drop of 24 million barrels.

This distinction matters.  Markets can tolerate falling inventories for a period of time, but once operational minimums are approached the system becomes highly unstable.  At that point, even small disruptions can create outsized price reactions because there is no longer enough spare supply available to absorb shocks.  While Goldman Sachs notes the pace of drawdowns may have slowed slightly due to weaker Chinese demand, global visible oil inventories are already near their lowest levels since 2018.  The world is no longer operating with a comfortable surplus.


The state of liquid fuel in Australia

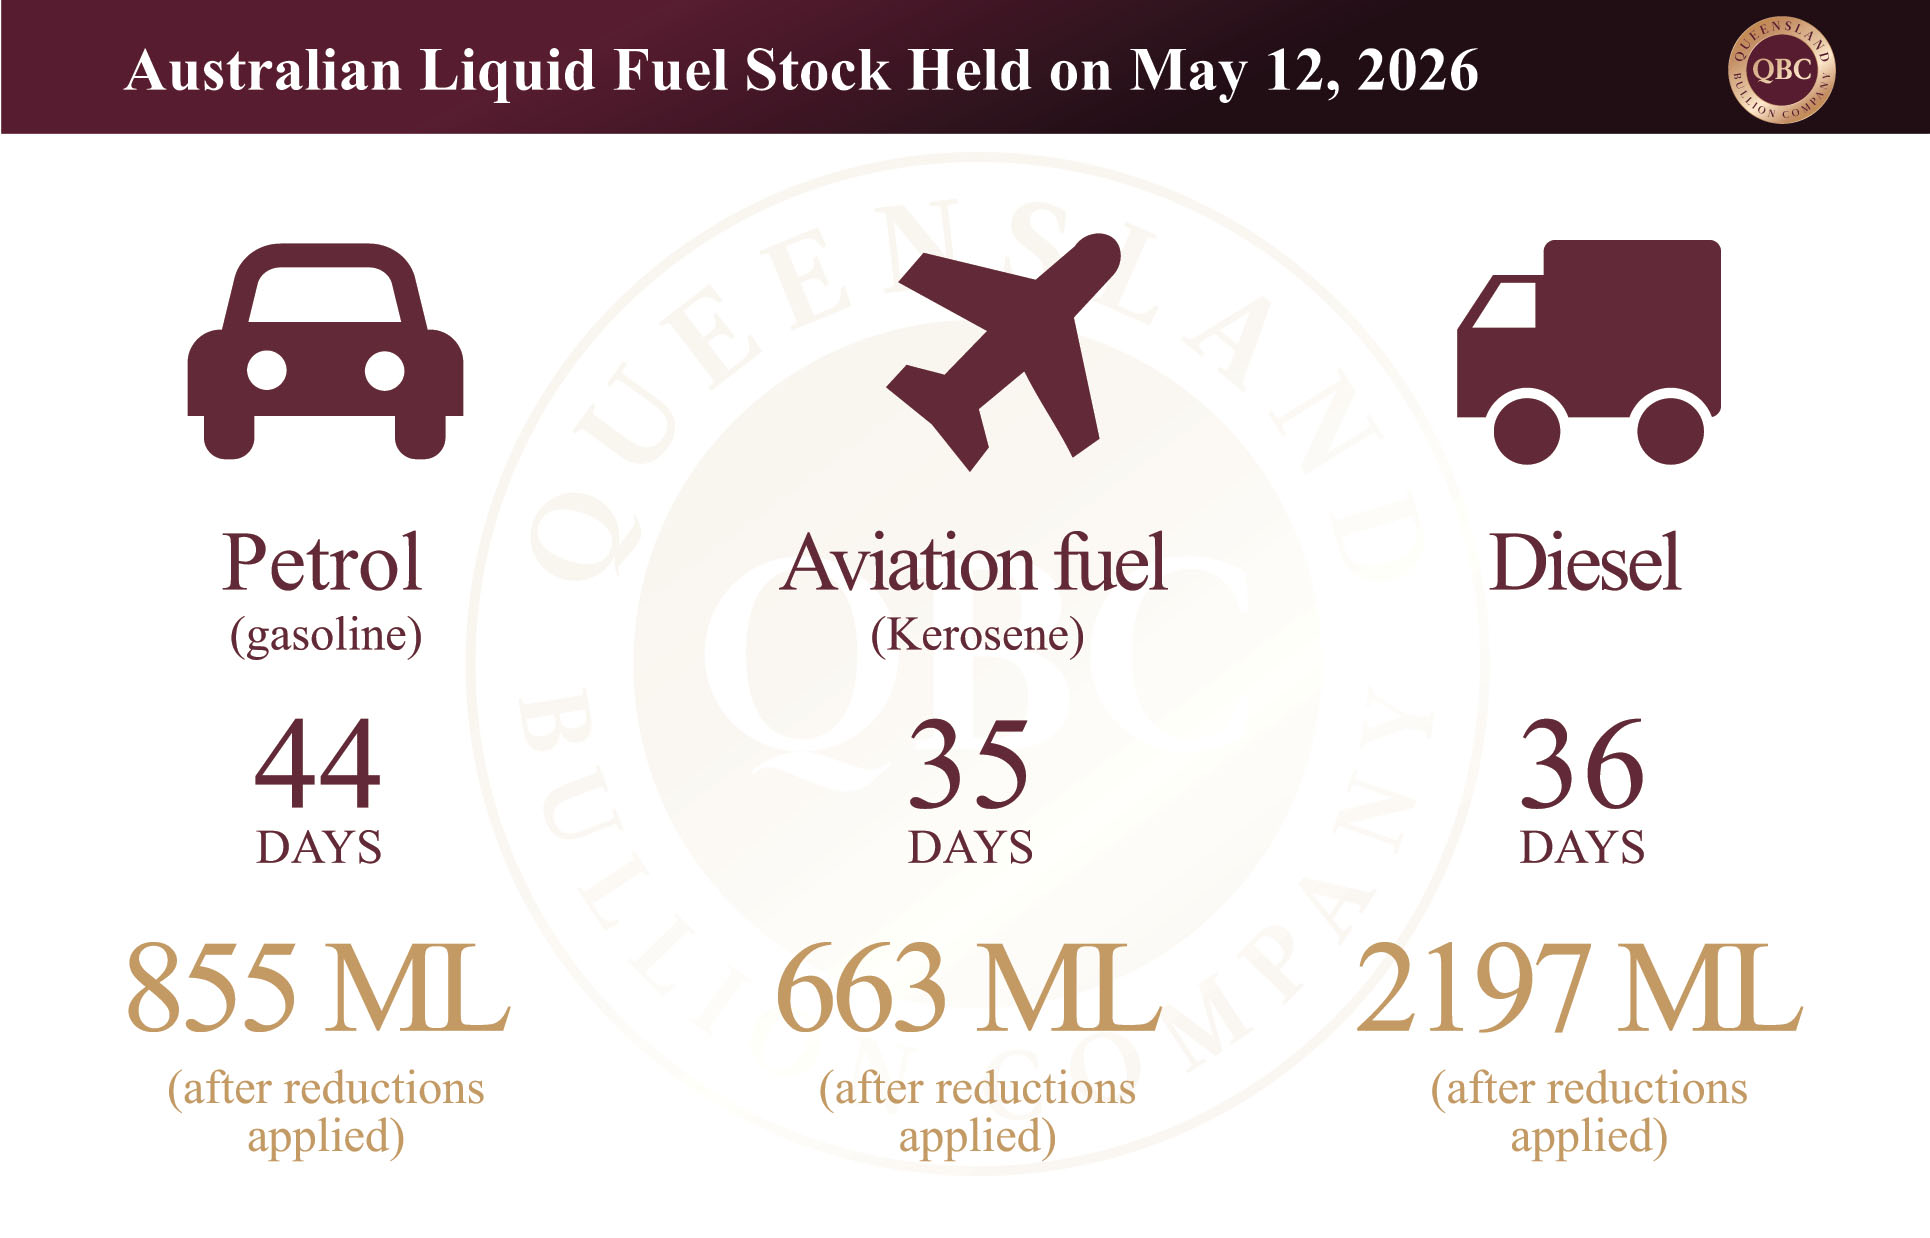
Although Australia’s fuel inventories remain above mandated minimum levels, recent data highlights just how reliant the country remains on uninterrupted global supply chains.  During the 2024–25 financial year, diesel stockpiles averaged 2,968 megalitres (ML), compared with a required minimum of 2,485 ML, leaving a buffer of approximately 19% above the government’s Minimum Stockholding Obligation (MSO).  Petrol (gasoline) inventories averaged 1,743 ML against a required 1,070 ML, or 63% above minimum levels; while aviation fuel stocks averaged 799 ML compared with a required 581 ML, roughly 38% above mandated requirements.

However, more recent figures as at May 12 this year suggest those buffers are tightening materially.  Diesel inventories have fallen to 2,905 ML against a minimum requirement of 2,742 ML, leaving stock only 6% above mandated levels.  Petrol inventories currently sit at 1,631 ML versus a required 1,067 ML, while aviation fuel inventories stand at 790 ML against a minimum 663 ML, reducing the surplus to approximately 19%.  The decline in diesel reserves is particularly significant because diesel underpins freight transport, mining, agriculture and much of Australia’s industrial economy.  Officially, Australia holds the equivalent of around 36 days of diesel consumption, 44 days of petrol, and 35 days of aviation fuel under normal conditions, hence the country remains heavily dependent on imported refined fuel and vulnerable to disruptions across major shipping routes and energy corridors such as the Strait of Hormuz.

Asia faces the greatest risk

The immediate pressure points are emerging in import-reliant Asian economies.  Energy traders are increasingly highlighting Indonesia, Vietnam, Pakistan and the Philippines as the countries most vulnerable to critical shortages, with some estimates suggesting fuel supplies could reach dangerous levels within a month if disruptions continue.  Europe is also beginning to feel strain, particularly in jet fuel markets heading into the summer travel season.

The United States, despite becoming the world’s supplier of last resort, is facing its own inventory problems.  U.S. crude stockpiles, including the Strategic Petroleum Reserve, have declined for four consecutive weeks.  Refined petroleum products such as diesel and jet fuel recently fell to their lowest levels since 2005, while petrol (gasoline) inventories remain near their weakest seasonal levels since 2014.  The United States itself has only deployed around 79.7 million barrels of the 172 million barrels it pledged to release, partly because policymakers are attempting to balance short-term supply needs against the longer-term risk of exhausting strategic reserves.  If the full release proceeds, U.S. reserves would fall to their lowest level since 1982.

Governments are attempting to stabilise the market through strategic reserve releases.  The International Energy Agency has already coordinated the release of a record 400 million barrels from emergency stockpiles.  Yet even this creates a dilemma: every barrel released today further reduces the future buffer available if the conflict worsens.


Why oil prices could still move higher

At first glance, higher prices should solve the problem by reducing demand.  To some extent this is already occurring.  Global oil consumption has softened as elevated prices and supply disruptions begin constraining economic activity.  However, analysts increasingly warn that demand destruction may not yet be sufficient to rebalance the market.  Oil import-dependent countries could face critical shortages through the June-July period.  And petrol shortages across parts of Asia could emerge rapidly if the Strait of Hormuz remains constrained into June.

This is the key point: inventories are falling faster than demand.  As long as that imbalance persists, prices remain vulnerable to another leg higher.  And even if the waterway reopens, the problem does not disappear immediately.  Governments and companies will eventually need to rebuild depleted stockpiles, creating an entirely new layer of future demand.  Demand will rise above pre-war levels as nations attempt to restore energy security buffers.  In other words, the consequences of the conflict may continue influencing oil markets long after the fighting subsides.


Inflation and the economic cycle 

The economic implications of sustained higher oil prices are significant.  Oil sits near the centre of the global economy.  When energy prices rise sharply, transportation, manufacturing, agriculture and retail costs all increase alongside it.  This feeds directly into inflation.

During this stage, gold prices can soften despite geopolitical instability because higher inflation expectations also push bond yields upward.  This temporarily makes fixed-income assets (bonds) more attractive relative to non-yielding gold.  This explains why precious metals do not always rally immediately during geopolitical crises.  However, this relationship changes once inflation begins outpacing bond yields.  At that point, real returns on bonds deteriorate because investors lose purchasing power after accounting for inflation.  Historically, this is the moment when gold tends to reassert itself as the preferred safe haven asset.

The sequence is often straightforward:

Oil prices rise.  The cost of goods rises.  Consumer spending contracts.  Economic growth slows.  Demand eventually weakens enough to pressure oil prices lower again.

But before that balancing process occurs, inflation can become highly disruptive to financial markets.


Precious metals and the next phase

As long as the oil crisis persists, precious metals prices may continue to experience periods of softness despite the broader geopolitical instability.  Rising oil prices feed directly into inflation, which in turn support Treasury yields and strengthen the U.S. dollar in the short term.  During this phase, capital often rotates toward yield-bearing safe havens such as government bonds rather than non-yielding assets like gold.  This partially explains why precious metals have not responded as aggressively to the conflict as many initially expected.

However, this dynamic rarely lasts indefinitely.  History shows that prolonged energy shocks eventually begin placing unsustainable pressure on the broader economy.  Higher fuel costs filter through transportation, manufacturing, food production and consumer goods, steadily eroding purchasing power and slowing economic activity.  At a certain point, inflation begins rising faster than bond yields can compensate and the market narrative shifts. What initially favoured bonds and cash transitions into a search for assets capable of preserving purchasing power in real terms and discounted assets as a result of the downturn.  That is typically the point where precious metals begin outperforming more decisively.

In that sense, the current environment may ultimately prove to be the calm before the storm.  The market is still attempting to absorb the inflationary consequences of higher oil prices while assuming the disruption remains temporary.  But if inventories continue tightening, inflation persists, and economic stress deepens, the balance between bonds, currencies and precious metals is likely to shift once again.  Historically, it is during these later-stage inflationary periods that gold and silver tend to emerge as the preferred safe haven assets.

Posted on

Budget Pressures and Precious Metals

Global markets continue to operate under mounting fiscal and structural pressure, and Australia’s 2026–27 Federal Budget has added another layer to that uncertainty. While framed around housing affordability, cost-of-living relief and economic resilience, the broader implications extend well beyond day-to-day politics. At the time of writing, gold trades at approximately AUD $6,384 per ounce, silver at AUD $109.71 and platinum at AUD $2,801.

Importantly, the budget is not directly bullish for precious metals because of any explicit policy toward bullion.  Rather, it is the broader macroeconomic consequences that matter most.  Expanding deficits, rising debt burdens, inflationary spending pressures, and property tax reforms all contribute to an environment in which investors increasingly reassess how and where they preserve wealth.


Structural Deficits and Rising Debt

 Despite Treasury highlighting improvements in the budget position, Australia’s debt trajectory continues upward with gross federal debt already exceeding AUD $1 trillion.  Large spending commitments across healthcare, defence, housing, energy transition initiatives and cost-of-living support ensure ongoing deficits and increased borrowing.  Persistent deficits matter because they require continued bond issuance and reinforce concerns surrounding fiat currency purchasing power and long-term fiscal sustainability.  The broader concern is not simply the size of the debt itself, but the growing dependency on debt-funded growth.  Governments globally are increasingly relying on fiscal stimulus to support slowing economies, maintain employment and offset weakening private-sector activity. Over time, that creates pressure on currencies, interest rates and inflation expectations simultaneously.

Historically, these conditions have supported hard assets such as gold.  This does not necessarily imply an immediate surge in precious metal prices.  However, it strengthens the longer-term case for monetary metals as investors increasingly seek assets outside the traditional debt-based financial system.


Property Reforms and Capital Rotation

 One of the most significant components of the budget was the proposed restructuring of investment taxation, particularly changes to the Capital Gains Tax (CGT) discount and negative gearing.  Under the announced measures, from 1 July 2027 the 50% CGT discount for assets held longer than 12 months would be replaced with a cost-base indexation model alongside a new 30% minimum tax rate on real capital gains.  Negative gearing deductions would also become largely restricted to new residential builds.

While the measures remain proposed rather than legislated, they are already influencing investor sentiment.  Australian investors have historically concentrated heavily in residential property due to favourable tax treatment and leverage accessibility.  If leveraged property becomes materially less tax-efficient, capital will inevitably begin searching for alternative stores of value.  This matters because the Australian bullion market remains comparatively small relative to property and equities. Even a modest reallocation toward physical gold and silver could materially affect retail demand.

Survey data already points toward changing investor behaviour.  A recent survey found that 61% of property investors would reduce exposure to the market if both the CGT and negative gearing reforms proceed.  Industry modelling also suggests the combined reforms could reduce dwelling starts by tens of thousands of homes while simultaneously increasing rental pressures;

However, with average weekly rents already exceeding $700 in Brisbane, Darwin, Canberra and Perth, and approximately $800 in Sydney, the property market is more likely to gradually soften in line with broader economic cycles.


Inflation Pressures Remain Sticky 

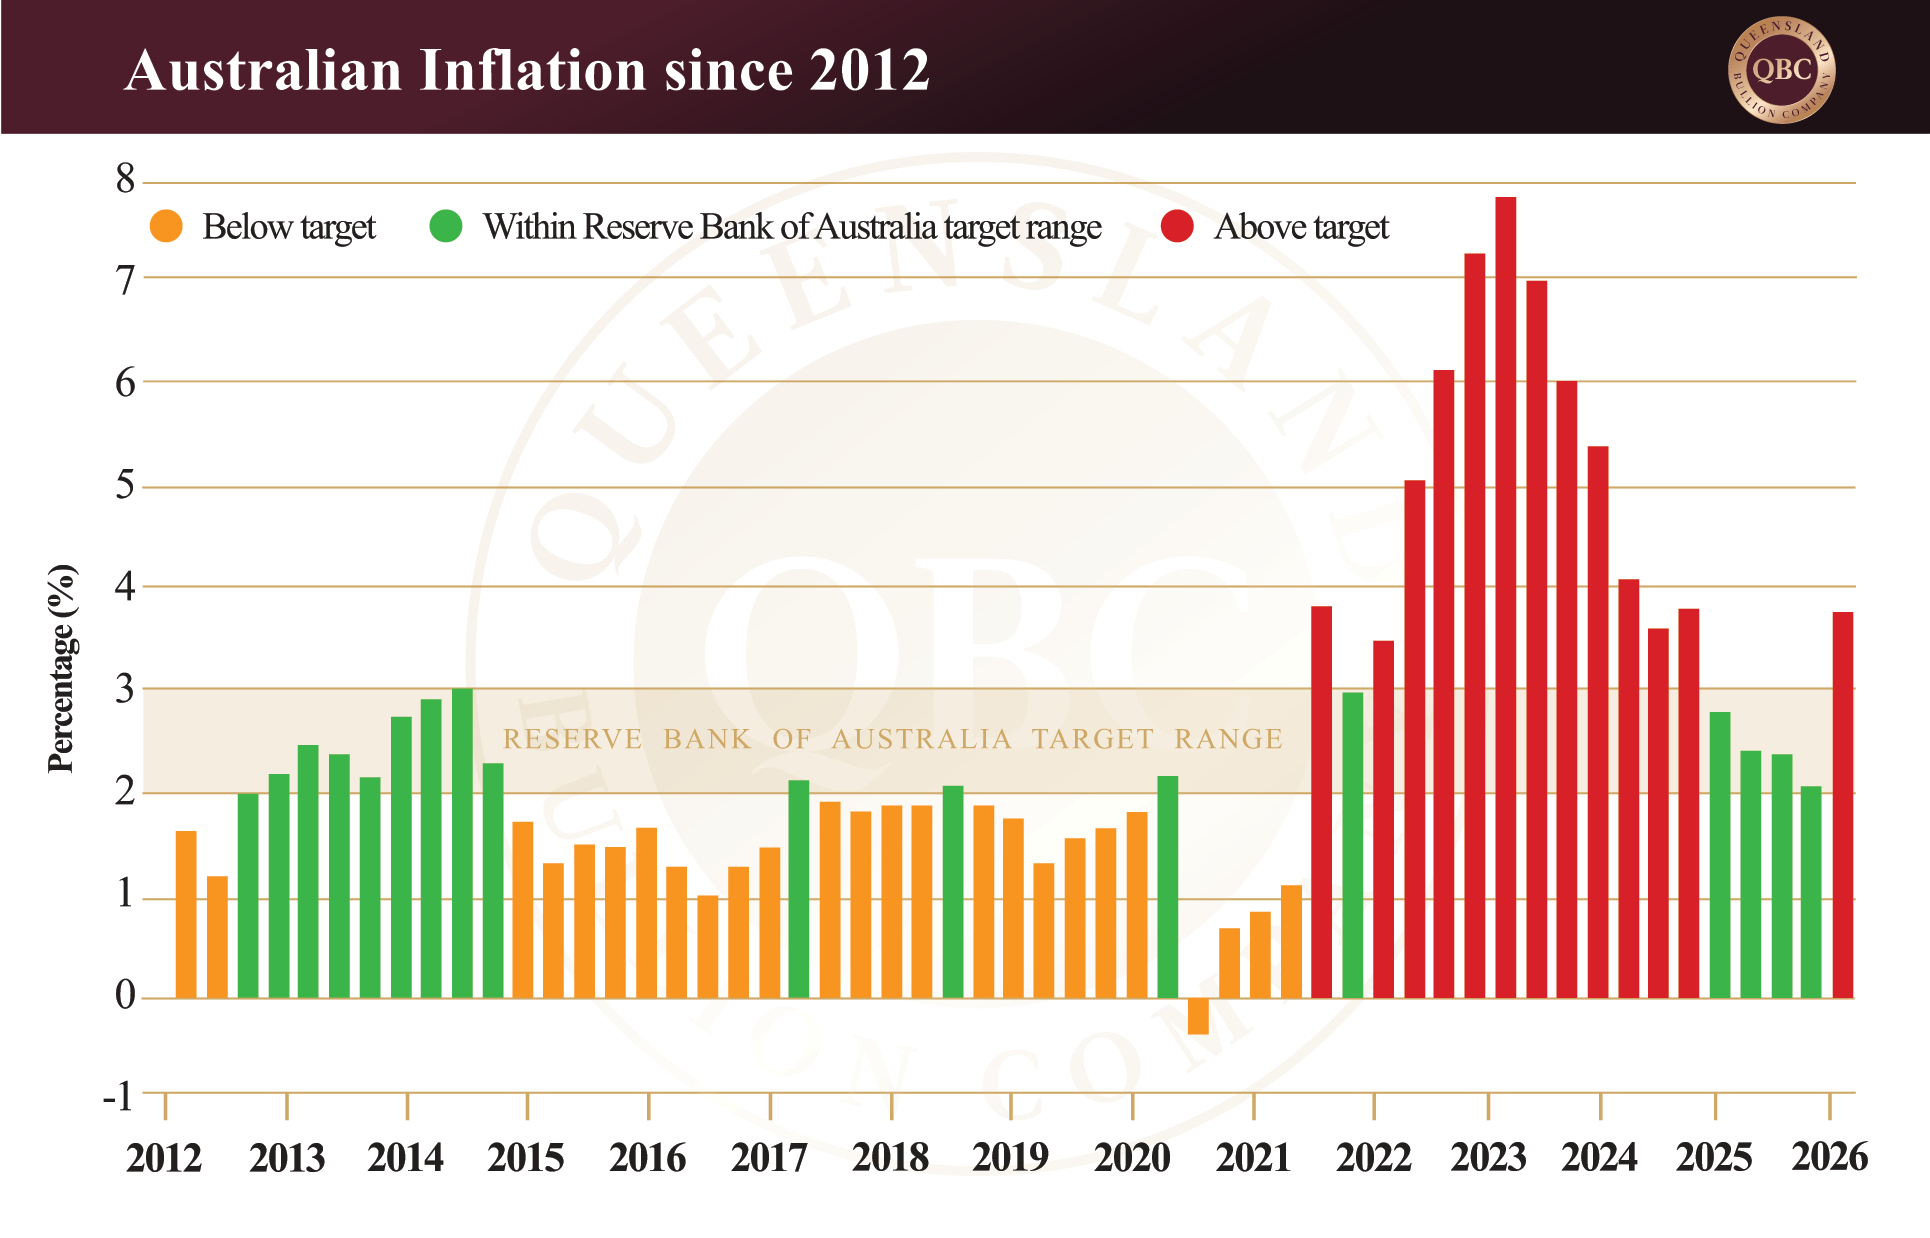
Another important implication of the budget is the ongoing risk of persistent inflation.  Large-scale fiscal spending supports aggregate demand and can keep inflation elevated for longer than central banks would prefer.  While inflation has moderated from the 7.8% peak reached in 2022, at 3.72% it remains above the traditional 2–3% target range.  If inflation remains sticky, policymakers may be forced to maintain higher interest rates for longer.  Alternatively, if economic conditions weaken materially while inflation remains elevated, central banks may eventually be pressured toward lower rates despite inflation risks.  This is where real interest rates become critical.

Gold is influenced less by nominal rates themselves and more by real yields; that is, interest rates after inflation is taken into account.  If inflation remains higher than bond yields, investors effectively lose purchasing power holding cash or fixed-income assets. Under those conditions, gold often becomes increasingly attractive because it preserves purchasing power over long periods.

Silver behaves somewhat differently because it carries both monetary and industrial demand characteristics.  During later-stage inflationary cycles, silver can outperform gold as speculative capital enters the market alongside manufacturing demand linked to electrification and industrial production.

Trusts and Investment Structures

Beyond property itself, the budget also introduced proposed changes affecting discretionary trusts and broader investment structures.  From 1 July 2028, income distributed through discretionary trusts would become subject to a minimum 30% tax rate under the announced measures.  Questions also remain surrounding how the new CGT framework may interact with managed investment structures and indirectly held assets.  Importantly, superannuation funds currently appear largely excluded from many of the proposed changes based on Treasury commentary so far.  This may incentivise investors to increase precious metal holdings via self-managed superfunds as opposed to discretionary trusts.

Additionally, physical bullion occupies a unique position because it carries no counterparty risk.  Unlike leveraged property investments, equities or managed funds, physical gold and silver are not dependent on the solvency of financial institutions or the performance of broader credit markets.


In Summary

The 2026–27 Federal Budget is not directly a “bullish bullion” policy package; however, the broader economic consequences of the measures announced are generally supportive for precious metals over the medium to long term.  For decades, Australian wealth has concentrated heavily in leveraged property, equities and banking assets.  But as taxation settings shift and fiscal pressures intensify, capital may gradually begin rotating toward alternative stores of value.

At the same time, the broader macroeconomic backdrop continues to favour hard assets.  Real interest rates remain under pressure, sovereign debt continues expanding globally, and geopolitical fragmentation is becoming increasingly embedded within the international financial system.  While short-term price movements will continue to fluctuate alongside economic data and geopolitical events, the longer-term structural drivers supporting precious metals remain firmly intact.

Posted on

The Cost of War: Who Pays and What Comes Next

War is often measured in headlines and territory, but its true cost runs far deeper, both visible and hidden.  As the U.S.-Israel-Iran war in the Middle East extends into another phase, the financial burden is beginning to surface across multiple layers of the global economy.  At the time of writing, gold trades at approximately $6,560 per ounce, silver near $105.29, and platinum around $2,771.  While these figures reflect recent volatility, they also sit within a broader framework shaped by rising geopolitical tension, escalating defence spending, and shifting capital flows.  To understand where precious metals move next, it is essential to first understand the real cost of war, who bears it, and how those costs ripple through the global system.


A modern war machine under strain

Recent developments highlight just how quickly modern conflicts consume resources.  Independent discussions between major U.S. automakers Ford, General Motors and Pentagon officials signal a potential return to wartime industrial mobilisation where civilian factories pivot to produce weapon components, reminiscent of the “Arsenal of Democracy” seen during both World Wars.  The fact that civilian manufacturing may need to supplement defence production underscores a key issue: existing military supply chains are already under strain.  Fighting has been intense with Iran proving to be a significant foe.  According to figures released by Gulf authorities earlier this week, one country faced 165 ballistic missiles and more than 500 drones in the first days of the war.

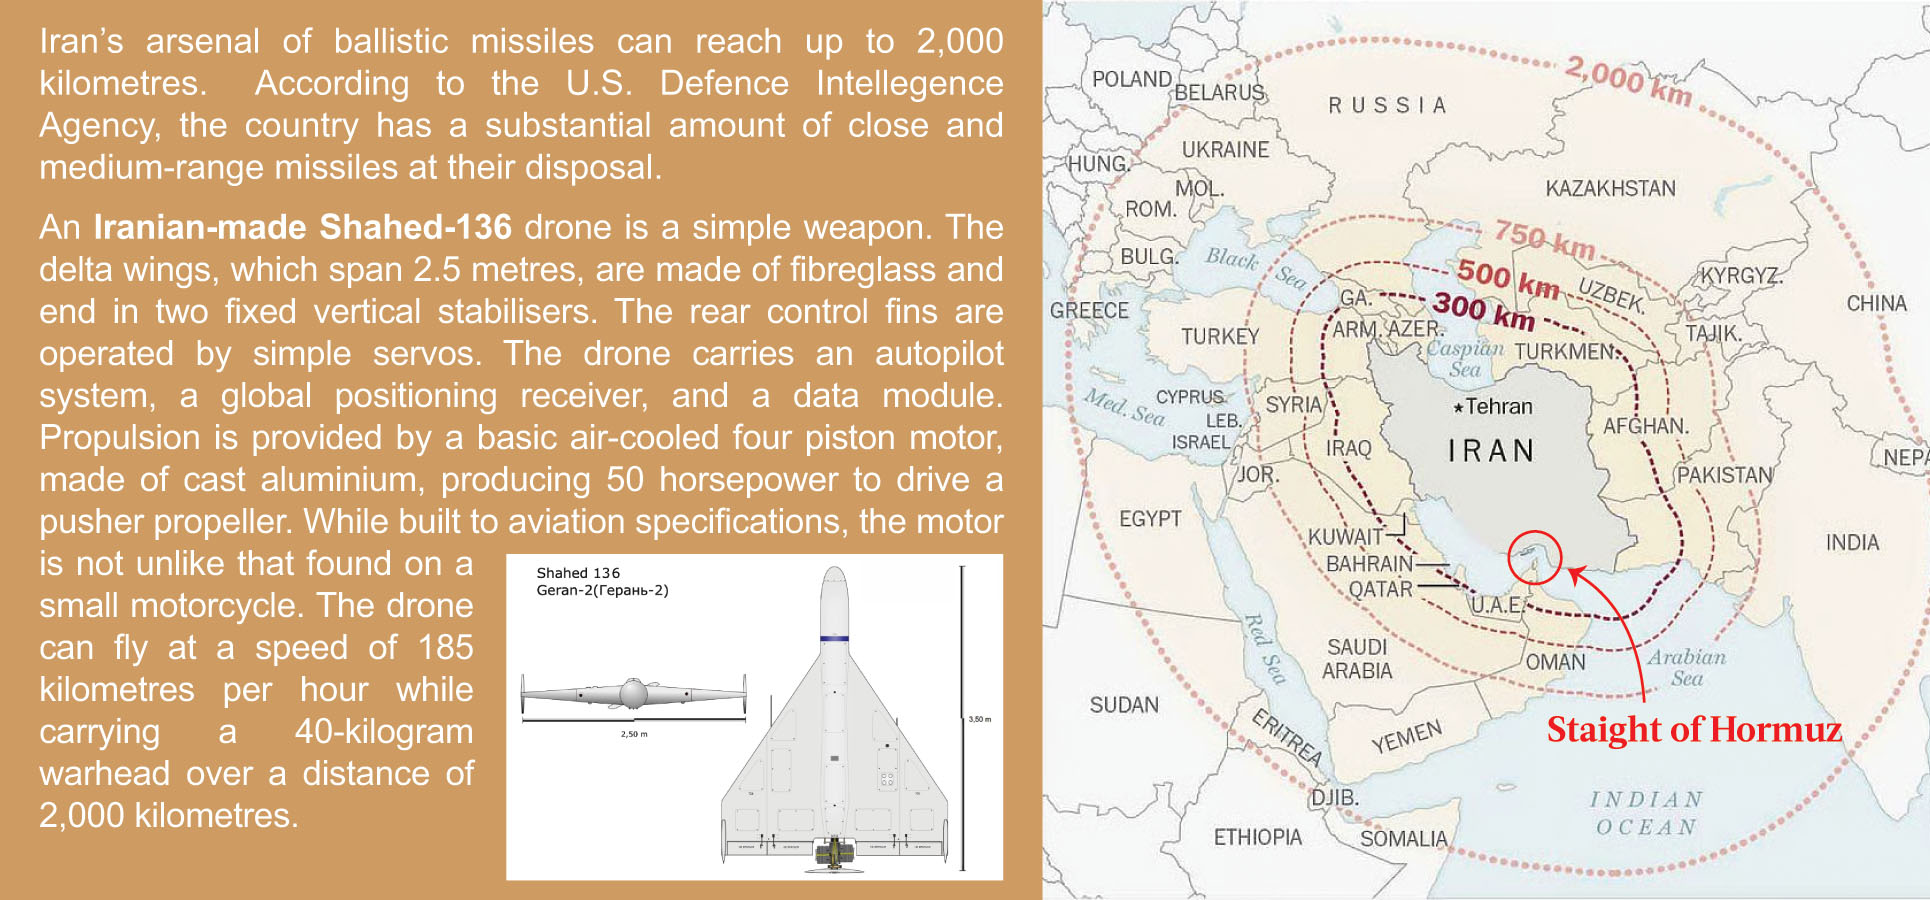
At the same time, the nature of warfare itself has shifted.  Having studied the Russian’s use of Iran-supplied drones (unmanned aerial vehicles), it has employed the same drone-swarming tactics alongside missile barrages, representing a strategy designed not only to strike targets but to exhaust Western defensive systems over time.  Analysts note that drones are being used to saturate air defences, force the use of expensive interceptors, and stretch protection systems across a wider geographic footprint.  This is not simply a tactical evolution; it is a financial one.  Iran has little choice but to fully commit to this conflict, and appears intent on demonstrating to the West that any prolonged engagement will come at a significant cost, both in operational efficiency and endurance, fiscally, as well as in firepower.


Asymmetric costs: America vs Iran

The imbalance in costs between the United States and Iran is stark.  In the opening phase alone, U.S. forces deployed approximately 170 Tomahawk missiles in just 100 hours.  This is three times the number that the Pentagon procured from American defence contractor, Raytheon, in the entire 2026 fiscal year.  America is using their fire power far quicker than they can replace them according to Stephen Flynn, a Northeastern University national security expert.  Each of these systems represents a significant financial outlay, and more importantly, a strain on replenishment capacity.

Interceptor systems further highlight this disparity.  A single Patriot missile costs around USD $4 to $4.5 million, while advanced systems such as the Terminal High Altitude Area Defence (THAAD) truck mounted interceptors can reach USD $12.8 million each.  Naval-based SM-3 systems range between USD $10 million and $28 million per shot. These are the tools required to defend against incoming threats, yet they are increasingly being used against vastly cheaper weapons.

By contrast, Iran’s strategy relies heavily on low-cost drones.  A Shahed 136 Geran-2 drone is widely estimated in Western and Persian reports to cost between USD $20,000 and $50,000.  But Iranian academics with knowledge of Iran’s defence industry place the figure realistically closer to USD $4,000.  Even at the higher estimate, the cost disparity is extraordinary.  It creates a scenario where defending against an attack can cost potentially 100 times more than launching it.  Said another way, it costs America $4 million to defend against a single $4000 drone.  This puts the defence against more than 500 drones in the opening days of the conflict into an entirely different perspective, especially since they have deployed thousands more since the start of the war.  As one analyst succinctly noted, it is unsustainable to use million-dollar interceptors against low-cost aerial threats.

This imbalance is not incidental; it is a deliberate strategy employed by Iran.  It is designed to stretch budgets, deplete stockpiles, and force strategic decisions based not just on military effectiveness, but financial endurance.  In this environment, the cheapest weapon often becomes the most disruptive.

The expanding price tag

The financial cost of the war is escalating rapidly.  Within the first week, estimates placed the total expenditure at approximately USD $12.7 billion with projections climbing as operations continue.  The Pentagon has already sought an additional USD $200 billion in supplemental funding, signalling that this is not a short-term engagement.

Beyond direct military spending, the indirect costs are equally significant.  Supply chains are being strained, skilled labour shortages are limiting production capacity, and energy markets are reacting to instability.  Oil price movements alone have the potential to feed directly into inflation, increasing costs across transportation, manufacturing, and food production.  In effect, the cost of war extends well beyond the battlefield.  It becomes embedded in everyday economic activity, influencing everything from interest rates to household expenses.


Economic consequences: the public pays

Ultimately, the cost of war is not borne solely by governments but is transferred to the public.  In the United States, this transfer occurs through two primary channels: inflation and economic slowdown.  In addition to rising oil prices, if war-driven spending contributes to pushing inflation higher central banks will be forced to maintain or increase interest rates to contain it.  Higher rates increase borrowing costs, reduce disposable income, and slow economic growth.  Alternatively, if economic weakness becomes the dominant concern, rates may be lowered to stimulate activity, but at the risk of further inflation.

Either path carries a cost.  Households pay through higher living expenses or reduced economic opportunity.  This is the core reality of modern conflict: regardless of policy direction, the financial burden eventually flows through to the broader population.

Compounding this is the growing risk of stagflation, where inflation remains elevated while growth stagnates.  In such an environment, traditional investment strategies struggle, and capital begins to seek a hedge against inflation.


Positioning for what comes next

In periods where geopolitical uncertainty intersects with economic strain, capital does not disappear, it reallocates.  Investors begin to prioritise preservation over growth, shifting toward assets that are not dependent on counterparty risk or yield dynamics.

Gold and silver have historically occupied this role for a reason.  They do not rely on the performance of a government, a corporation, or a financial system.  They simply exist a store of value. Geopolitical events often express themselves through competing forces such as bond yields and currency strength, but this does not signal weakness in precious metals.  Indeed Goldman Sachs still projects USD $5,400 and Wells Fargo has doubled down at up to USD $6,300 for gold by end of year.  Importantly, if nothing else, metals remain an effective hedge against inflation, helping investors preserve purchasing power in an increasingly expensive environment.

What matters is the broader trend.  Central banks continue to accumulate gold.  Industrial demand for silver remains structurally strong.  And as the cost of war feeds into the global economy and demand for metal, the case for holding tangible assets becomes increasingly clear.

Periods like this are rarely comfortable.  Volatility tests conviction and short-term narratives dominate headlines.  But history suggests that these are precisely the conditions where positioning matters most.  War reshapes economies, redistributes capital, and exposes structural weaknesses.  Those who recognise this early tend to focus less on timing the market and more on securing exposure to assets that endure beyond it.


In summary

The cost of war is not confined to defence budgets or military assets.  It is a layered and expanding burden that touches manufacturing, energy, inflation, and ultimately the everyday economy.  The asymmetry between low-cost offensive systems and high-cost defensive responses is reshaping how conflicts are fought, and more importantly, how they are funded.

For the United States, the challenge lies in sustaining a high-cost military strategy against a lower-cost adversary.  For Iran, the strategy is endurance, leveraging cost efficiency to stretch its opponent over time.  For the global economy, the consequence is rising uncertainty and increasing financial pressure.

In that environment, the role of precious metals becomes clearer.  Not as a reaction to every headline, but as a strategic position within a system under strain.  The dynamics driving this conflict are unlikely to resolve quickly.  And as they continue to unfold, the question is not whether there is a cost, but who ultimately pays it.

Posted on

War, Oil and Uncertainty: Markets at a Crossroads

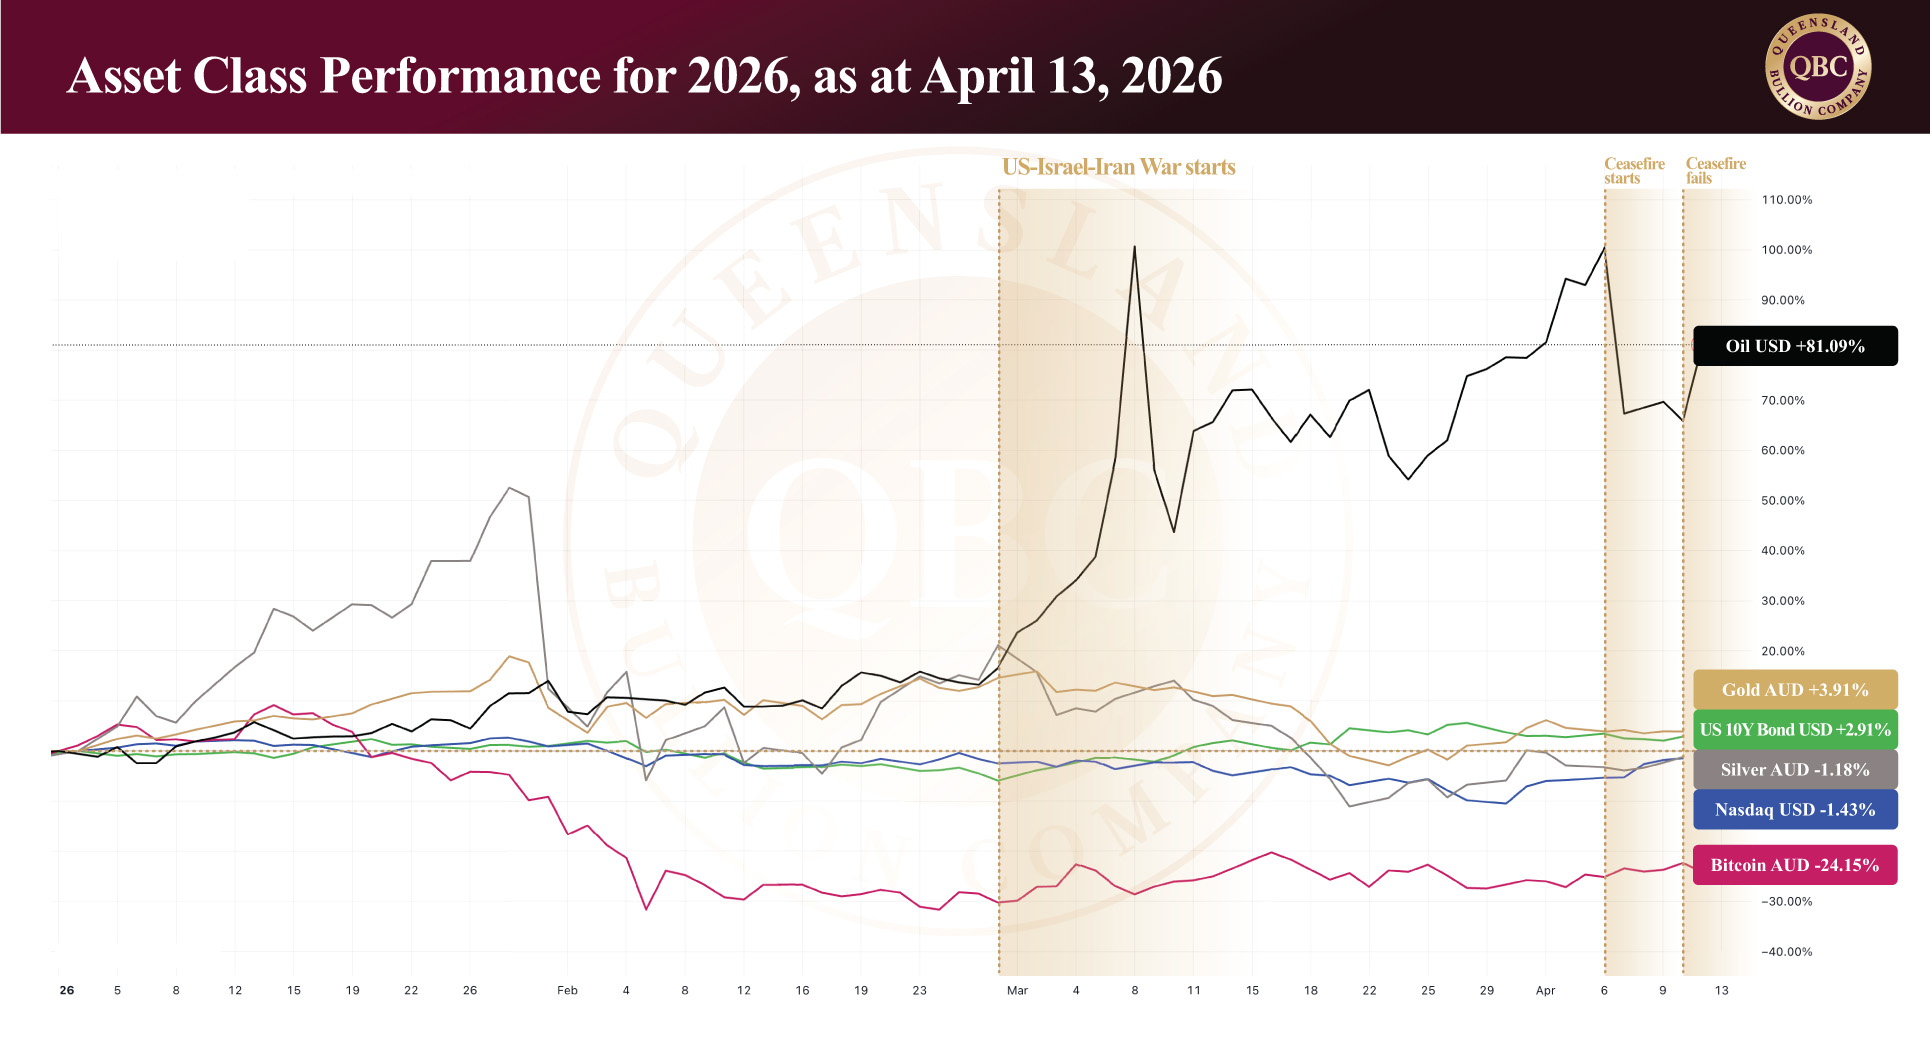
Global markets are currently being driven by one dominant force: uncertainty around geopolitical direction.  The 2026 U.S.–Israel–Iran conflict has introduced a level of unpredictability that is now outweighing traditional economic indicators, forcing investors to position around potential outcomes rather than confirmed developments.  At the time of writing, gold trades around AUD $6,719 per ounce, silver near AUD $105.36, and platinum approximately AUD $2,889, reflecting a market that has stabilised but remains highly reactive.

Unlike previous geopolitical events, where market responses followed a more predictable pattern, the current environment is defined by competing narratives.  Oil, inflation, interest rates, and risk sentiment are all moving in response to a conflict that has yet to reveal its true trajectory.  To understand how markets may evolve from here, it is necessary to first assess the current status quo on the ground.


A fragile status quo

The 2026 U.S.-Israel-Iran War has already reshaped global trade flows, particularly in energy markets.  Commercial traffic through the Strait of Hormuz dropped by more than 90% following the outbreak of hostilities, before declining further as Iran escalated attacks on shipping throughout March.  In response, Iran has selectively allowed passage for certain vessels including its own, those from cooperating nations, and others willing to pay a substantial toll.

While these disruptions have created widespread economic strain, they have also produced an unintended outcome for the West.  Iran has experienced a significant revenue boost, with oil income rising by approximately USD $25 million per day, while Russia has benefited even more, seeing gains of roughly USD $150 million per day over the same period.  In this sense, the conflict has simultaneously disrupted global markets while strengthening the financial position of key participants.

The tone of the conflict has reflected this intensity.  On April 7, U.S. President Trump warned that “a whole civilisation will die tonight, never to be brought back again.” The situation has been fluid, though, and after more than five weeks of sustained fighting the two-week ceasefire brokered by Pakistan saw diplomatic efforts collapse with no resolution over the weekend, with the US stating that they intend to blockade the Strait of Hormuz “effective immediately,” targeting ships in relation to Iran (a move that will impact the lucrative profits of the East).  This is in line with Israeli Prime Minister Benjamin Netanyahu’s sentiment, who stated before the breakdown that “we still have goals to complete… and we will achieve them either by agreement or by the resumption of fighting.”


If the conflict escalates

Should the conflict escalate (as it appears to be), the economic consequences are relatively clear.  Oil prices would likely move higher as supply risks intensify, feeding directly into inflation.  In turn, central banks (particularly the U.S. Federal Reserve) would be forced to maintain or increase interest rates to contain those pressures.

Higher rates would support U.S. Treasury yields, drawing capital into bonds and strengthening the U.S. dollar.  In this environment, most other asset classes would come under pressure.  Equities would likely decline as borrowing costs rise and economic growth slows.  Cryptocurrencies, already sensitive to liquidity conditions, could face further downside.

Precious metals present a more nuanced case.  While gold is traditionally a safe-haven asset, its performance in this cycle has shown that it must compete with yield-bearing alternatives.  Silver, with its significant industrial component, may also face headwinds if higher energy costs begin to slow global economic activity.  Although, it should be noted that historically the competition between yields and metals have often lead to a long-term significant correction. One that often sees all asset classes repriced prior to precious metals leading the recovery.

At the extreme, prolonged escalation risks pushing the global economy toward stagflation, a scenario characterised by rising inflation, slowing growth, and declining consumer demand.  Recently the International Monetary Fund (IMF) has already warned the war is triggering a stagflation shock, predicting that USD $20B to $50B in additional financing will be needed, with countries that import oil bearing the brunt of the burden.  In such an environment, higher interest rates reduce disposable income, increasing financial stress across households and businesses.  Mortgage defaults begin to rise, and pressure on banking systems can emerge.

When combined with already elevated global debt levels and signs of softening employment, the broader financial system becomes increasingly fragile.


If the conflict resolves

A resolution, however, does not imply an immediate return to normal conditions.

While oil prices would likely decline, the recovery of global energy supply would be a multi-stage process.  The conflict has damaged more than 40 energy assets across nine countries, and restarting production involves a series of constraints: securing shipping lanes, clearing storage bottlenecks, restoring output, and repairing infrastructure.

Even under favourable conditions, timelines are measured in weeks and months, not days.  Smaller oil fields may resume within two to three weeks, while larger fields could take several weeks.  Refineries may restart within 10 to 15 days if damage is limited, but prolonged shutdowns introduce technical challenges such as corrosion and pressure imbalances.  Full recovery often mirrors the duration of the disruption itself, with estimates ranging between two and nine months for outages to restore normal output.  Iraq, for example, could require six to nine months to return to pre-conflict production levels due to reservoir and operational constraints.

As supply gradually returns oil prices would ease, reducing inflationary pressure.  This would allow central banks to adopt a more dovish stance, potentially lowering interest rates over time.  In such an environment, risk-on assets would likely recover.  Equities could outperform, cryptocurrencies may stabilise, and precious metals would benefit from improving sentiment and lower Treasury bond yields.

However, this recovery would not be immediate.  It would unfold in phases, with each stage introducing delays and uncertainty.


If the conflict drags

The third scenario, and perhaps the most difficult to price, is one in which the conflict neither escalates dramatically nor resolves.  In this case, markets would face a slow, persistent grind.  Oil prices would likely drift higher over time, maintaining upward pressure on inflation.  Central banks would remain constrained, unable to ease policy meaningfully.  Interest rates would stay elevated, gradually tightening financial conditions.

This scenario is particularly damaging for confidence.  Unlike sharp shocks, which markets can reprice quickly, prolonged uncertainty erodes sentiment over time.  Investment slows, consumption weakens, and economic momentum fades.  In effect, it produces many of the same outcomes as stagflation, but in a slower and more sustained manner.

In summary

Markets today are not reacting to what has happened, but to what they believe will happen next.  History suggests caution.  Geopolitical events rarely follow linear paths, and early expectations are often proven wrong.  Whether the conflict escalates, resolves, or lingers will determine the direction of oil, inflation, interest rates, and ultimately all major asset classes.

In the meantime, markets remain positioned across competing outcomes.  Oil reflects disruption.  Treasury yields reflect inflation, policy constraints, and confidence in the governments.  Precious metals reflect a balance between risk and yield.  Equities and cryptocurrencies reflect a reassessment of growth and liquidity.  Periods like this do not reward certainty; they reward preparation and adaptability.  As the situation evolves, the ability to distinguish between temporary developments and structural shifts will determine how capital is allocated.  In such an environment, understanding the interplay between geopolitics and markets is no longer optional — it is essential.