
Financial Collapse Part 1: Five Warning Signs
by QBC Analyst
Over the past three decades, Australian investors have endured the dot-com collapse, the Global Financial Crisis (GFC), the Covid 19 Pandemic market shock and numerous smaller corrections. Each arrived under different circumstances and the event that ultimately triggered the sell-off was generally easier to identify in hindsight. Financial crises rarely become destructive because of one indicator alone. In 2026, several vulnerabilities are appearing simultaneously.
McKinsey Global Institute estimates that global household net worth reached a record USD $570 trillion in 2025, equivalent to around 4.8 times global GDP. Yet only 20% of the increase in household wealth that year came from net new investment, with nearly 60% attributed to rising asset values and other forms of “paper wealth”. At the time of writing, gold trades at approximately AUD $6,215 per ounce, silver at AUD $93.07 per ounce and platinum at AUD $2,537.72 per ounce. Against this backdrop, there are five warning signs Australian investors should watch closely.
- Could an unwind of the Yen carry trade destabilise global markets?
As examined recently in our two-part series on the Yen Carry Trade, decades of extremely low Japanese interest rates encouraged investors to borrow cheaply in yen and invest in higher-yielding assets overseas. The strategy becomes vulnerable when Japanese borrowing costs rise or the yen appreciates sharply, potentially forcing leveraged investors to sell foreign assets and repurchase yen to close their positions. Japan is also one of the world’s largest holders of US Treasuries, creating an important connection between Japanese currency policy and the American bond market.
The precise size of the carry trade is impossible to determine because exposure exists across banks, funds, derivatives and private investors. It has been estimated to be around the vicinity of USD $20 trillion and while the amount is staggering, what matters more is its reach. A disorderly unwind could reach into multiple countries via institutional investment in currencies, bonds and equities simultaneously, making instability in the yen one of the riskiest sources for global financial systems. Recent US-Japan intervention to stabilise the yen demonstrates how seriously policymakers regard instability in the currency. This is the first time the White House has intervened in the yen since 1998. Of this century, Japan has intervened eight times, twice after the GFC (in 2010 and 2011), and since the start of the Covid 19 Pandemic Era it has intervened another six times in four years. Is this a sign that the Yen carry trade is reaching a potential pain point? Many indicators suggest it is.
- Are government debt and bond yields becoming harder to manage?
The second warning sign sits in sovereign debt markets. In 2025 Government debt exceeded 100% of GDP in Japan, Italy, the United States, France, Canada, Belgium, the United Kingdom and Spain. Higher interest rates make those liabilities increasingly important because governments can no longer assume they will continually refinance enormous debt burdens at low rates.
The United States Treasury market is particularly important because of the enormous exposure of foreign governments and institutions to US sovereign debt. During August, the 10-year Treasury yield repeatedly approached 4.7%, while the 30-year yield has remained above 5.2% since May. What makes these levels particularly noteworthy is their historical precedent. In the two years preceding the GFC, both yields repeatedly reached similar levels. Nearly two decades later, the same warning signs are re-emerging, with the 10-year yield repeatedly testing 4.7% over the past three years and the 30-year yield once again moving above 5%. When bond yields rise above 5% this can raise a red flag for institutional investors who may lose confidence in fiscal governance. Currently, markets give the 10-year bond yield a 33% of reaching 5% by the end of the year. With US federal debt having breached USD $40 trillion in August 2026, higher yields can substantially increase the cost of refinancing government liabilities while also placing upward pressure on mortgages and corporate borrowing costs. The recent announcement that the Treasury will increase its buybacks by double or even more may improve liquidity within particular parts of the bond market, but they do not eliminate the underlying debt. If investors eventually demand structurally higher returns to justify the perceived risk of absorbing increasing Treasury supply, the consequences could extend well beyond the US Government.
- Have global share markets become too expensive and concentrated?
Equity markets provide another warning sign. McKinsey estimates equity values reached approximately 3.8 times GDP in Canada and 3.7 times GDP in the United States, with US valuations nearly double their historical average. The United States also accounts for almost half of the equity value across the major economies examined, while more than one-third of US equity liabilities are owed to foreign entities. Like fascia that connects every muscle in the body together, American stocks also form a web throughout the global financial system, reaching into and influencing almost all major economies in the public and private sectors alike.
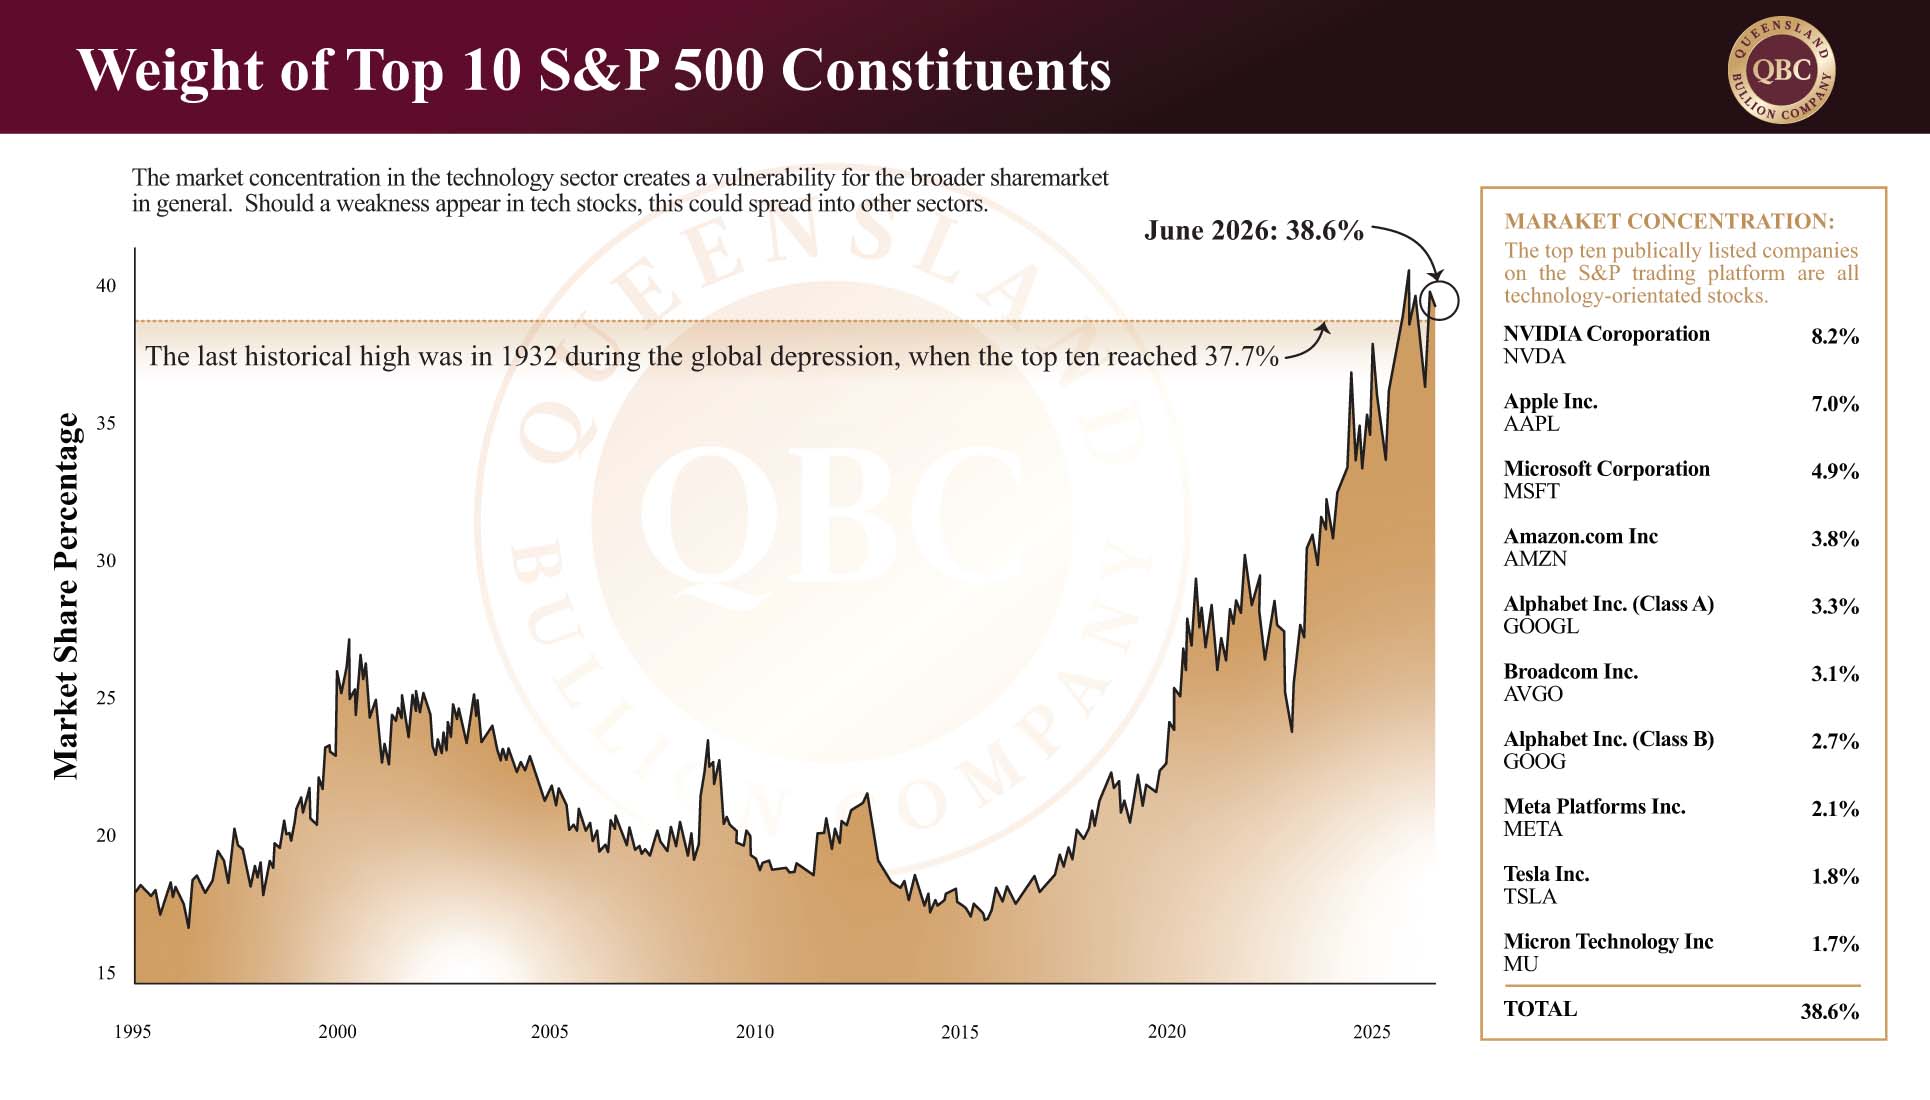
Concentration within the US market has also increased. More than 50% of the growth in S&P 500 market capitalisation between 2021 and 2025 came from the Magnificent Seven (all technology-orientated companies), reflecting extraordinary investor enthusiasm surrounding artificial intelligence. This does not mean AI itself is a bubble. The question is whether current valuations have already incorporated too much future growth (read more on this here). Currently the top ten publicly traded companies account for more than 37% of the stock market. This type of concentration of capital has not been seen since the 1930s Great Depression Era and creates a significant vulnerability. Should a weakness eventuate in this sector (such as a significant correction to an overvalued market), the repercussions for the entire US stock market could be significant for domestic and international investors alike.
Australia is not immune. According to the Buffet Indicator its equity market is currently worth approximately 1.15 times national GDP (compared with around 1.1 times GDP at the market peak preceding the GFC). During the crisis that followed, the ASX ultimately lost around 54% from peak to trough. High valuations do not cause market corrections, but they can increase investor vulnerability when a financial shock drives asset prices sharply lower, leaving previously manageable levels of leverage suddenly overextended.
- Are global property markets losing value?
Real estate is the world’s largest single asset and the largest component of household wealth across most economies. Changes in property prices therefore affect considerably more than homeowners, influencing household confidence, construction, borrowing capacity, banking collateral and consumer spending. Since the GFC global house prices have increased by 20%. Now it seems the tide is turning. Latest Bank for International Settlements (BIS) data shows real global house prices fell 1.2% year-on-year in the first quarter of 2026, including declines of approximately 7% in Canada and 2% in both the United States and United Kingdom. China has experienced a considerably deeper adjustment, with real house prices 22% below their Q4 2019 level, including a further 7% year-on-year decline in the first quarter of 2026.
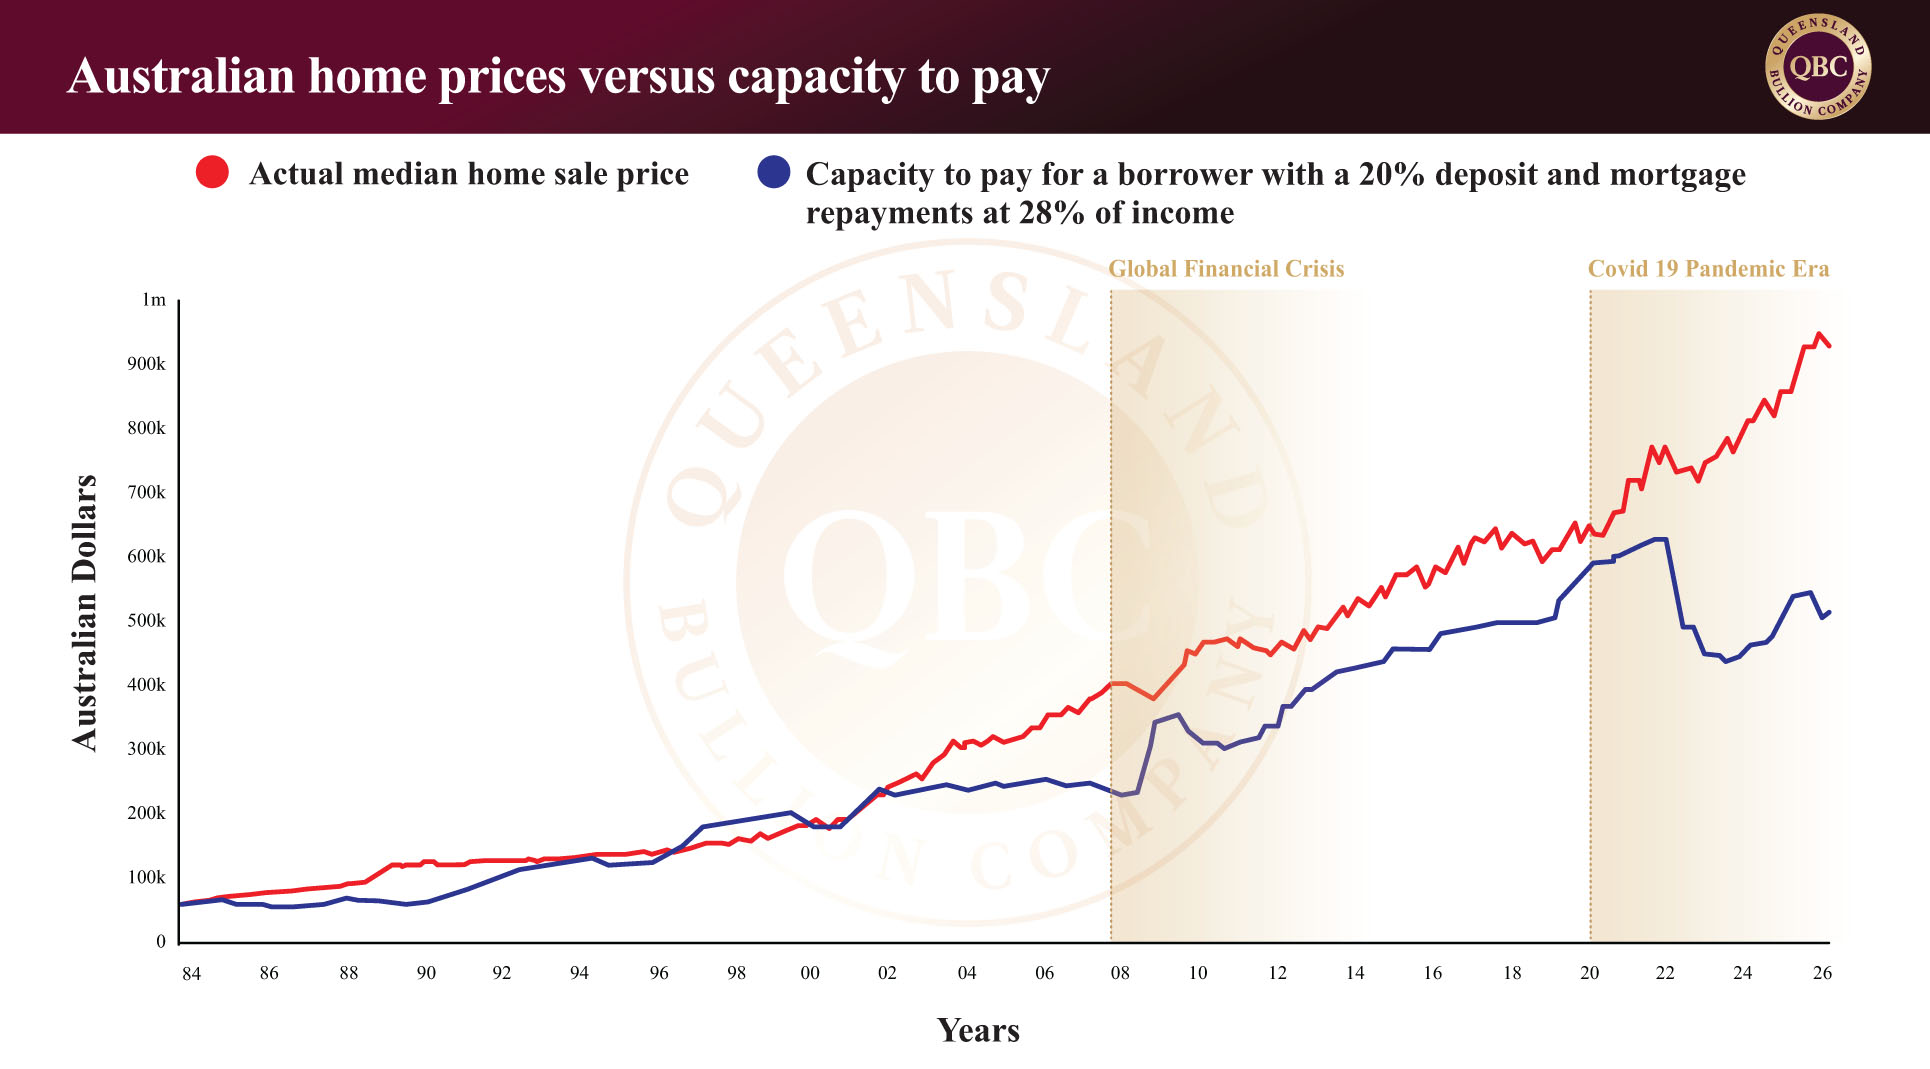
Australia remains a striking exception. Since the Covid 19 Pandemic Era, Australian property increased approximately 64% from trough to peak (April 2020 and March 2026). While real house prices have been falling across a number of major economies, BIS data shows Australian real house prices increased approximately 6% year-on-year in the first quarter of 2026 and remained around 23% above their Q4 2019 level. This resilience has left Australian property unusually elevated relative to the broader economy. McKinsey estimates the value of Australian real estate at approximately 4.5 times GDP, while household real estate relative to GDP sits around 80 percentage points above its 25-year average. Housing shortages, constrained listings and government assistance continue to provide support, but how long can these factors sustain elevated prices? Poor affordability and higher mortgage rates are beginning to place greater pressure on buyers, with signs appearing of the Australian property market starting to soften. The warning is that Australian property has been unusually elevated at a time when many international markets have already begun adjusting to a considerably more expensive borrowing environment. Is Australia about to the chorus? Our next article explores this in more depth.
- What does persistent inflation mean for central banks?
Inflation presents a different risk to financial markets because it can restrict the ability of central banks to respond when economic conditions deteriorate (as well as put upward pressure on everyday consumer items). For decades, investors became accustomed to central banks cutting interest rates when financial markets or the economy came under pressure. Lower rates reduced borrowing costs, encouraged lending and investment, supported economic activity and, in turn, helped stabilise financial markets. During the GFC and the Covid 19 Pandemic Era, conventional rate cuts were supplemented by extraordinary measures including quantitative easing and enormous government stimulus, especially so in Australia. The problem in 2026 is that inflation remains difficult to contain. Higher energy prices, tariffs, geopolitical instability and supply-chain disruptions can all place renewed upward pressure on prices, even as parts of the economy begin to weaken. This creates an uncomfortable dilemma for central banks.
Lowering interest rates can soften an economic or financial downturn or take the heat out of the market, which can indirectly help prevent asset prices from falling as severely, but it directly affects a government’s ability to attract investors to finance debt. Keeping rates high, however, places continued pressure on households, businesses, property markets and highly indebted governments through its repayment schemes. The most difficult scenario would be one in which economic growth deteriorates while inflation remains stubbornly high. Many analysts believe we are at this point now. Central banks would then face competing objectives: stimulate the economy and potentially worsen inflation or continue fighting inflation and risk intensifying the downturn.
This matters because many asset valuations have developed during an era in which investors could reasonably expect monetary policy to become supportive when conditions deteriorated. If persistent inflation limits that response, the next major correction could occur with central banks having considerably less room to intervene. For investors, that represents a very different financial environment from the one that supported asset prices through much of the past several decades. The warning is not simply that inflation could remain high. It is that inflation could remove one of the financial system’s most important safety nets precisely when markets need it most.
Is a financial crash coming?
None of these warning signs proves that a major financial correction is imminent. The yen carry trade could unwind gradually. Governments may successfully manage their debt and inflation burdens. AI-related earnings may ultimately justify elevated equity valuations. Australian housing shortages could continue supporting property prices, while households may successfully adjust to higher borrowing costs. The concern is that these risks are increasingly connected.
Currency markets influence bonds. Bond yields influence equities and property. Property supports household wealth and collateral. Household debt influences spending, while spending influences businesses and employment. Investors who are leveraged can expect amplified profits and losses within that system. For Australian investors, attempting to identify the precise trigger or date of the next financial crisis may therefore be less useful than ensuring they are prepared if one occurs. Diversification, manageable leverage, sufficient liquidity and an understanding of counterparty exposure become increasingly important when asset values are elevated.
Physical gold and silver can form one component of that preparation because bullion owned outright does not represent another institution’s liability. Precious metals will continue to fluctuate in price, but their underlying existence does not depend upon a borrower repaying a loan, a bank remaining solvent or a government successfully refinancing its debt.
The five warning signs examined here are largely expressed through percentages of GDP, bond yields and trillions of dollars. Yet financial corrections never remain confined to statistics. Eventually they reach businesses, investments, employment, mortgages and families. An unfolding situation within Australia’s property sector is currently providing a real-world example of how quickly those connections can emerge. In Part Two, we examine the Bathla Group administration and what it can tell Australian investors about how financial stress moves from property into private credit, businesses and ultimately households.