Gold’s 5,000-Year Record: Lessons from History and the Road Ahead
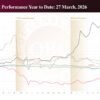
by Evie SoemardiFor more than five millennia, gold has held its place as the ultimate store of wealth, a universal standard that transcends currencies, governments, and even civilisations. Its longevity is what makes it unique. Gold’s history provides the rare ability to analyse long-term trends and cycles that stretch across generations. The same cannot be said for newer markets (such as cryptocurrencies and specific equities), which have yet to prove themselves through repeated cycles of crisis and recovery. Today, gold continues to perform its ancient role with renewed relevance. At the time of writing, gold trades at AUD $6,242, silver at AUD $77.57, and platinum at AUD $2,387. Each metal has seen strong gains since early September and recent corrections appear to be part of a broader upward trajectory, the hallmark of a healthy, long-term bull market. Understanding gold’s long-term patterns allows one to place current price movements in their proper historical context and make better-informed investment decisions.
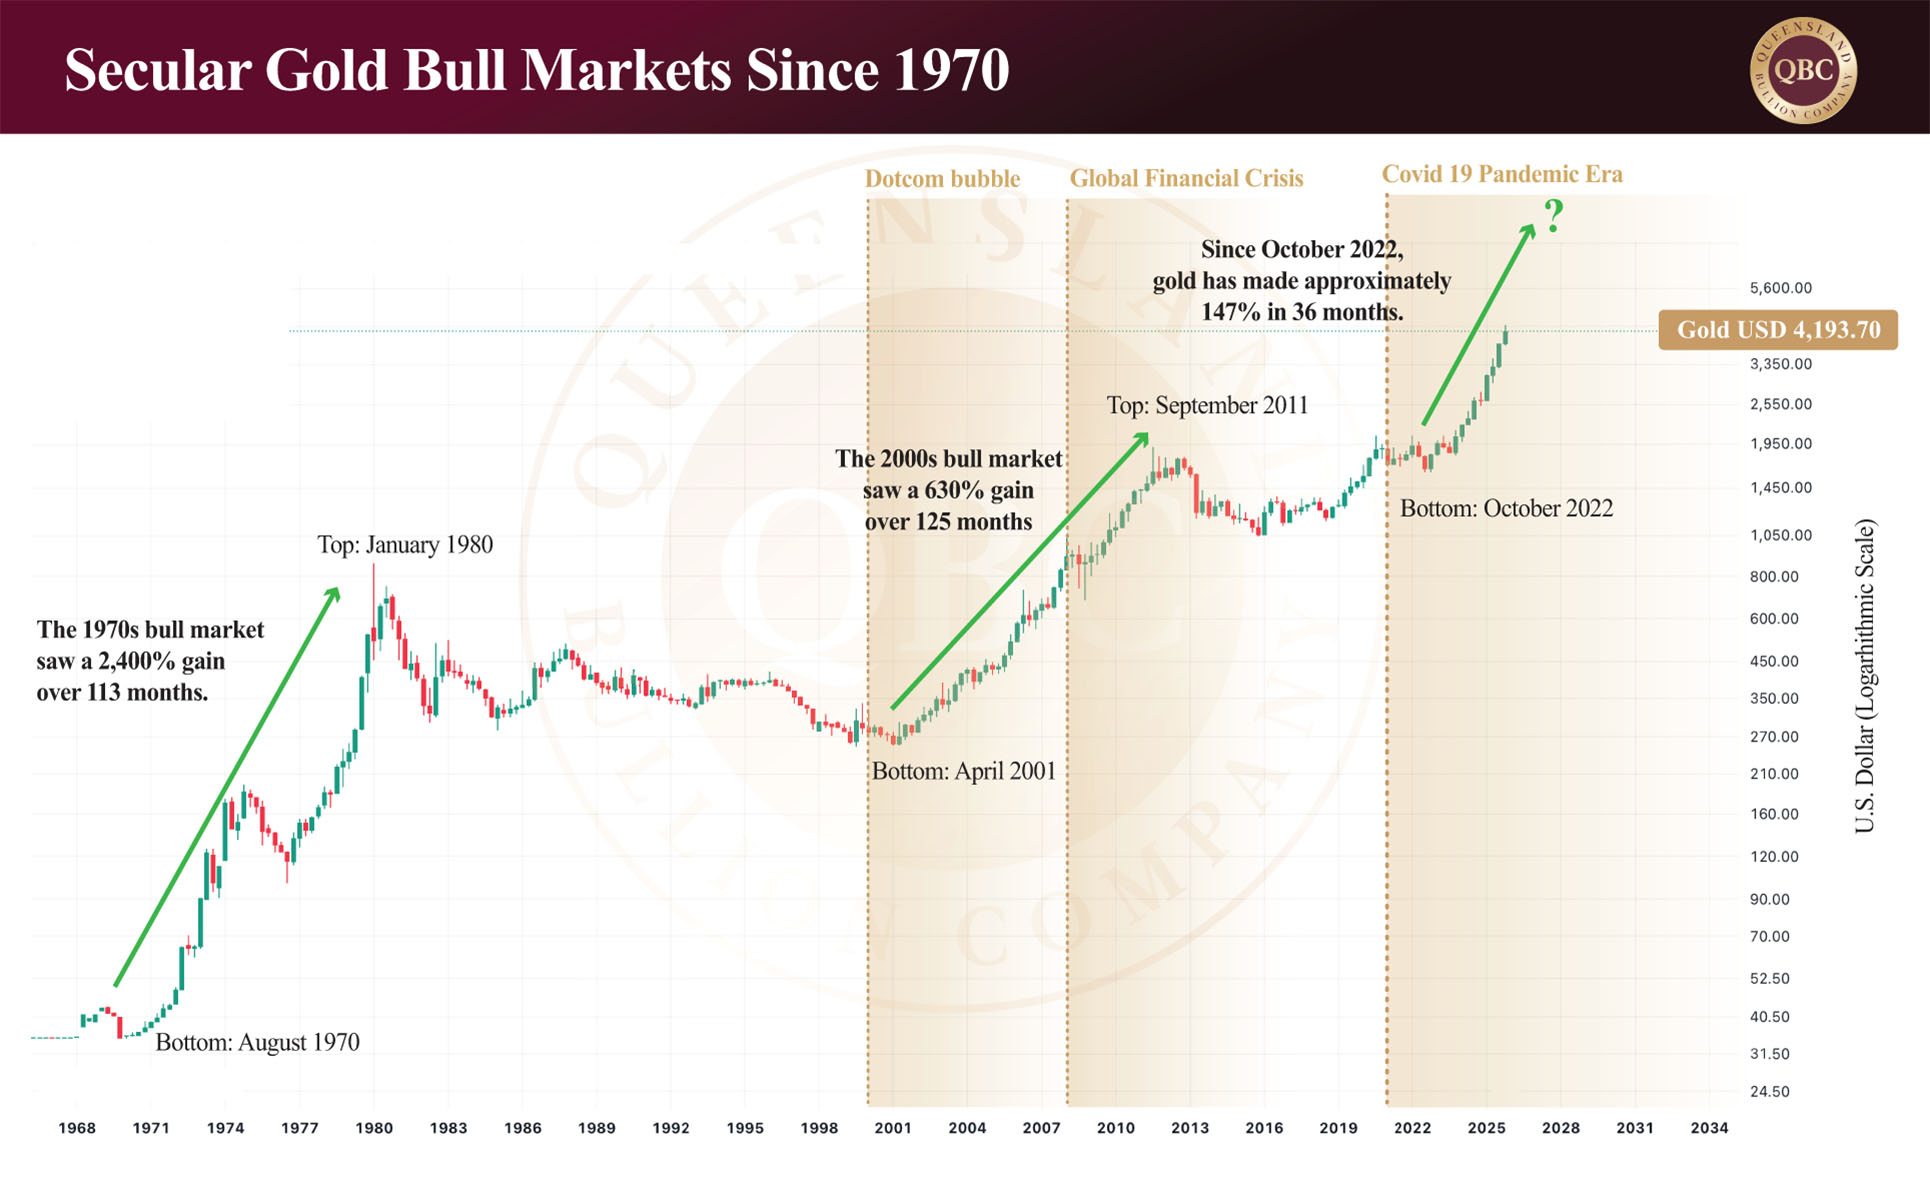
Historical secular bull markets in gold
A secular market describes a long-term trend driven by structural economic and geopolitical forces, often lasting years or decades. A secular bull market can include short-term pullbacks, yet the underlying trend remains upward. These corrections are essential for sustaining long-term growth by cooling off overbought conditions and setting the stage for renewed advances. The recent two-week correction in both gold and silver serves this purpose precisely, providing the market with the necessary pause before the next leg higher.
To appreciate the current moment it helps to look back. During the secular bull market of the 1970s, gold rose an astonishing 2,400% over nine and a half years, fueled by inflation, oil shocks, and the collapse of the Bretton Woods monetary system. The next secular bull market began in 2000 with the Dot Com bubble and consequent crash reaching record highs after the Global Financial Crisis, as gold gained 630% over ten years. By comparison, the current bull market, which began in late 2022, is up just 147%, still early in its cycle by historical standards. If history is any guide, this suggests there is considerable room for growth ahead.
Bear market or correction?
We have fielded the same question from many clients regarding the most recent pullback: are we witnessing a new bear market, or simply another correction within a broader bull run? The evidence strongly supports the latter. Gold’s recent 12% pullback (from its all-time high of AUD $6,758 to AUD $5,953 at the end of October) aligns closely with past corrections seen during earlier bull cycles. Even if gold had hypothetically fallen as low as AUD $5,676, representing a 16% decline, it would have still been consistent with historical norms. In each of gold’s previous secular bull markets, such retracements were followed by strong recoveries and new highs.
The below table shows multiple pullbacks in the U.S. gold market during the 2001 bull run.

Gold is now in the midst of its third major secular bull run since 1971, the year the U.S. abandoned the gold standard. Like the cycles of the 1970s and 2000s, this one is being shaped by a potent combination of government debt, inflation, geopolitical tension, and a weakening U.S. dollar. Gold has already broken decisively out of its short-term downtrend, confirming that the broader bull market remains intact — and, most importantly, that it still has many years left to run.
Gold versus the NASDAQ: shifting capital between asset classes
Markets move in cycles, and investors constantly rotate between asset classes in search of value. The relationship between gold and equities (particularly the NASDAQ, or technology stocks) illustrates this clearly. Generally investors shift between asset classes in response to the market and associated factors according to their risk tolerance. For instance, when technology stocks surge, gold often lags, and when confidence in risk-on assets fades, gold typically leads. This inverse relationship has played out repeatedly over the past two decades.
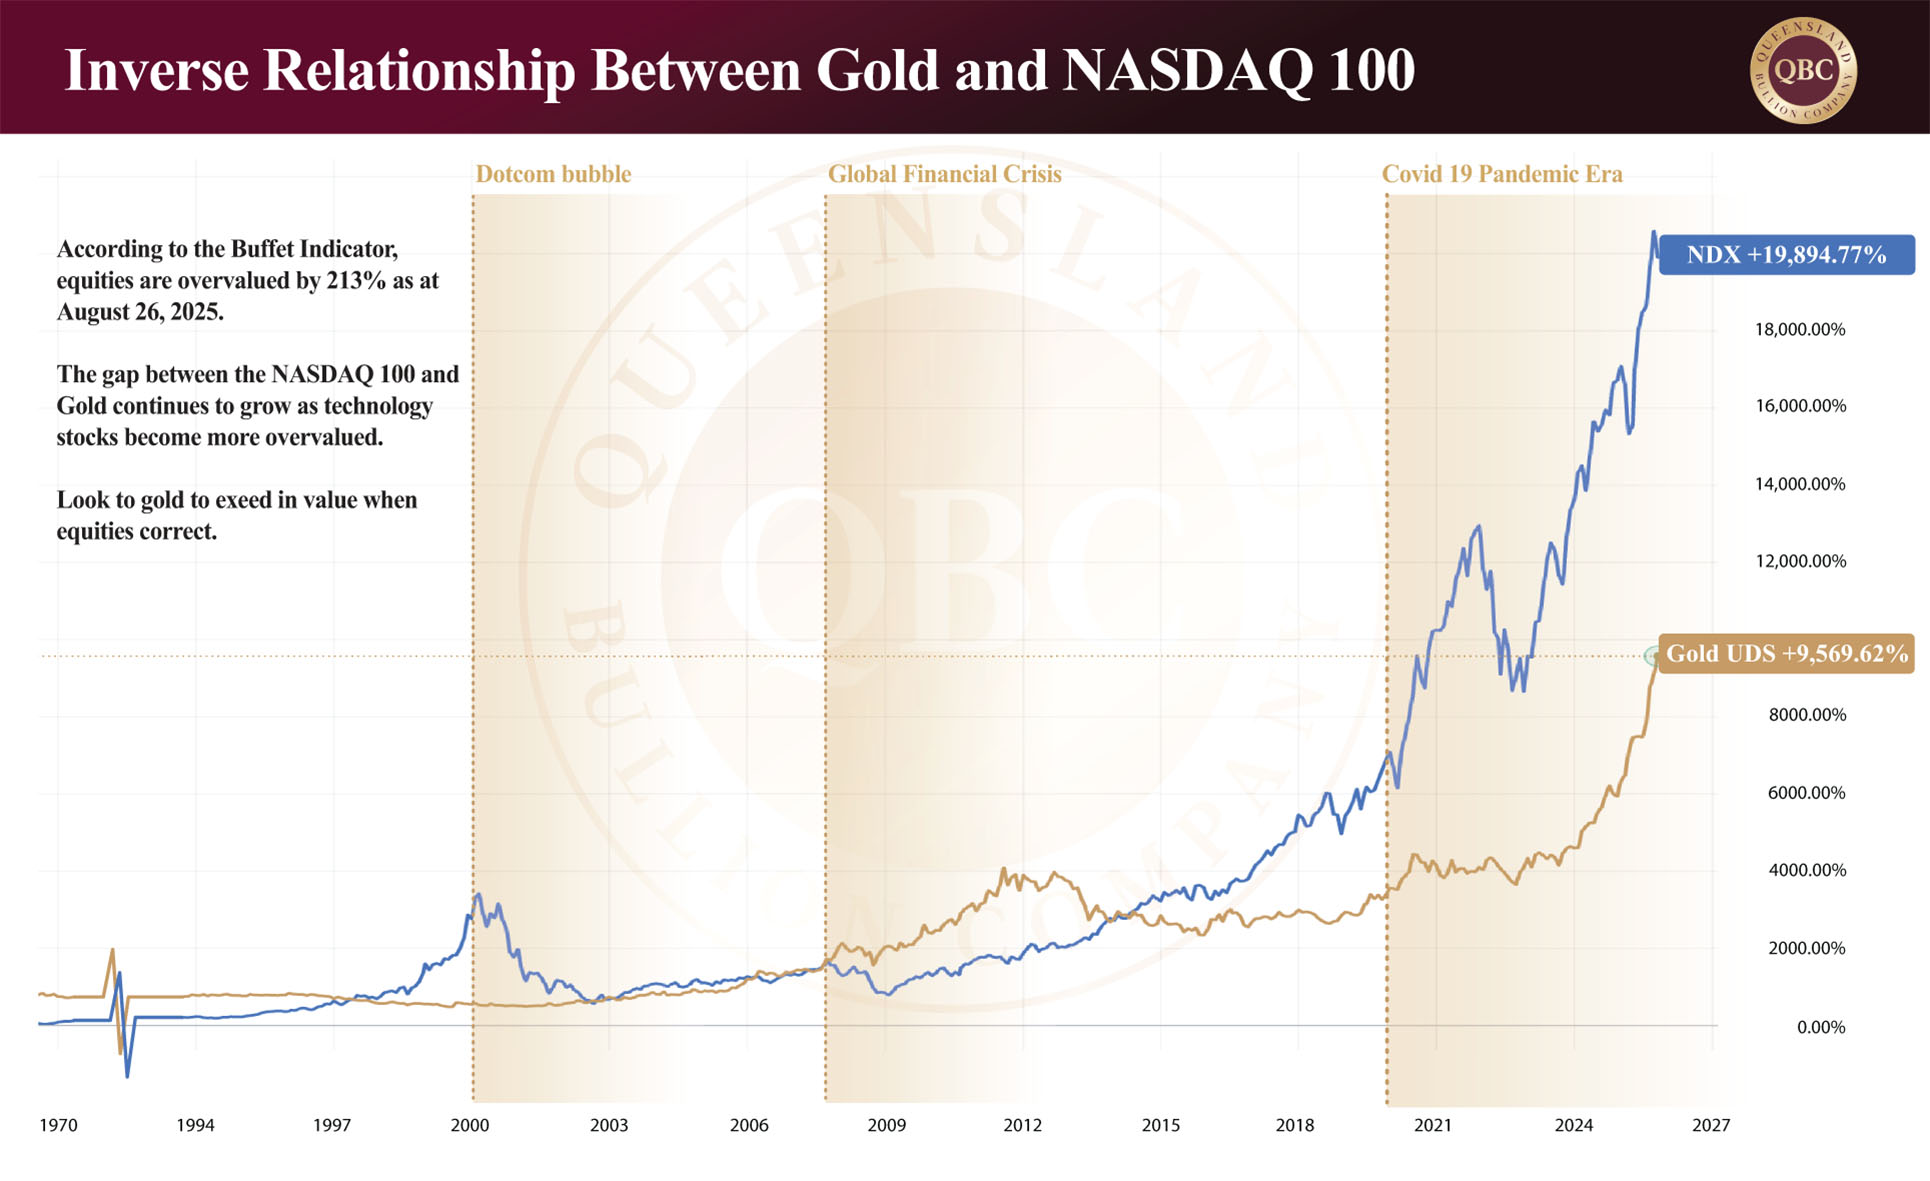
After the dotcom crash in 2000, the NASDAQ lost nearly 80% of its value, while gold began a multi-year rally as investors sought safety in hard assets. From 2016 to 2024, both gold and the NASDAQ rose together — the former driven by inflation, central bank buying, and geopolitical tension; the latter by technological breakthroughs in cloud computing and artificial intelligence. Yet such dual rallies rarely last indefinitely; however, tech valuations have left gold behind and once again stretched to extreme levels. For equities in general, the Buffett Indicator (the ratio of total U.S. stock market capitalisation to GDP) is now sitting around 213%, far above the historical norm of 75%–90%. For comparison, the indicator peaked at just 140% during the 2000 dotcom bubble and 202% in 2021 after the COVID stimulus surge. The U.S. stock market is now more overvalued than at any time in the last 45 years.
Gold and the NASDAQ belong to very different classes. Gold is recognised by the International Monetary Fund as a risk-free asset for central banks, while equities, particularly technology stocks, are inherently risk-on. When capital shifts from one to the other, it often marks the turning point of a cycle. If history is any guide, we may now be entering a period where investors rotate out of overvalued equities and back into gold, a pattern that has accompanied every major correction since the 1970s.
Conclusion: Positioning for the Next Phase
History rewards investors who understand where they are positioned within a market cycle. The most successful are those who exit overvalued assets near their peak and enter undervalued ones near their base. Today, equities and particularly U.S. technology stocks show signs of being at the top, while gold is still early in what appears to be a long secular bull run.
The underlying forces driving this trend, record debt, political instability, persistent inflation, and global uncertainty, are not temporary. They are structural. Gold’s 5,000-year record as a store of wealth continues to reaffirm its role as the foundation of financial security when other markets reach speculative extremes. For investors, the message is clear: focus on value, not noise. Short-term corrections are simply pauses within a much larger movement. In a world that continues to test economic resilience and political credibility, gold remains what it has always been, the ultimate hedge, the ultimate constant, and the ultimate measure of lasting wealth.
We make it a simple process for our valued clients to buy gold online. Click here to see availability and the most up to date prices.