Crisis Assets in Times of Chaos
by Evie SoemardiGold and silver have long been viewed a crisis hedge (assets that hold or gain value when markets turn volatile). Over the last two decades, two major crises—the 2008 Global Financial Crisis (GFC) and the 2020 COVID crash—have tested this thesis. Gold currently trades at $5,210, silver at $58.81, and platinum at $2,092. All have offered significant gains to investors year to date. Today, as global markets show signs of slowing and gold enjoys support above $5,100 in Australian dollars, it’s worth examining how these metals performed during those past upheavals and what the current technical landscape reveals about their evolving role in investor portfolios.
Gold crisis case study one: the GFC, a golden opportunity
During the Global Financial Crisis (GFC) gold proved its mettle. As with all asset classes it experienced a brief correction of 11.5% in late 2008 as liquidity evaporated and investors sold off assets indiscriminately to protect their wealth. This sell off is typical of all major corrections and occurs in almost all asset classes, a knee-jerk reaction triggered by market panic. The only difference is that some asset classes bounce back faster than others. Gold rebounded quickly and by 2011 (just over two years later) it reached a then-record high of AUD $1,714 (or an 85% increase), driven in Australia mainly by central bank easing, near zero interest rates, and ballooning sovereign debt.
The increase was amplified by a weakening AUD, offering domestic investors exceptional returns; however, note how currency exchange is the one variable that affects local precious metal prices beyond the spot price which is in USD. The graph below illustrates the difference in gold prices in AUD versus USD. Since the GFC, gold increased an additional 27% in local markets compared to the American market to date. This is due to the Australian dollar weakening against the Greenback over the same period. In fact, the difference in the two prices directly reflects the variation in the exchange rate between the two currencies.
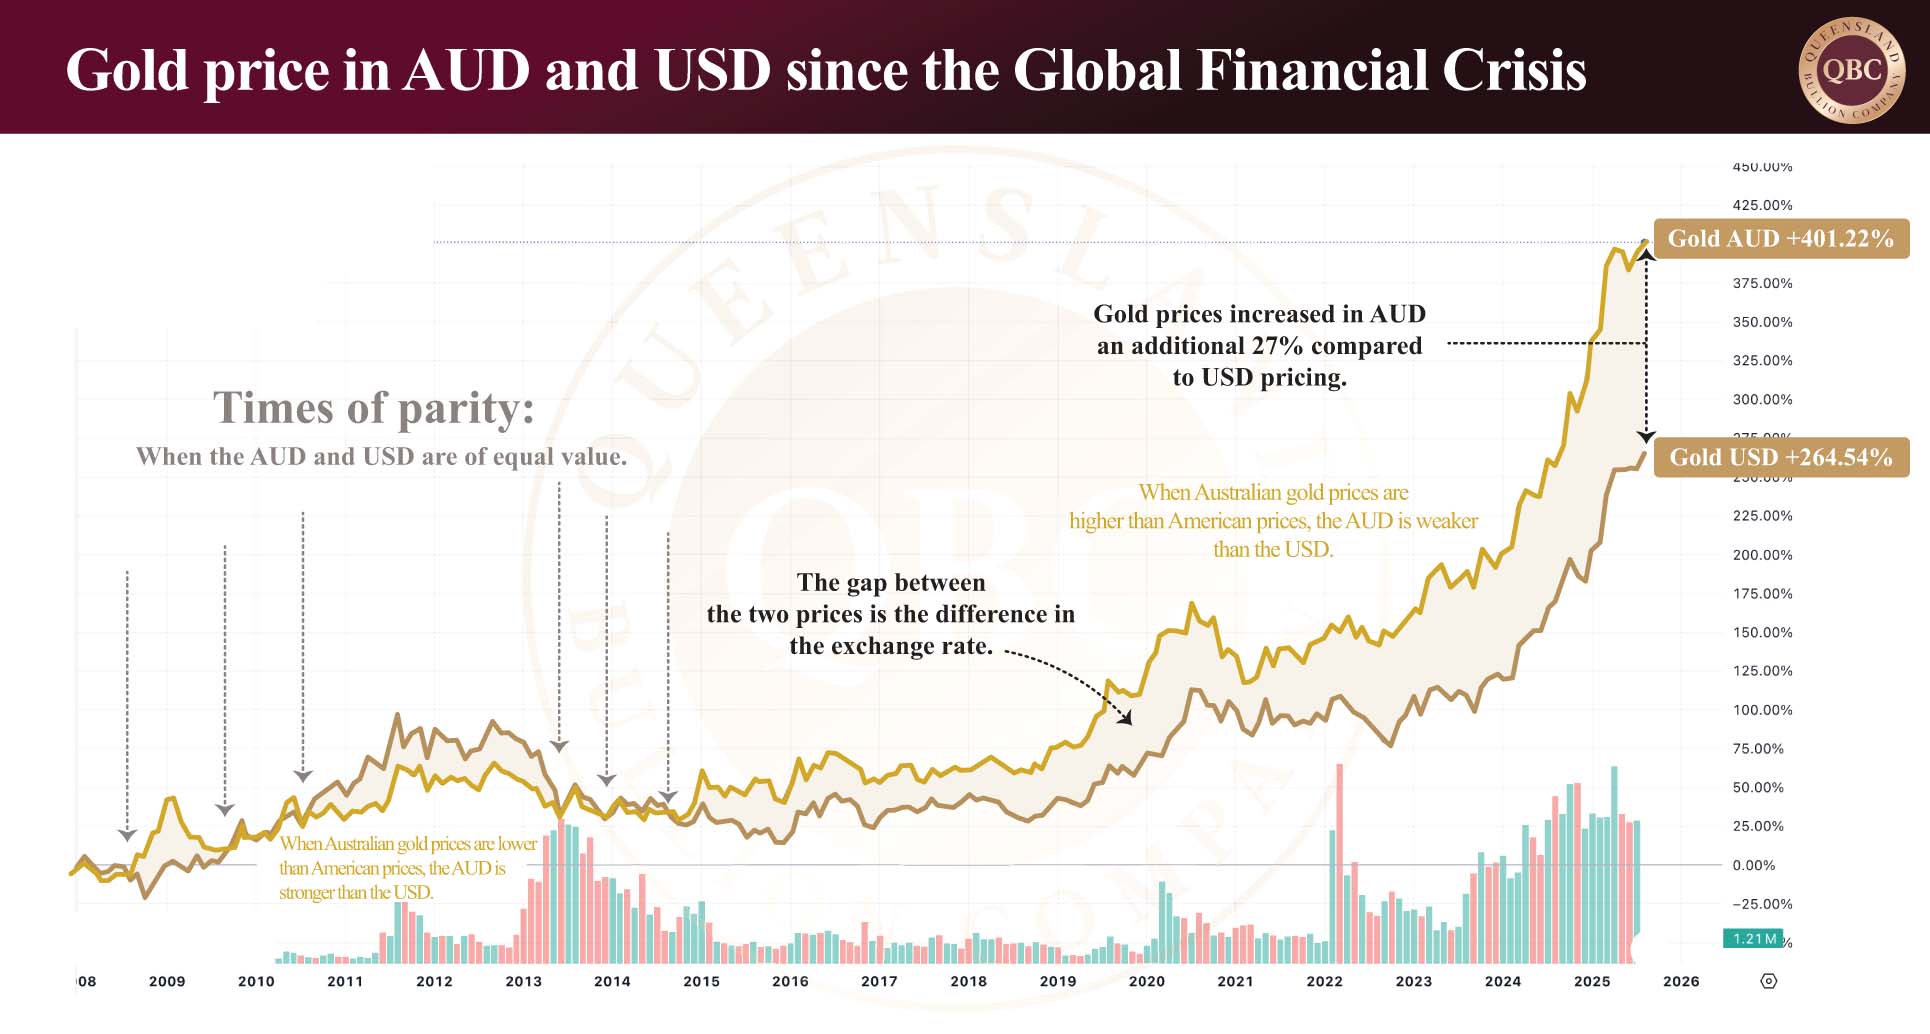
For example, if gold was to remain steady in USD and the Australian dollar weakens against the U.S. dollar, more local currency is needed to purchase the same amount of metal. Hence it increases in Australian dollars.
Gold crisis case study two: the Covid 19 Pandemic Era, the shock and the surge
The COVID financial crash of March 2020 initially hit all asset classes, including gold and silver. But by mid-year, gold had broken through AUD $2,700 for the first time, with the gold price in American dollars also reaching unprecedented highs. Massive global stimulus, near-zero interest rates, and fears of long-term inflation turbocharged the move. This time gold initially increased as the stock market crashed, providing protection for those investing in safe haven assets; however, it did eventually correct as the pandemic unfolded and then travelled sideways until the end of 2022 when it started its current climb to new heights.
So why was this time different? Simply put, markets were unable to play out the expected way due to government interference. The purpose of the interference was to maintain confidence in the economy and it worked: Australia avoided a formal recession that many parts of the world endured. In this time the government gave away free money through a raft of measures such as Job Keeper payments, Job Seeker supplements, cash flow boosts for businesses, early access to Superannuation, cash payments to households, home-builder grants, loan guarantees and more. Similarly, the Reserve Bank of Australia engaged in quantitative easing measures such as bond buy backs, cheap funding for banks, and record low rates.
While every government aims to avoid recession, the cost shows on the RBA’s balance sheet. From AUD $180 billion, it ballooned to $640 billion at the height of the pandemic by early 2022. It is a similar story in the U.S. To learn more about the Federal Reserve’s predicament read our article, The Fed is Boxed In While Gold and Silver Look Ready to Fly. While quantitative easing was employed after the GFC, the significance of its use during Covid is its cumulative effects. Neither balance sheets for the RBA or the Fed are as healthy as pre-GFC and the Covid 19 Pandemic Era conditions. It has been exacerbated despite attempts to curb the debt. The problem with holding too much debt is that eventually markets will lose confidence in the RBA or the Feds ability to honour their debt obligations which leads to a precarious financial position that could end in an almighty shakedown in various sectors of the economy.
Precious metals in 2025: consolidation or take off?
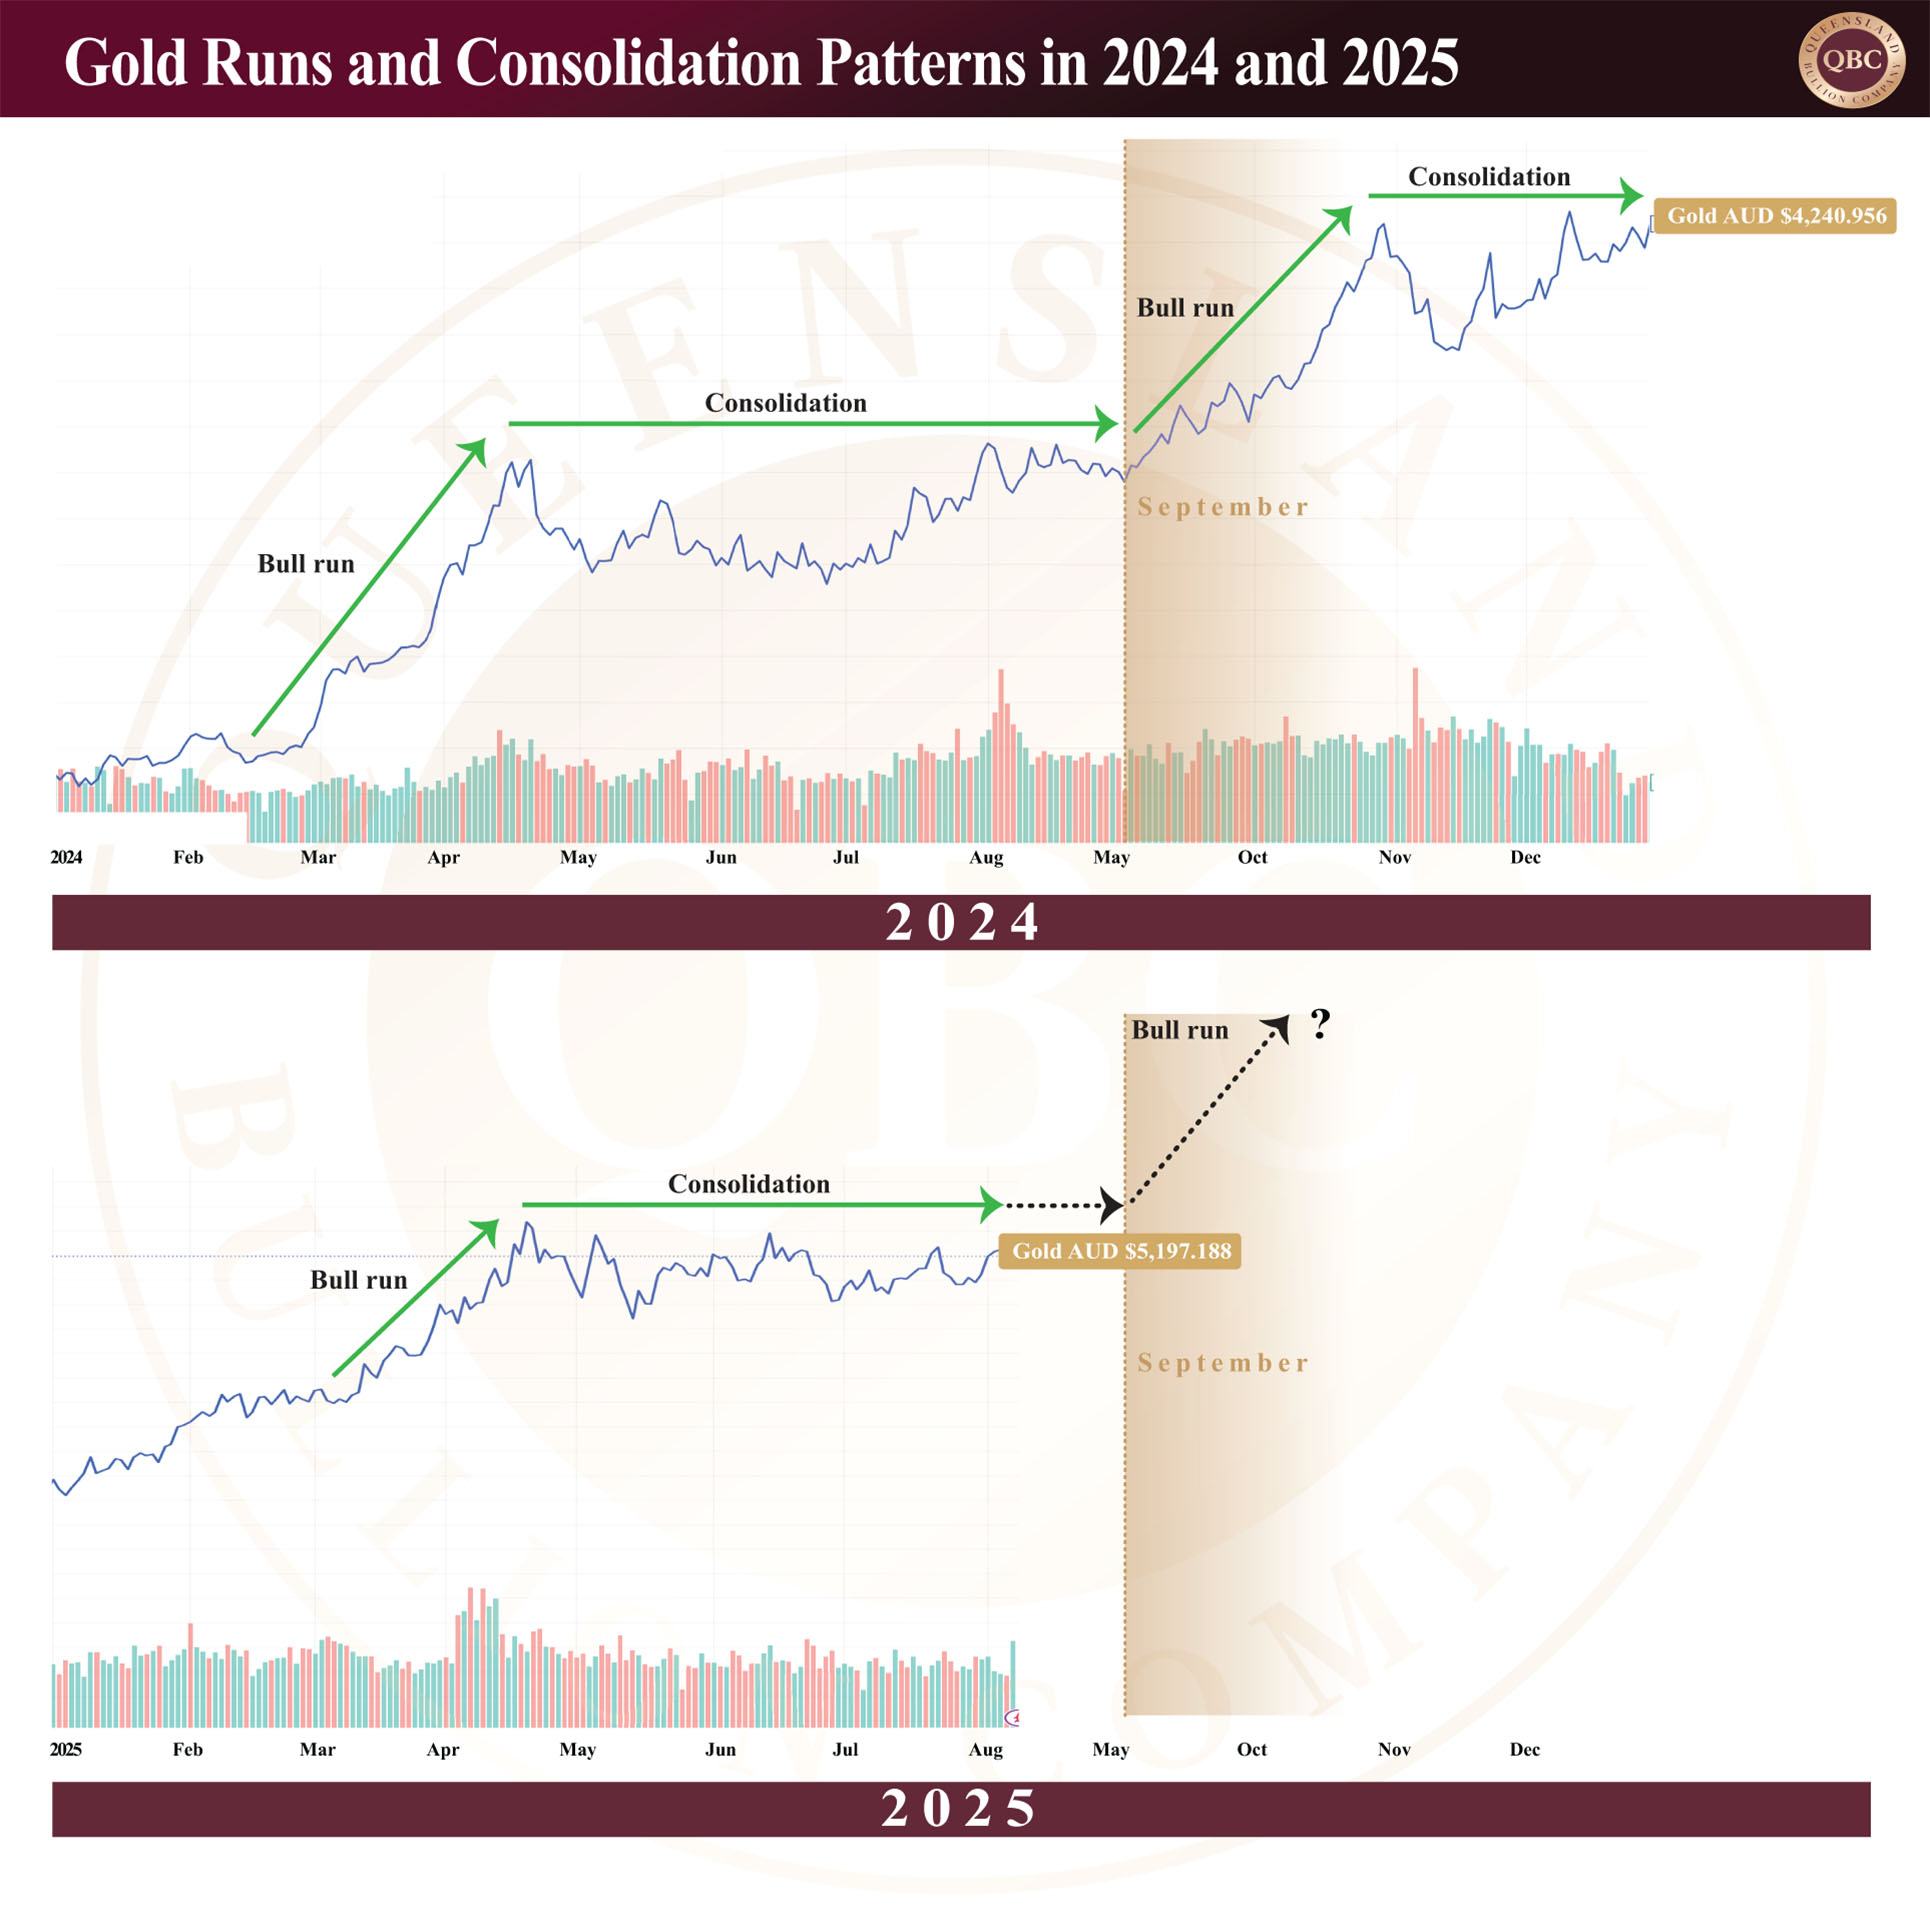
Today, gold and silver are again in focus but under different conditions. Gold in AUD terms has climbed over 400% since 2008, while silver is up over 280%. Technical data indicates a strong upward channel for gold, with repeated breakouts followed by consolidations, suggesting a healthy bull market rhythm. Furthermore, a comparison between 2024 and 2025 reveals striking symmetry, where both years saw explosive moves into April followed by mid-year consolidation, setting the stage for potential spring breakouts. We first predicted this in May and the three months since has proven the theory to be true.
Silver’s technical analysis is also compelling. The recent push above AUD $58 comes after a bullish recovery from $56.18. Historical patterns show that silver tends to outperform gold in the final stages of a bull cycle. The gold-to-silver ratio, now around 1:88, remains far above historic norms such as 1:60 – 70, or the 2024 ratio of what is coming out of the ground at 1:15, implying further upside for silver if a true bull leg begins.
The Broader Market Context
Compared to the equity markets, gold and silver have offered resilience, but not the staggering gains of tech-heavy indices. The NASDAQ has risen over 1,173% since the 2008, while gold has increased 403% in AUD and 266% in USD. However, such growth in equities comes with significant risk, especially as the current cycle nears what the 18.6-year economic model identifies as the “Winner’s Curse” phase: the euphoric end of expansion before correction. For example, the NASDAQ (tech stocks) has expanded almost six times faster than the M2 money supply (current cash available in America). This indicates that the NASDAQ is probably at the top end of valuations. Those invested in tech stocks may feel constrained if the financial corrections are quick and violent, whereas real estate investors are more likely to experience a slow burn as capitulation unfolds in stages over time.
With global debt at record levels and central banks approaching the end of their tightening cycles, conditions are ripe for a return to the monetary expansion playbook, one that historically favours precious metals. If rate cuts resume and inflation expectations rise, the setup may mirror the post-GFC years (early 2010s), where metals staged strong gains in response to policy shifts.
Final Thoughts
History does not repeat, but it often rhymes. During both the GFC and COVID, gold and silver offered protection. As we approach another inflection point, facing economic fragility, shifting rate expectations, and historically strong technical setups, precious metals may once again be poised to outperform. With September approaching, which is traditionally viewed as crash season in the stock markets, the coming months may determine whether gold and silver are simply pausing… or preparing to leap.