Posted on

The AI Financial Ecosystem: Fragile or Foundational?

Artificial intelligence may prove to be the defining technological development of our generation.  The productivity improvements, scientific discoveries and new industries it could create are difficult to quantify because the technology remains at such an early stage of adoption.  Yet the extraordinary expectations surrounding AI have already produced something that can be measured: one of the largest investment cycles in financial history.

Hundreds of billions of dollars are flowing into semiconductors, data centres, cloud infrastructure and AI companies.  NVIDIA estimates that four trillion US dollars could ultimately be invested (combined effort) in AI infrastructure before the end of the decade (conservatively speaking), while the five largest hyperscalers are expected to spend extraordinary amounts expanding computing capacity.  The important question for investors is increasingly not simply how much money is being spent, but where that money is coming from and where it subsequently goes.  The largest technology companies (for example Microsoft, Amazon, Alphabet) are investing in AI developers by way of cloud computing purchases, AI developers purchase NVIDIA processors, and NVIDIA itself is investing billions into companies that ultimately require its hardware for example Microsoft, Amazon, Alphabet).  One company’s expenditure is increasingly becoming another company’s revenue, which can then help justify further investment back into the same financial ecosystem.

Against this extraordinary concentration of capital, precious metals provide an interesting comparison.  At the time of writing gold trades at approximately AUD $6,123 per ounce, silver AUD $93.77 per ounce and platinum AUD $2,620 per ounce.  These markets operate very differently from the increasingly interconnected AI investment system.


What is circular trading?

 Circular trading traditionally describes securities or other assets being repeatedly bought and sold between a group of parties, potentially creating the appearance of greater market activity, liquidity or demand than genuinely exists.  In its more problematic forms, coordinated circular trading can become a form of market manipulation because essentially the same economic interest is repeatedly transferred without genuine independent demand.  Moreover, every bubble offers historical examples of its use to make money for a small group of people.

That is not an accurate description of what the major AI companies are doing.  Real capital is being invested, real processors are being manufactured, real data centres are being constructed and real computing services are being consumed.  The developing AI ecosystem is better described as circular financing, reciprocal investment and commercial interdependence.  The concern is not that transactions are fictitious, but that the investors, customers and suppliers increasingly overlap, limiting the stakeholders.

Consider the relationship between Microsoft, NVIDIA and Anthropic.  In November 2025, NVIDIA committed to invest up to USD $10 billion in Anthropic while Microsoft committed another USD $5 billion.  Anthropic simultaneously committed to purchase USD $30 billion of Microsoft Azure computing capacity, initially using up to one gigawatt of capacity powered by NVIDIA systems.  Microsoft therefore invests in Anthropic, Anthropic spends money with Microsoft, and Microsoft purchases the infrastructure required to provide that computing capacity, including NVIDIA technology (who invested in Anthropic).

OpenAI provides an even larger example.  In February 2026, OpenAI announced USD $110 billion in new investment, including USD $50 billion from Amazon, USD $30 billion from NVIDIA and USD $30 billion from SoftBank.  OpenAI simultaneously expanded its relationship with Amazon and secured next-generation NVIDIA computing infrastructure.  By the end of March, the funding round had grown to USD $122 billion in committed capital.  Amazon’s relationship is particularly illustrative because it is simultaneously an investor and infrastructure provider, while OpenAI has committed to consume substantial Amazon Web Services (AWS) computing capacity.  These are legitimate strategic partnerships with obvious commercial logic.  Nevertheless, they create a web of relationships in which the distinction between investor, supplier and customer is becoming increasingly blurred.


Does circular AI investment obscure true demand?

This does not mean AI demand is artificial.  OpenAI has reported enormous consumer adoption, while cloud providers continue to report expanding AI workloads.  NVIDIA’s latest results similarly indicate demand extending beyond the largest hyperscalers into AI laboratories, enterprises and sovereign customers.  There is therefore considerable evidence that genuine demand exists.

The more difficult question is how much of today’s extraordinary AI demand is ultimately being driven by end users, and how much is being supported by capital circulating between the companies building the AI ecosystem.  If a technology company invests billions into an AI developer, which subsequently uses part of that capital to purchase computing capacity from the investor or hardware produced by another investor, genuine transactions and revenue are generated; however, some of that demand is being supported by capital originating within the same relatively concentrated ecosystem.  This distinction becomes increasingly important as valuations depend upon continued revenue growth.  Hyperscaler capital expenditure creates revenue for semiconductor manufacturers such as NVIDIA.  NVIDIA’s rapidly rising revenue reinforces expectations of extraordinary AI demand, supporting valuations across all semiconductor and AI-related companies.  Those valuations can improve access to capital, which finances additional infrastructure and investment, creating further orders for processors and cloud capacity.  The cycle can therefore become self-reinforcing.

There is nothing inherently unsustainable about this if end-user demand ultimately grows sufficiently to justify the current infrastructure buildout.  Railways, electricity networks and the internet all experienced periods when infrastructure investment ran ahead of immediate demand, yet the infrastructure subsequently supported enormous economic development.  The vulnerability appears if investment continues expanding faster than the revenues ultimately available from consumers outside the investment loop.  A second vulnerability exists in the fact that, unlike railways, electricity networks and the internet where infrastructure can last multiple decades, the life span of the infrastructure for an AI buildout has a lifespan of about two to five years maximum.  That is the lifespan of the extraordinary amount being invested into the AI space currently.


How important is NVIDIA to the AI financial ecosystem?

Few companies illustrate the scale of the AI boom better than NVIDIA.  Once primarily associated with graphics processors, NVIDIA has developed into the dominant supplier of the accelerated computing infrastructure underpinning modern AI.  Its processors, networking equipment, systems and software now form part of the infrastructure used by major cloud providers, AI laboratories, enterprises and governments.  The company’s financial growth has been extraordinary.  For the three months ending 26 July 2026, NVIDIA reported revenue of USD $96.2 billion, an increase of 106% from the corresponding period a year earlier.  Data Centre revenue alone reached USD $89 billion, increasing 117%.  NVIDIA expects approximately USD $108 billion in revenue for the following quarter.  Its GAAP gross margin reached 75%, while quarterly net income was almost USD $59.7 billion.

NVIDIA also reported that the cloud industry’s backlog now exceeds USD $2 trillion, while capital expenditure among the five largest hyperscalers is expected to approach USD $800 billion in 2026 and USD $1.3 trillion in 2027.  NVIDIA is therefore not merely selling processors into the AI boom.  It occupies a critical position through which an enormous proportion of the industry’s infrastructure expenditure passes.  Yet NVIDIA is increasingly doing something else: helping to finance the ecosystem that buys its technology.  Its investments in companies including OpenAI and Anthropic mean NVIDIA is not simply benefiting from rising AI expenditure but is also providing capital to businesses whose expansion requires enormous amounts of computing infrastructure.  NVIDIA’s latest financial disclosures also demonstrate that its investment activities have become substantial alongside its operating business.

This creates an unusual position.  NVIDIA can be a hardware supplier to a cloud provider, an investor in an AI company using that cloud provider and a beneficiary when increased AI demand causes the cloud provider to purchase additional NVIDIA infrastructure.  Each transaction has a legitimate commercial purpose, but collectively they demonstrate why NVIDIA has become integral to the web of relationships supporting the AI capital cycle.


What happens if one part of the AI system weakens?

This is where interdependence becomes vulnerability.  The Magnificent Seven and other leading AI companies are often discussed as separate investment opportunities, yet their earnings are increasingly connected.  One company’s capital expenditure becomes another company’s revenue, while one company’s investment can finance another company’s expenditure.  Things can become intense when you consider that, if revenue is soft for a particular quarter, pre-selling can change the figures on a cash basis even though goods and services have not been deployed.

Imagine that a major AI developer discovers that customer revenue is growing considerably more slowly than anticipated.  It may respond by reducing planned computing expenditure.  The cloud provider expecting that demand could then reduce future data-centre expansion.  Lower infrastructure spending means fewer orders for NVIDIA processors, networking equipment and associated components.  NVIDIA’s expected revenue growth could subsequently be revised lower, affecting its valuation and potentially sentiment towards semiconductor companies more broadly.  If investors interpret that slowdown as evidence that expected AI returns have been overestimated, valuations across cloud providers, data-centre operators and AI-related companies could also adjust.  The circularity that reinforces growth can therefore operate in reverse.

This matters beyond technology because these companies now occupy an extraordinary position within global equity markets.  As discussed in our previous analysis, more than half of the increase in S&P 500 market capitalisation between 2021 and 2025 came from the Magnificent Seven, while concentration among the largest US companies has reached historically elevated levels. A serious repricing of AI expectations would consequently not remain confined to a handful of technology stocks.  It could affect major sharemarket indices, retirement portfolios, international investors and confidence across other risk assets.


Can AI change the world without every investment succeeding?

Perhaps this is the most important distinction for investors.  The debate should not be reduced to whether AI is a bubble or whether AI will change the world.  Both questions can have very different answers.  A transformative technology does not guarantee that every company developing it will justify its valuation, nor does a market correction invalidate the technology itself.  The vulnerability in today’s AI ecosystem comes from concentration and interdependence.  NVIDIA’s extraordinary growth depends partly upon hyperscalers continuing their unprecedented infrastructure spending.  Hyperscalers increasingly depend upon AI developers and customers using that infrastructure.  AI developers depend upon continuing access to enormous amounts of capital and compute.  Investors, meanwhile, have already assigned substantial valuations on the expectation that the resulting revenue will eventually justify the expenditure, but will it?  Pioneering companies do the heavy lifting, but that does not necessarily equate to success.

For precious metals investors, the contrast is unusually clear.  Gold and silver do not need a hyperscaler to expand capital expenditure, another company to raise billions of dollars or a customer to purchase enough computing capacity to validate an earlier investment.  Physical bullion has no management team directing capital into another company, no earnings forecast dependent upon a strategic partner and no interconnected corporate balance sheet through which financial stress can migrate.  That does not make precious metals immune to market volatility, nor does it diminish the extraordinary potential of artificial intelligence.  It simply places them at the opposite end of the structural spectrum.  The AI financial ecosystem is becoming more centralised, concentrated and mutually dependent as enormous amounts of capital circulate through a relatively small group of companies.  Physical precious metals remain decentralised assets whose existence and ownership are independent of that corporate network.

If AI fulfils its promise, the companies building it may create extraordinary wealth.  If expectations falter, however, the same web of relationships that has accelerated the boom could equally transmit disappointment with remarkable efficiency.  The greatest strength of the AI investment cycle may be how effectively its participants reinforce one another.  Its greatest vulnerability may prove to be exactly the same thing.

Posted on

Financial Collapse Part 2: Bathla, Financial Stress and the Real Economy

balance sheet graph

In Part One  of this series, we examined five warning signs that could leave global financial markets increasingly vulnerable to a global economic collapse.  Instability in the yen carry trade, rising sovereign debt and bond yields, concentrated equity markets, weakening global property prices and persistent inflation may appear to be separate issues, but they are connected through the same financial system.  Currency movements can affect bonds, bond yields influence borrowing costs and asset valuations, while persistent inflation can restrict the ability of central banks to reduce those costs when economic conditions deteriorate. While gold trades at $6,112, silver at $91.34, and platinum at $2,503, the global financial house of cards continue to balance for the moment.

Australia’s property market is particularly important within this equation.  While real house prices have been falling across several major economies, Australian property has remained unusually elevated.  McKinsey Global Institute estimates Australian real estate is worth approximately 4.5 times GDP, while household real estate relative to GDP sits around 80 percentage points above its 25-year average.  Higher interest rates, elevated construction costs and deteriorating affordability are now testing that resilience.  Recent data shows the national average declined over 3% in the last quarter.  Australian property developer, Bathla Group just entered voluntary administration.  As such, it provides a real-time case study of what can happen when some of these pressures begin colliding and how financial stress can move from property into credit markets, investment funds, businesses and ultimately Australian households.

What Happened to Bathla Group?

Bathla Group is one of New South Wales’ largest residential property developers since its establishment in 1997, particularly across Western Sydney.  The group entered voluntary administration in August 2026 after experiencing mounting financial pressure, attributing its difficulties to a combination of softer property sales, government policy changes and rising construction costs.  Media reports indicate that the entity carried combined liabilities of approximately AUD $3.5 billion as at 30 June 2025, with much of that money reportedly owed to private creditors.

Bathla’s circumstances illustrate an important distinction between asset value and liquidity.  Property development requires continual access to capital because land, interest, materials and contractors must often be paid years before completed properties are sold.  When sales weaken while construction and financing costs remain elevated, even a developer controlling substantial assets can experience difficulty meeting immediate financial obligations.  This also illustrates the inflation problem discussed in Part One.  In addition to pushing the cost of raw materials up, if elevated inflation prevents interest rates from falling significantly, highly leveraged sectors cannot necessarily rely upon cheaper finance arriving when economic conditions deteriorate.


How did Bathla’s problems reach the retail investors?

Perhaps the most significant feature of the Bathla case is its connection with Australia’s growing private credit market.  Private credit is lending arranged outside the traditional banking system.  Developers increasingly obtain finance from non-bank lenders and investment funds, where investors provide capital that is subsequently lent to borrowers in return for comparatively high rates of interest.  The relationship is straightforward: one party’s debt is another party’s asset.  If a developer encounters difficulty repaying a loan, the problem can therefore migrate from the borrower to the lender and ultimately to the investors providing the capital.

Bathla reportedly borrowed from numerous private credit providers, including Centuria Capital, La Trobe Financial, CVS Lane Capital Partners and Ray White Capital, while around forty private credit funds have reportedly had exposure to the group.  Concerns surrounding Bathla subsequently contributed to redemption requests from investors, with Centuria restricting withdrawals from two affected vehicles and CVS Lane later restricting redemptions from two funds after confirming exposure through multiple loans.

This demonstrates how quickly a credit problem can become a liquidity problem.  Property loans cannot necessarily be sold immediately at full value simply because investors want their money returned.  If withdrawal requests accelerate, funds may need to restrict redemptions, sell assets or raise liquidity elsewhere.  It does not mean those funds will necessarily suffer permanent losses, but it provides a clear example of the interconnectedness discussed throughout Part One:

Property developer → private lender → investment fund → retail investor.


Could property stress spread further?

Bathla does not represent a banking crisis, nor is there evidence that Australian banks are facing conditions comparable with the GFC at this point; however, financial stress does not need to bankrupt a bank before it begins affecting the wider economy.  Private lenders facing losses or redemption pressure can tighten lending standards, increase borrowing costs, demand additional security or reduce new lending.  Developers with no connection to Bathla can consequently find finance more difficult or expensive to obtain.

The risk becomes greater if credit conditions tighten while property values are falling.  As examined in Part One, real global house prices fell 1.2% year-on-year in the first quarter of 2026 while Australia has so far resisted much of that international adjustment.  Australian property nevertheless remains unusually elevated and signs of softer conditions are beginning to emerge.  For a leveraged developer, weaker sales can reduce revenue while interest continues accumulating on borrowed capital.  Falling property values can simultaneously reduce the value of the collateral supporting those loans.  This is why leverage can transform an ordinary correction into something considerably more serious: the value of the asset can fall while the debt remains.  This is the case for single home owners and property developers alike.


How does a multi-billion-dollar corporate problem reach Australian families?

This is where Bathla provides perhaps its most important lesson.  Tradespeople working on Bathla developments have reportedly pursued payment for work already completed.  In one particularly confronting incident before the administration, a bricklayer took the situation into his own desperate hands and demanded payment in a way that incurred significant occupational health and safety issues for all concerned.  The incident illustrates the considerable personal pressure that financial hardship can create.  It would behove us at this point to acknowledge the full cost of a severe financial correction to society can extend well beyond money and assets, affecting livelihoods, mental and physical health, relationships, lifestyle, and not least the way the next generation is brought up.  An unpaid invoice is not simply an entry in a creditor register to a sub-contracting small business, their employees and families.  Returning to Bathla’s voluntary administration, suppliers and employees are affected while homebuyers waiting for unfinished properties may continue paying rent, storage and other expenses while their housing remains uncertain.

The financial chain can therefore extend much further than the original company:

Property developer → lender → investor → contractor → employee → household.

This is how a financial correction moves into the real economy.  Australia’s particularly high exposure to property makes that transmission important.  For many households, their home is their largest asset and their mortgage their largest liability.  If property values decline while mortgage repayments remain elevated, households may reduce discretionary spending, weakening revenue for businesses and potentially affecting employment.  Financial stress that begins in the real estate sector can therefore reach people and businesses with no direct connection to the original development.


What does Bathla tell us about the warning signs of an economic collapse?

Bathla cannot be directly connected with every warning sign examined in Part One and attempting to do so would overstate the case.  It has little direct relationship with AI valuations or the yen carry trade.  What it does illustrate is the mechanism through which several apparently separate vulnerabilities can become connected.  Part One examined a financial system in which currency movements can affect bonds, bond yields influence the cost of capital, borrowing costs influence property and businesses, and persistent inflation can prevent central banks from quickly reducing those costs when economic conditions deteriorate.  Bathla brings that mechanism down to ground level.  A leveraged property developer encounters pressure while sales soften and construction and financing costs remain elevated.  Its debt connects those difficulties to private lenders, those lenders connect them to investors, and the company’s obligations simultaneously connect it to contractors, employees and homebuyers.  This is why vulnerabilities matter before a financial crisis occurs.  They do not necessarily cause the initial shock, but they can determine how far that shock travels.


What can Australian investors learn from Bathla? 

One important lesson is that diversification should be measured by underlying exposure rather than simply by the number of investments held.  An Australian investor could own residential property, shares in major banks, units in a private property credit fund and property-related investments through superannuation.  These appear to be different assets, yet each may depend to varying degrees upon healthy property values, functioning credit markets, financially secure households and continued access to capital.

Counterparty risk, leverage and liquidity are equally important.  Many investments ultimately depend upon another borrower, company, fund manager, bank or government fulfilling an obligation.  Investors with manageable debt and readily accessible liquidity generally have more flexibility when financial conditions deteriorate than those forced to sell assets to meet immediate obligations.

Physical gold and silver occupy a different position within this structure.  Precious metals can fluctuate substantially in price and should not be regarded as protection against every financial outcome; however, physical bullion owned outright does not typically have third party risk. It does not require a developer to complete a project, a borrower to repay a loan, an investment fund to honour a redemption request or a government to refinance its debt.  That independence is one reason physical precious metals have historically formed part of wealth-preservation strategies during periods of financial instability.


Financial corrections never remain confined to financial markets

 Bathla remains an unfolding situation.  Voluntary administration does not automatically mean liquidation, and until the company’s ultimate outcome is known it would be premature to assume the magnitude of loss faced by creditors, investors, contractors or homebuyers.  Nor should the difficulties of one developer be treated as evidence that Australia’s property market is about to collapse.  The significance of Bathla lies instead in what it reveals about financial interconnectedness.  A property problem can become a credit problem.  A credit problem can become a liquidity problem.  That pressure can subsequently reach investors, businesses, employees and households.  This is the real-world counterpart to the warning signs examined in Part One.

The objective for investors is therefore not to predict the precise trigger or date of the next major financial correction.  It is to consider whether their financial position can withstand one if it arrives.  Diversification, manageable leverage, sufficient liquidity and an understanding of counterparty exposure can appear unnecessarily cautious while asset prices are rising, but their value becomes considerably more apparent when conditions move in the opposite direction.  Preparation is ultimately about building a financial position that does not depend upon everything going right at the same time.

Posted on

Financial Collapse Part 1: Five Warning Signs

Over the past three decades, Australian investors have endured the dot-com collapse, the Global Financial Crisis (GFC), the Covid 19 Pandemic market shock and numerous smaller corrections.  Each arrived under different circumstances and the event that ultimately triggered the sell-off was generally easier to identify in hindsight.  Financial crises rarely become destructive because of one indicator alone.  In 2026, several vulnerabilities are appearing simultaneously.

McKinsey Global Institute estimates that global household net worth reached a record USD $570 trillion in 2025, equivalent to around 4.8 times global GDP.  Yet only 20% of the increase in household wealth that year came from net new investment, with nearly 60% attributed to rising asset values and other forms of “paper wealth”.  At the time of writing, gold trades at approximately AUD $6,215 per ounce, silver at AUD $93.07 per ounce and platinum at AUD $2,537.72 per ounce.  Against this backdrop, there are five warning signs Australian investors should watch closely.


  1. Could an unwind of the Yen carry trade destabilise global markets?

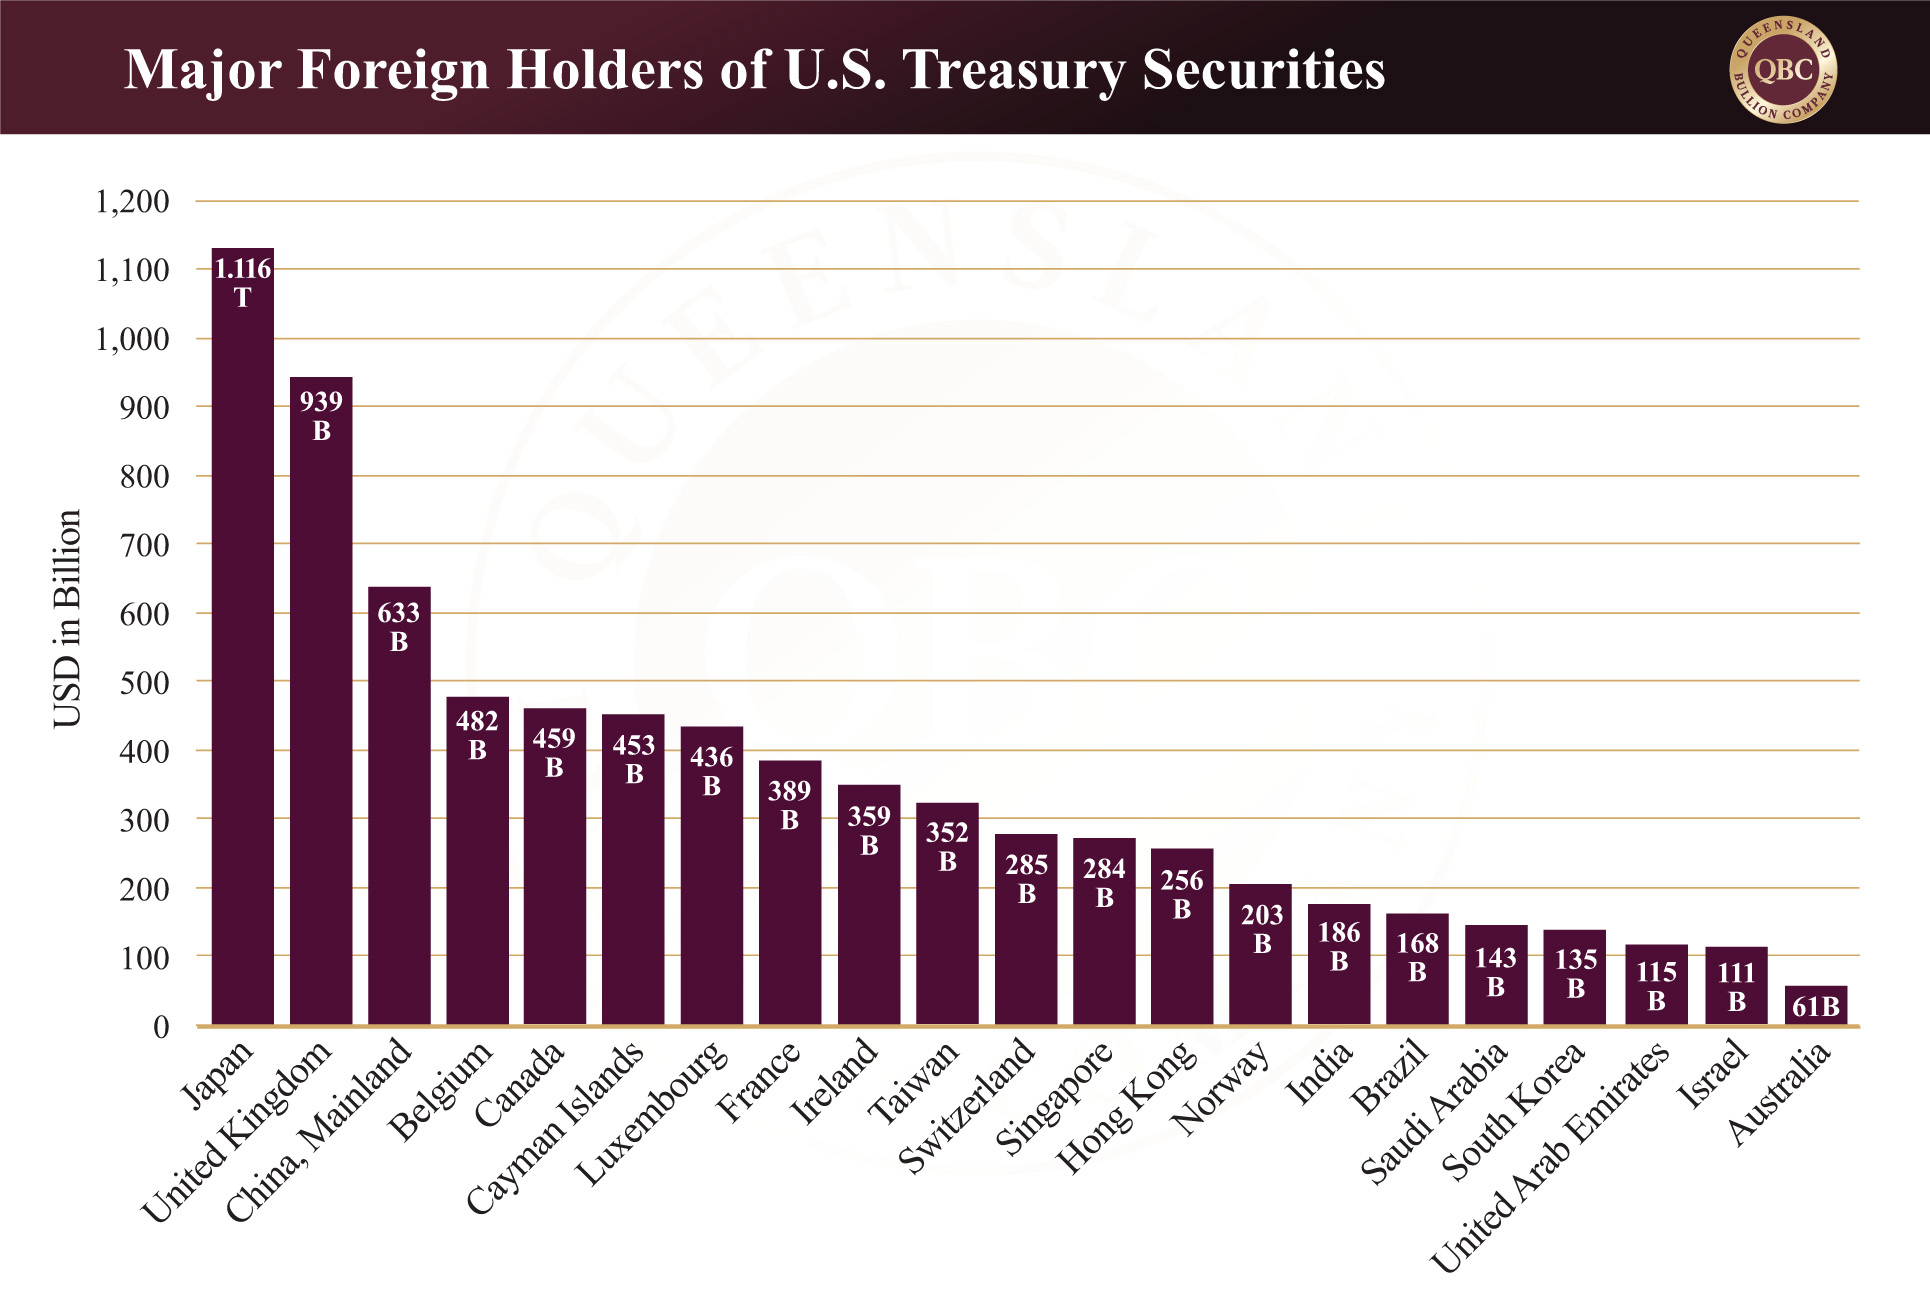
As examined recently in our two-part series on the Yen Carry Trade, decades of extremely low Japanese interest rates encouraged investors to borrow cheaply in yen and invest in higher-yielding assets overseas. The strategy becomes vulnerable when Japanese borrowing costs rise or the yen appreciates sharply, potentially forcing leveraged investors to sell foreign assets and repurchase yen to close their positions.  Japan is also one of the world’s largest holders of US Treasuries, creating an important connection between Japanese currency policy and the American bond market.

The precise size of the carry trade is impossible to determine because exposure exists across banks, funds, derivatives and private investors.  It has been estimated to be around the vicinity of USD $20 trillion and while the amount is staggering, what matters more is its reach.  A disorderly unwind could reach into multiple countries via institutional investment in currencies, bonds and equities simultaneously, making instability in the yen one of the riskiest sources for global financial systems.  Recent US-Japan intervention to stabilise the yen demonstrates how seriously policymakers regard instability in the currency.  This is the first time the White House has intervened in the yen since 1998.  Of this century, Japan has intervened eight times, twice after the GFC (in 2010 and 2011), and since the start of the Covid 19 Pandemic Era it has intervened another six times in four years.  Is this a sign that the Yen carry trade is reaching a potential pain point?  Many indicators suggest it is.


  1. Are government debt and bond yields becoming harder to manage?

The second warning sign sits in sovereign debt markets.  In 2025 Government debt exceeded 100% of GDP in Japan, Italy, the United States, France, Canada, Belgium, the United Kingdom and Spain.  Higher interest rates make those liabilities increasingly important because governments can no longer assume they will continually refinance enormous debt burdens at low rates.

The United States Treasury market is particularly important because of the enormous exposure of foreign governments and institutions to US sovereign debt.  During August, the 10-year Treasury yield repeatedly approached 4.7%, while the 30-year yield has remained above 5.2% since May.  What makes these levels particularly noteworthy is their historical precedent.  In the two years preceding the GFC, both yields repeatedly reached similar levels.  Nearly two decades later, the same warning signs are re-emerging, with the 10-year yield repeatedly testing 4.7% over the past three years and the 30-year yield once again moving above 5%.  When bond yields rise above 5% this can raise a red flag for institutional investors who may lose confidence in fiscal governance.  Currently, markets give the 10-year bond yield a 33% of reaching 5% by the end of the year.  With US federal debt having breached USD $40 trillion in August 2026, higher yields can substantially increase the cost of refinancing government liabilities while also placing upward pressure on mortgages and corporate borrowing costs.  The recent announcement that the Treasury will increase its buybacks by double or even more may improve liquidity within particular parts of the bond market, but they do not eliminate the underlying debt.  If investors eventually demand structurally higher returns to justify the perceived risk of absorbing increasing Treasury supply, the consequences could extend well beyond the US Government.


  1. Have global share markets become too expensive and concentrated? 

Equity markets provide another warning sign.  McKinsey estimates equity values reached approximately 3.8 times GDP in Canada and 3.7 times GDP in the United States, with US valuations nearly double their historical average.  The United States also accounts for almost half of the equity value across the major economies examined, while more than one-third of US equity liabilities are owed to foreign entities.  Like fascia that connects every muscle in the body together, American stocks also form a web throughout the global financial system, reaching into and influencing almost all major economies in the public and private sectors alike.

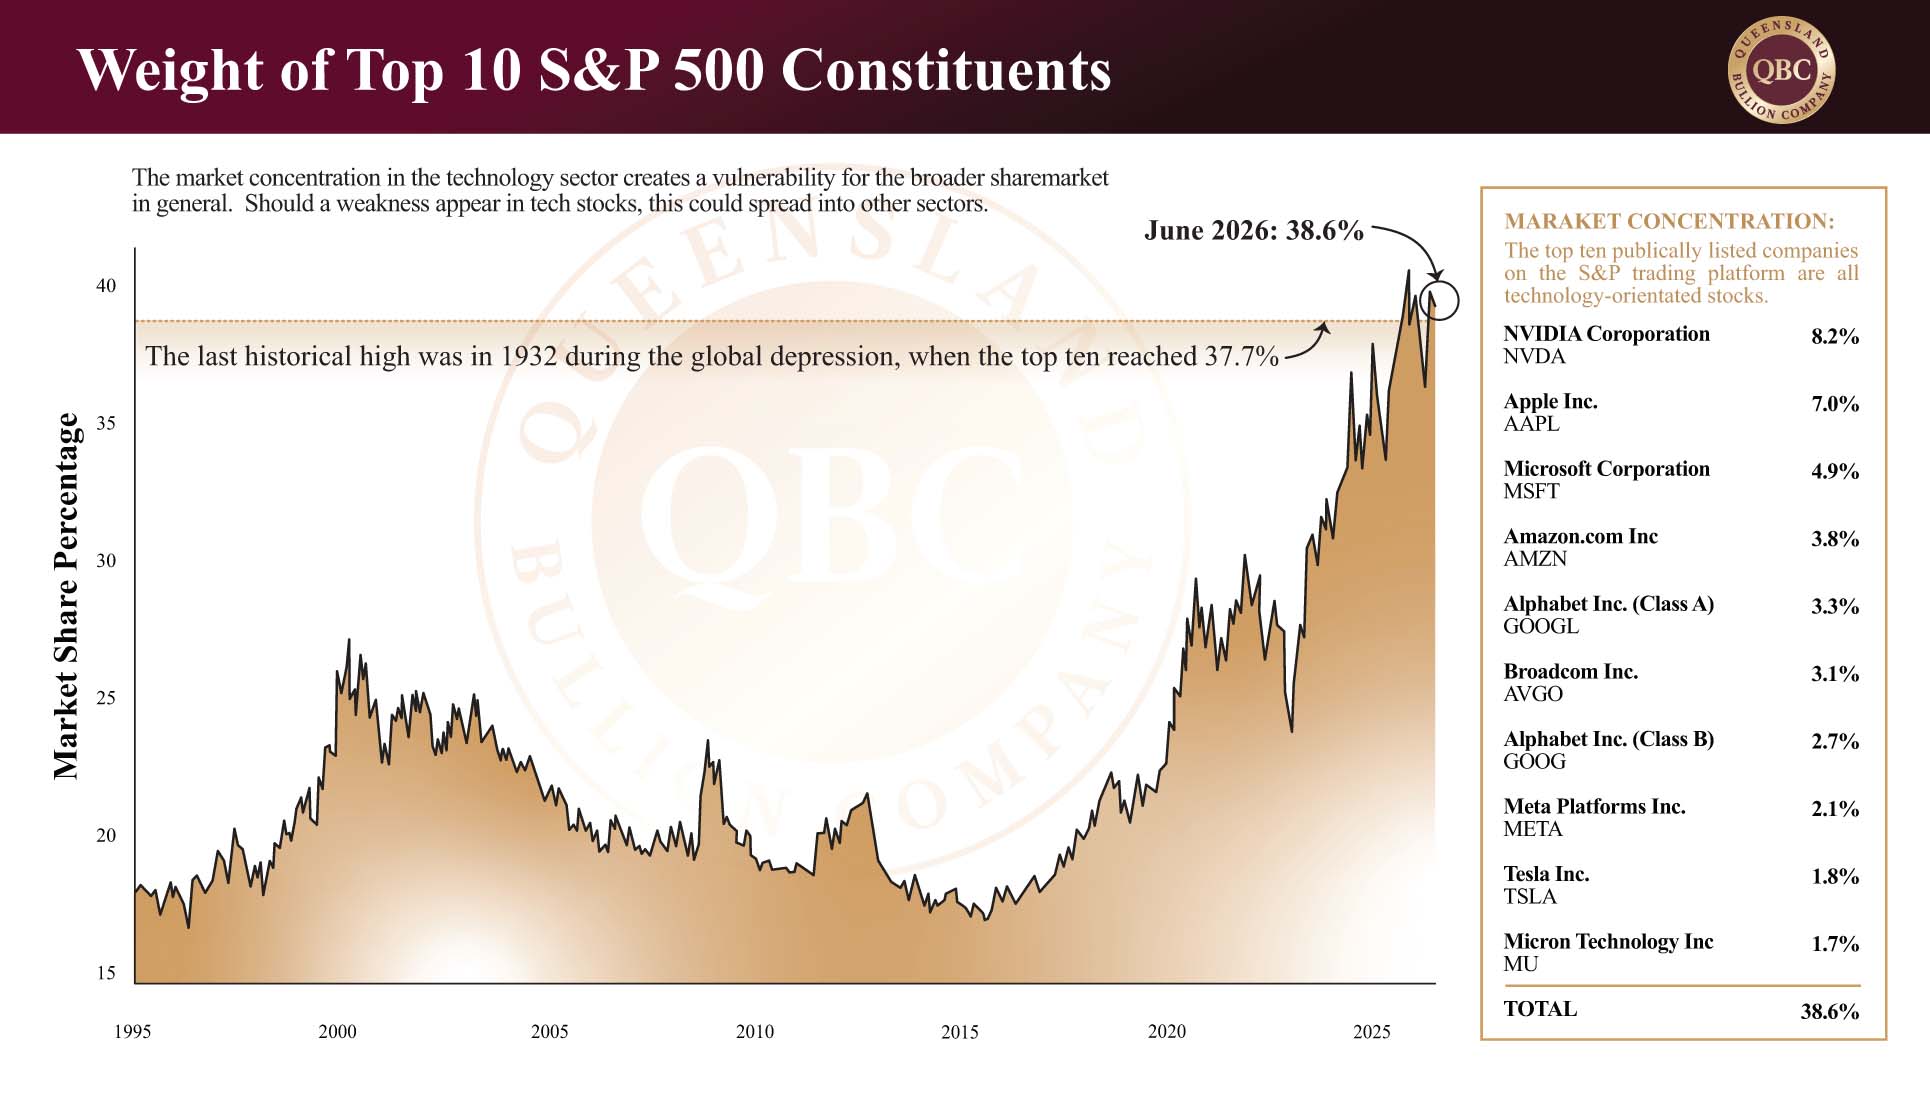
Concentration within the US market has also increased.  More than 50% of the growth in S&P 500 market capitalisation between 2021 and 2025 came from the Magnificent Seven (all technology-orientated companies), reflecting extraordinary investor enthusiasm surrounding artificial intelligence.  This does not mean AI itself is a bubble.  The question is whether current valuations have already incorporated too much future growth (read more on this here).  Currently the top ten publicly traded companies account for more than 37% of the stock market.  This type of concentration of capital has not been seen since the 1930s Great Depression Era and creates a significant vulnerability.  Should a weakness eventuate in this sector (such as a significant correction to an overvalued market), the repercussions for the entire US stock market could be significant for domestic and international investors alike.

Australia is not immune.  According to the Buffet Indicator its equity market is currently worth approximately 1.15 times national GDP (compared with around 1.1 times GDP at the market peak preceding the GFC).  During the crisis that followed, the ASX ultimately lost around 54% from peak to trough.  High valuations do not cause market corrections, but they can increase investor vulnerability when a financial shock drives asset prices sharply lower, leaving previously manageable levels of leverage suddenly overextended.


  1. Are global property markets losing value?

Real estate is the world’s largest single asset and the largest component of household wealth across most economies.  Changes in property prices therefore affect considerably more than homeowners, influencing household confidence, construction, borrowing capacity, banking collateral and consumer spending.  Since the GFC global house prices have increased by 20%.  Now it seems the tide is turning.  Latest Bank for International Settlements (BIS) data shows real global house prices fell 1.2% year-on-year in the first quarter of 2026, including declines of approximately 7% in Canada and 2% in both the United States and United Kingdom.  China has experienced a considerably deeper adjustment, with real house prices 22% below their Q4 2019 level, including a further 7% year-on-year decline in the first quarter of 2026.

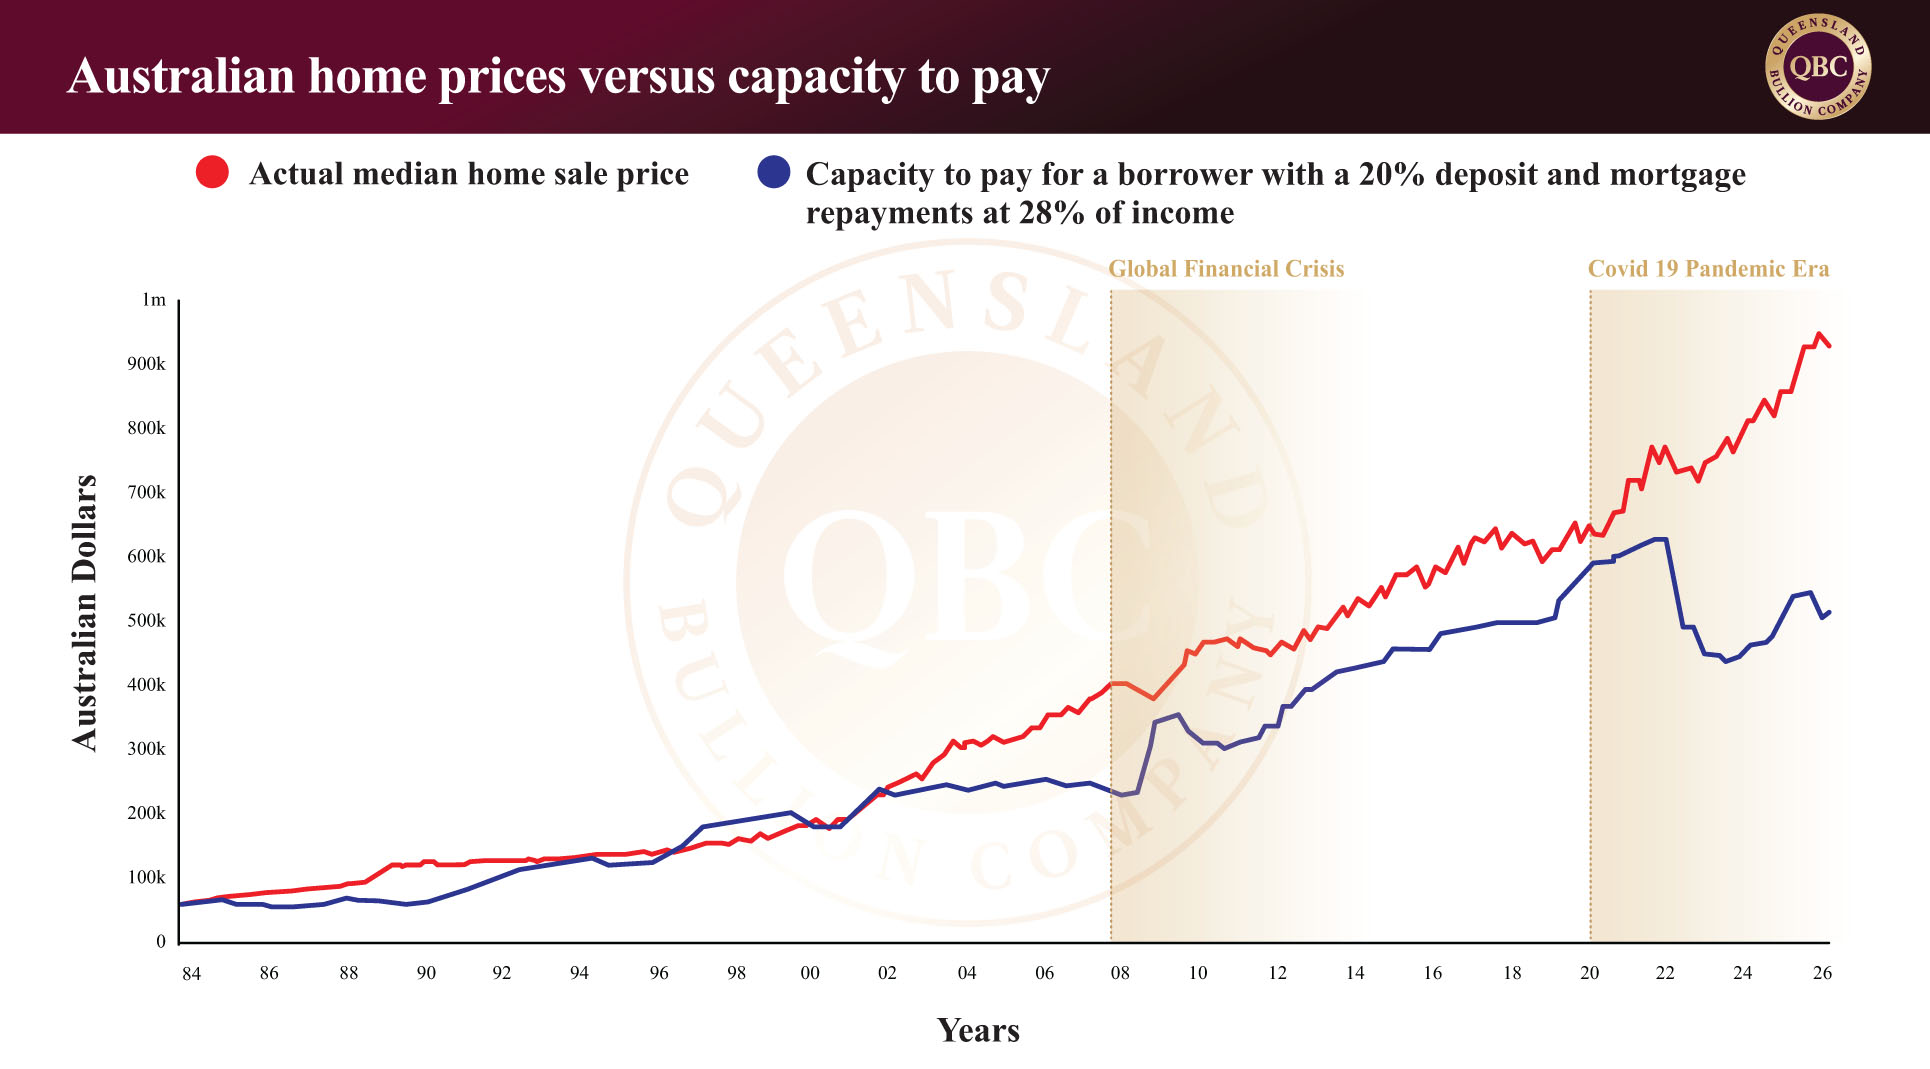
Australia remains a striking exception.  Since the Covid 19 Pandemic Era, Australian property increased approximately 64% from trough to peak (April 2020 and March 2026).  While real house prices have been falling across a number of major economies, BIS data shows Australian real house prices increased approximately 6% year-on-year in the first quarter of 2026 and remained around 23% above their Q4 2019 level.  This resilience has left Australian property unusually elevated relative to the broader economy.  McKinsey estimates the value of Australian real estate at approximately 4.5 times GDP, while household real estate relative to GDP sits around 80 percentage points above its 25-year average.  Housing shortages, constrained listings and government assistance continue to provide support, but how long can these factors sustain elevated prices?  Poor affordability and higher mortgage rates are beginning to place greater pressure on buyers, with signs appearing of the Australian property market starting to soften.  The warning is that Australian property has been unusually elevated at a time when many international markets have already begun adjusting to a considerably more expensive borrowing environment.  Is Australia about to the chorus?  Our next article explores this in more depth.

  1. What does persistent inflation mean for central banks?

Inflation presents a different risk to financial markets because it can restrict the ability of central banks to respond when economic conditions deteriorate (as well as put upward pressure on everyday consumer items).  For decades, investors became accustomed to central banks cutting interest rates when financial markets or the economy came under pressure.  Lower rates reduced borrowing costs, encouraged lending and investment, supported economic activity and, in turn, helped stabilise financial markets.  During the GFC and the Covid 19 Pandemic Era, conventional rate cuts were supplemented by extraordinary measures including quantitative easing and enormous government stimulus, especially so in Australia.  The problem in 2026 is that inflation remains difficult to contain.  Higher energy prices, tariffs, geopolitical instability and supply-chain disruptions can all place renewed upward pressure on prices, even as parts of the economy begin to weaken.  This creates an uncomfortable dilemma for central banks.

Lowering interest rates can soften an economic or financial downturn or take the heat out of the market, which can indirectly help prevent asset prices from falling as severely, but it directly affects a government’s ability to attract investors to finance debt.  Keeping rates high, however, places continued pressure on households, businesses, property markets and highly indebted governments through its repayment schemes.  The most difficult scenario would be one in which economic growth deteriorates while inflation remains stubbornly high.  Many analysts believe we are at this point now.  Central banks would then face competing objectives: stimulate the economy and potentially worsen inflation or continue fighting inflation and risk intensifying the downturn.

This matters because many asset valuations have developed during an era in which investors could reasonably expect monetary policy to become supportive when conditions deteriorated.  If persistent inflation limits that response, the next major correction could occur with central banks having considerably less room to intervene.  For investors, that represents a very different financial environment from the one that supported asset prices through much of the past several decades.  The warning is not simply that inflation could remain high.  It is that inflation could remove one of the financial system’s most important safety nets precisely when markets need it most.


Is a financial crash coming?

None of these warning signs proves that a major financial correction is imminent.  The yen carry trade could unwind gradually.  Governments may successfully manage their debt and inflation burdens.  AI-related earnings may ultimately justify elevated equity valuations.  Australian housing shortages could continue supporting property prices, while households may successfully adjust to higher borrowing costs.  The concern is that these risks are increasingly connected.

Currency markets influence bonds.  Bond yields influence equities and property.  Property supports household wealth and collateral.  Household debt influences spending, while spending influences businesses and employment.  Investors who are leveraged can expect amplified profits and losses within that system.  For Australian investors, attempting to identify the precise trigger or date of the next financial crisis may therefore be less useful than ensuring they are prepared if one occurs.  Diversification, manageable leverage, sufficient liquidity and an understanding of counterparty exposure become increasingly important when asset values are elevated.

Physical gold and silver can form one component of that preparation because bullion owned outright does not represent another institution’s liability.  Precious metals will continue to fluctuate in price, but their underlying existence does not depend upon a borrower repaying a loan, a bank remaining solvent or a government successfully refinancing its debt.

The five warning signs examined here are largely expressed through percentages of GDP, bond yields and trillions of dollars.  Yet financial corrections never remain confined to statistics.  Eventually they reach businesses, investments, employment, mortgages and families.  An unfolding situation within Australia’s property sector is currently providing a real-world example of how quickly those connections can emerge.  In Part Two, we examine the Bathla Group administration and what it can tell Australian investors about how financial stress moves from property into private credit, businesses and ultimately households.

Posted on

Part 2: What Happens If the Yen Carry Trade Unwinds?

The yen carry trade has survived because one fundamental condition has persisted for decades: money has been comparatively cheap to borrow in Japan.  Investors could borrow yen at low interest rates, exchange those funds for foreign currencies and invest in higher-yielding bonds, equities and other assets overseas.  As examined in the first part of this series, the exact size of the trade is impossible to determine because yen-funded exposure exists across banks, hedge funds, pension funds, insurers, institutional investors and derivatives markets alike.  What is clear is that the strategy has become deeply embedded in global finance.  This creates an uncomfortable problem for policymakers.  Japan needs a stronger yen to control imported inflation, but if the currency strengthens too rapidly, the very process of unwinding decades of yen-funded investment could create instability both domestically and internationally.  This creates the type of uncertainty that precious metals can traditionally thrive in.  Currently, gold trades at AUD $6,471, silver at AUD $96.16, and platinum at AUD $2,633.


What would unwinding the yen carry trade mean for Japan?

The first consequences would be felt at home.  Japan’s economy has been shaped by decades of exceptionally low interest rates.  Businesses have become accustomed to inexpensive credit, households have adapted to minimal returns on savings, banks have constructed balance sheets around low borrowing costs and the Japanese Government has accumulated one of the largest public debt burdens in the developed world. The International Monetary Fund (IMF) expects gross government debt to remain around 200% of GDP in 2026, meaning even gradual increases in borrowing costs have significant long-term implications for government finances.

The Bank of Japan therefore cannot simply raise interest rates aggressively to rescue the yen.  While this would address the fundamental issues that are depreciating the yen, higher rates would also increase financing costs throughout the economy with smaller and more highly leveraged businesses particularly vulnerable.  It would also increase Japanese government bond yields which would assist in unwinding the yet carry trade faster.

This is why the speed of monetary tightening matters as much as its direction.  Gradual increases (such as 25 basis points over six months) give banks, businesses and government finances time to adjust.  Rapid tightening designed primarily to defend the currency (such as 25 basis points or more over three months) would be much more disruptive.  The IMF itself has advocated gradual monetary normalisation rather than an abrupt change in policy, reflecting the delicate balance facing the Bank of Japan.


What would unwinding the yen carry trade mean for international markets?

The international consequences potentially become much larger because the carry trade issue does not end simply by not borrowing from Japan in the future.  Existing positions must also be closed.  Consider an investor who borrowed yen and used the proceeds to purchase US technology shares.  If the yen rises significantly, the amount of USD required to repay the Japanese loan increases.  If the movement is sufficiently large, the investor may be forced to sell those shares, convert the proceeds back into yen and repay the debt before the currency appreciates further.  As this progresses that process can accelerate because lenders may demand additional collateral or force positions to be closed.  One institution doing this is irrelevant.  Thousands of institutional investors attempting to do it simultaneously can become a market event.

The mechanism is self-reinforcing.  Investors sell overseas assets to obtain cash, then purchase yen to repay their loans.  Selling places downward pressure on the assets they are exiting, while purchasing yen pushes the Japanese currency higher.  A stronger yen then creates larger losses for other carry traders encouraging or forcing them to unwind as well.  What begins as currency appreciation can therefore become simultaneous deleveraging across equities, bonds and other risk assets, world-wide.

Markets received a reminder of this vulnerability in August of 2024, when Japan raised rates and the US moved toward lowering rates and the differential between the two narrowed.  Under these circumstances, even relatively modest changes in exchange rates could eliminate the narrow returns available from conventional yen-dollar carry trades forcing leveraged investors to reduce positions elsewhere.  The important point is that carry trades are sensitive not just to simple interest rates and interest rate changes but equally to changes in currency.


Why do US treasuries matter so much?

The US Treasury market sits near the centre of the problem.  Japan holds more than USD $1 trillion of US government debt and has historically accumulated foreign assets partly because domestic Japanese yields offered comparatively poor returns.  A sustained increase in Japanese interest rates changes that calculation.  If Japanese government bonds begin offering more attractive returns, Japanese institutions have less incentive to accept currency risk by investing overseas.  Significant capital could therefore return home even without a disorderly carry trade unwind.

Currency intervention creates another source of pressure.  As covered in Part 1, if the Japanese government needed to strengthen a weakening yen they could potentially need to sell some of their holding in U.S bonds.  More U.S. bonds on the market means higher bond yields.  Higher bond yields would then flow through to mortgages, corporate borrowing, government refinancing costs and the discount rates used to value equities.  This is one reason the United States has an interest in helping Japan stabilise the yen without forcing Tokyo to liquidate large quantities of US government debt.

Could a yen carry trade unwind trigger forced selling?

This is perhaps the greatest international risk.  The carry trade has not simply funded U.S. government bonds.  Cheap yen has been deployed across equities, corporate debt and a range of higher-risk international investments in various countries.  The precise exposure cannot be measured which is part of the problem.  Analysts can observe bank lending, foreign portfolio investment and disclosed institutional holdings, but leveraged derivatives and hedge fund positions make the full network considerably less transparent.

The narrowest estimates have previously identified approximately USD $350 billion in short-term external loans by Japanese banks that could potentially be associated with yen-funded strategies.  Japan’s broader foreign portfolio holdings have been measured to the tune of USD $20 trillion.  Neither figure represents the definitive size of the carry trade, but together they illustrate the amount of capital potentially influenced by Japanese interest rates and currency movements.

Leveraged investors may be forced to liquidate whichever assets can be sold most easily, rather than simply those directly connected with Japan.  This is how financial stress can move between apparently unrelated markets.  A problem beginning with the yen could theoretically produce selling in US equities, government bonds or other liquid assets because those are the markets investors can access quickly when they need cash.  That does not mean a stronger yen automatically causes a global market crash.  The size, speed and positioning behind the move would determine the outcome.  However, it does mean the yen represents an important source of global leverage (and potential liability) that investors can easily overlook when concentrating exclusively on American or European markets.


Why can’t Japan simply allow the yen to keep falling?

If a rapidly rising yen creates these risks, allowing it to depreciate indefinitely might appear to be the easier option.  Unfortunately, that creates a different set of problems.  Japan depends heavily on imports, particularly for energy.  A weaker yen increases the domestic cost of goods priced internationally in US dollars, importing inflation directly into the Japanese economy therefore rates would need to increase.  The U.S.-Israel-Iran War demonstrated the problem clearly as higher oil prices combined with a weaker yen to create a substantial terms-of-trade shock for an economy that imports almost all of its oil.  To this end, the country’s petroleum bill increased by 59% as at this June.

Excessive depreciation could also affect Japan’s neighbours.  A dramatically cheaper yen makes Japanese exports more competitive against products manufactured in China, South Korea and elsewhere in Asia.  Other countries may then face pressure to tolerate weaker currencies of their own to preserve export competitiveness as they are exporters and not importers, potentially creating a broader cycle of currency depreciation way beyond Japan.

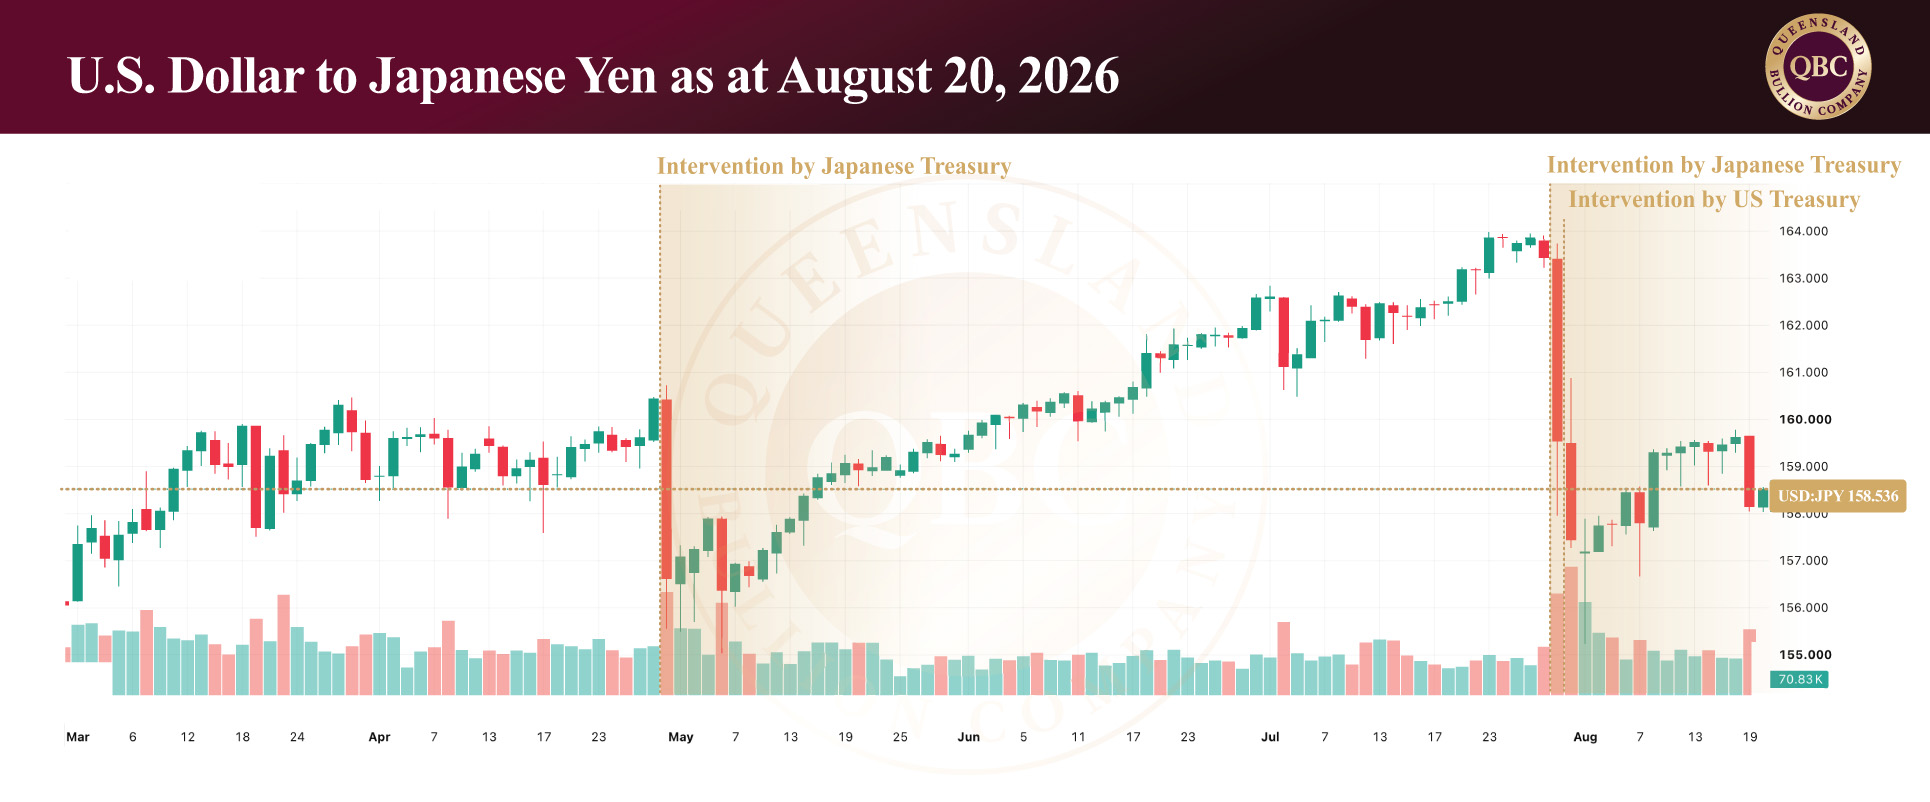
There is also a political threshold.  The ¥160 region against the US dollar has increasingly become an important psychological level for markets because Japanese authorities have repeatedly demonstrated a willingness to intervene around or beyond it.  The recent joint intervention pushed the yen from approximately ¥164 to around ¥155 before the currency began weakening again.  By mid-August it had already surrendered approximately half of that improvement.  This helps explain why intervention should be viewed less as an attempt to establish a permanently stronger yen and more as a guardrail against disorderly depreciation.


Why does Japan need the yen to be neither too weak nor too strong?

 Japan is effectively trying to keep the currency within a range that avoids two very different financial problems.  If the yen becomes too weak, domestic pressures build via imported inflation and higher interest rates.  Additionally other exporting nations experience pressure to lower their own currencies.  If the yen becomes too strong, the carry trade becomes less profitable with investors potentially facing significant losses and consequences rippling throughout global investment markets.  The ideal outcome is therefore neither collapse nor rapid appreciation.  Japan needs an orderly adjustment that allows the yen to strengthen sufficiently to contain imported inflation while avoiding the kind of sudden currency movement that could destabilise domestic borrowers and force international carry trades to unwind simultaneously.

That is an extraordinarily difficult balancing act because policymakers do not control every variable.  The Bank of Japan controls Japanese monetary policy, but it does not control Federal Reserve rates, Middle Eastern oil prices, US fiscal policy or the behaviour of leveraged international investors.  The recent intervention illustrates the limits of national monetary policy in a financial system where capital can move around the world almost instantaneously.


Is the yen carry trade a global financial liability?

This does not mean the yen carry trade is destined to collapse or that a global financial crisis is inevitable.  Policymakers have substantial tools available to manage liquidity, and gradual adjustment could allow positions to unwind without systemic disruption.  However, the recent interventions demonstrate that the margin for error has narrowed.  An interest-rate decision in Tokyo can influence a currency trade, which can influence Treasury yields, which can influence American borrowing costs, equity valuations and financial conditions throughout the world.

For investors, this interconnectedness reinforces the value of diversification beyond purely financial assets.  Physical gold and silver remain exposed to market prices and currency changes, but the assets themselves do not represent another institution’s liability.  In a global financial system increasingly dependent on governments balancing one market against another, that independence remains one of the fundamental reasons physical precious metals continue to serve as a form of financial insurance.  Taking Part 1 and Part 2 of this report into consideration, we firmly believe that the fundamental reasons for holding precious metals long term has never been stronger.

Posted on

Part 1: Why Are the US and Japan Trying to Prop Up the Yen?

The Japanese yen is the third most actively traded currency in the world, but its importance extends well beyond foreign exchange markets.  For decades, exceptionally low Japanese interest rates have allowed investors to borrow cheaply in yen and deploy that money into higher-yielding assets overseas, creating what is known as the yen carry trade.  The strategy has helped channel enormous amounts of capital into global bond, equity and other financial markets, but changes in interest rates and persistent weakness in the yen is now creating problems for Japan and, increasingly, the United States.  After falling to its weakest level in approximately forty years, Japan intervened heavily to support its currency before the US took the extraordinary step of joining the effort in August.  The intervention initially strengthened it by 5.8%, although it has since surrendered roughly half those gains.  At the time of writing, gold trades at approximately AUD $6,352 per ounce, silver at AUD $95.72 and platinum at AUD $2,590, placing renewed focus on precious metals as governments intervene to manage instability across currencies and sovereign debt markets.


What is the yen carry trade?

A carry trade is relatively simple in principle.  An investor borrows money in a country where interest rates are low and invests those funds somewhere offering a higher return.  The difference between the cost of borrowing and the return generated by the investment is known as the “carry”.  For decades, Japan has provided almost ideal conditions for this strategy because interest rates remained close to zero while rates elsewhere were considerably higher.

A traditional yen carry trade might therefore involve borrowing Japanese yen, converting the funds into US dollars and purchasing US Treasury securities.  The investor pays the comparatively low Japanese interest rate while receiving the higher return available in the United States.  The same principle can be applied to equities, corporate bonds and other assets, meaning yen-funded capital has found its way into everything from US technology stocks to more speculative markets such as cryptocurrency.

The strategy becomes even more profitable when the yen depreciates.  If an investor borrows yen, converts it into US dollars and the yen subsequently falls against the dollar, fewer US dollars are required to purchase the yen needed to repay the original loan.  However, the opposite is equally important.  A rapidly appreciating yen can turn a profitable carry trade into a loss, forcing leveraged investors to sell assets and repurchase yen to meet their obligations.  It is this reversal that makes the carry trade important well beyond Japan.


How large is the yen carry trade worldwide?

The most accurate answer is that nobody knows exactly.  There is no central register recording every yen-funded investment around the world.  A Japanese bank lending yen overseas may be facilitating a conventional commercial transaction rather than a speculative carry trade, while hedge funds can establish leveraged positions through derivatives that are considerably harder to observe.  Japanese households, insurers, pension funds and institutions also own enormous portfolios of foreign assets that may share characteristics with the carry trade without fitting its narrowest meaning.

Using a strict definition, analysts have previously pointed to approximately USD $350 billion in short-term external lending by Japanese banks as one indication of the size of yen-funded trades.  Even this figure could simultaneously overstate and understate the true exposure.  Some loans may have nothing to do with carry trading, while leverage and positions established outside the banking system could make the real financial exposure considerably larger.  Japanese foreign portfolio investment alone stood at approximately ¥666.86 trillion, or USD $4.54 trillion at the time of the calculation, with more than half invested in interest-rate-sensitive debt securities.

Deutsche Bank has approached the question from an even broader perspective.  Currency strategist George Saravelos combined the balance sheets of the Japanese Government, Bank of Japan (BOJ), Government Pension Investment Fund and state-owned banks to examine Japan as though these institutions formed one consolidated financial entity.  The analysis characterised approximately USD $20 trillion of Japanese government debt and associated assets as an enormous form of carry trade: low-cost, short-term yen liabilities supporting assets that include higher-returning investments abroad.

Importantly, Deutsche Bank’s USD $20 trillion figure should not be interpreted as an estimate that speculative traders have USD $20 trillion invested in conventional yen carry trades.  It is a conceptual analysis of Japan’s consolidated public-sector balance sheet.  Its significance lies in demonstrating how deeply decades of inexpensive yen funding have become embedded in Japan’s financial system.  There is therefore no credible single figure for the total yen carry trade.  Depending on the definition used, the identifiable exposure ranges from hundreds of billions of dollars to trillions, while Deutsche Bank’s broader analysis demonstrates that the same underlying interest-rate dynamic extends across an approximately USD $20 trillion public-sector balance sheet.  The inclusion of the private sector would only add to these figures.


Why Is the Japanese Yen Falling?

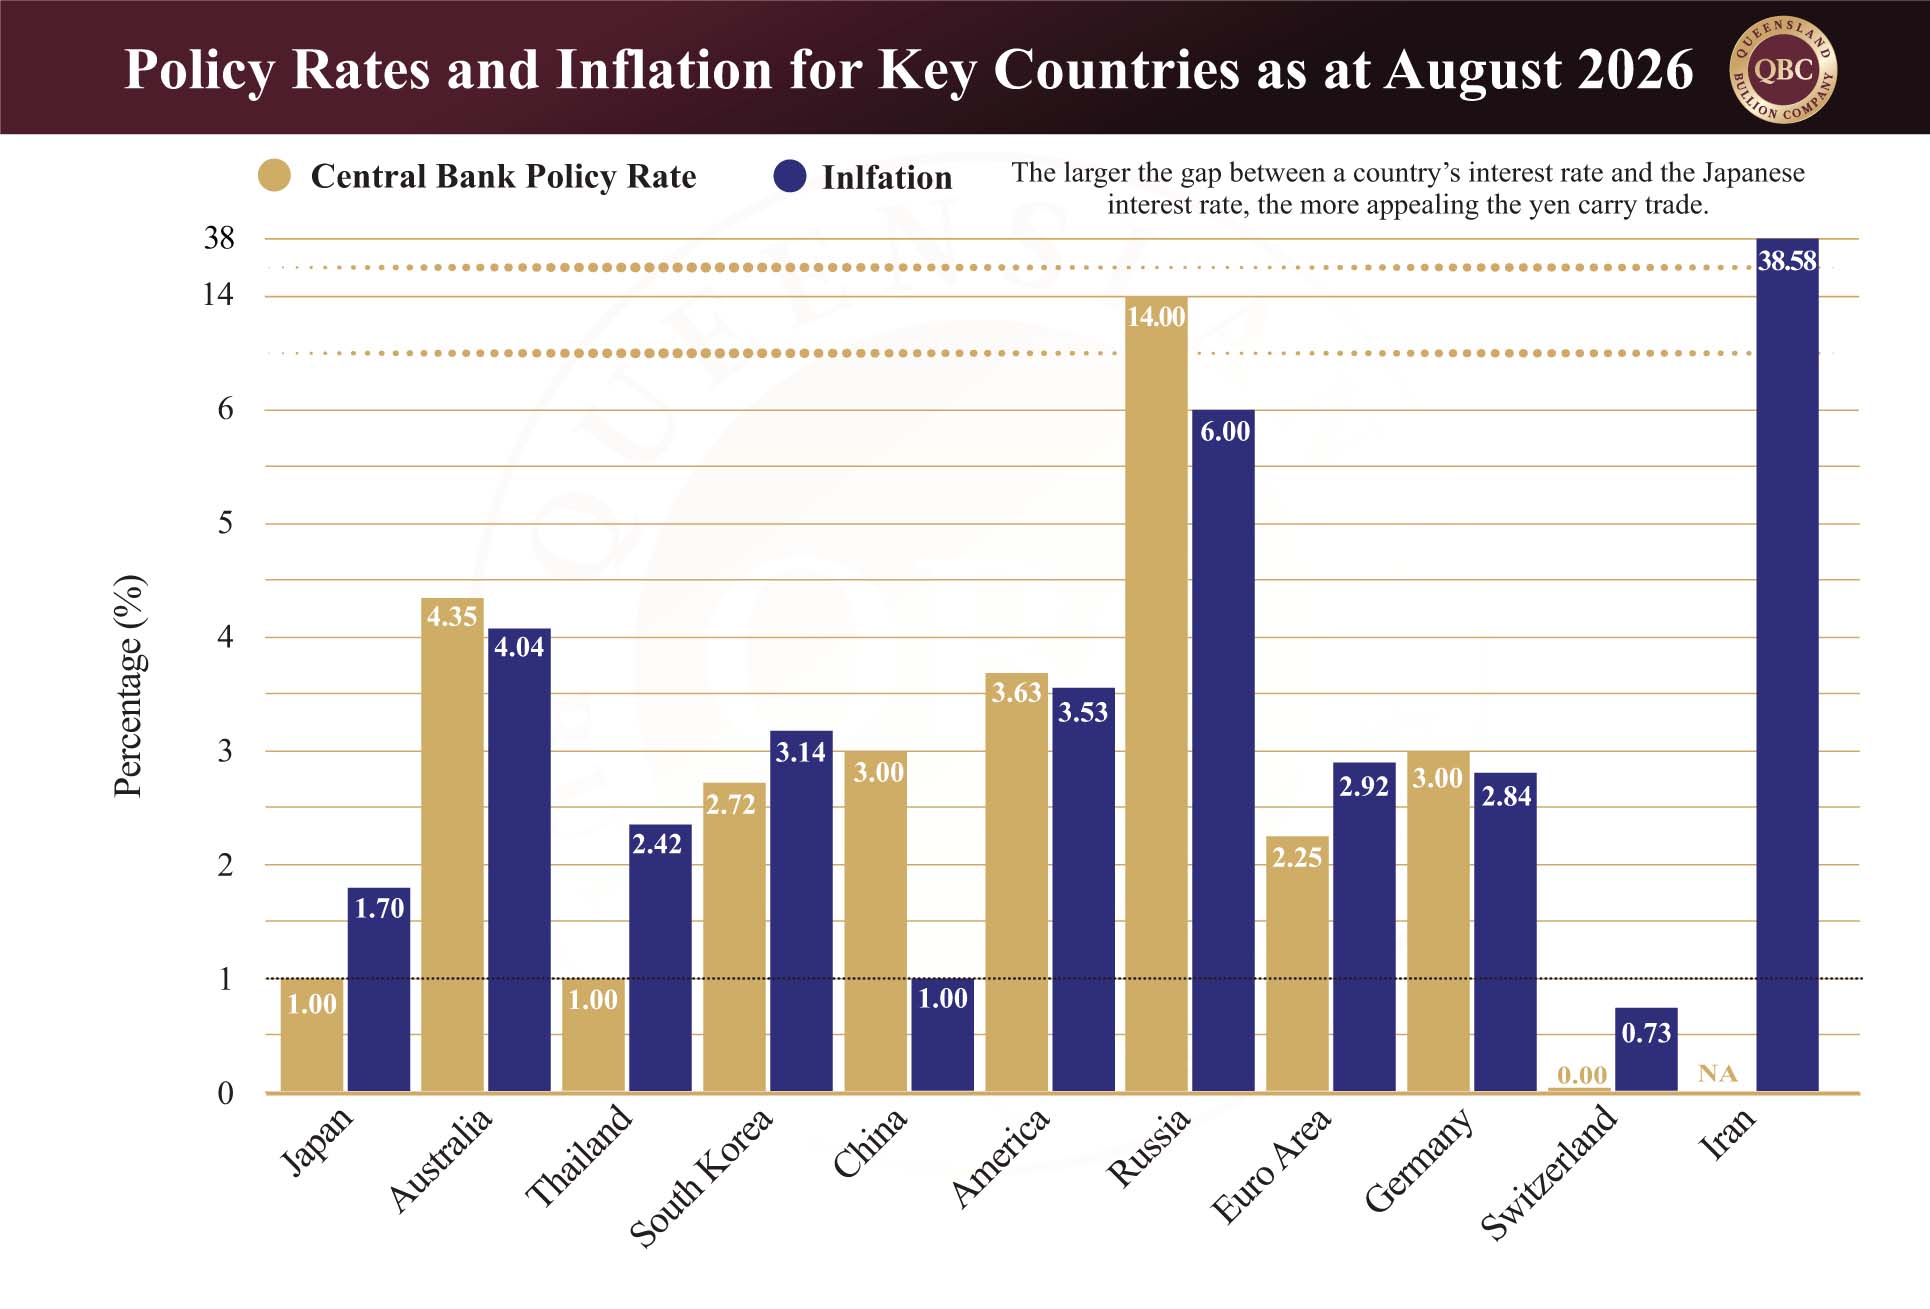
The fundamental problem is the difference between Japanese and overseas interest rates.  The Bank of Japan’s policy rate remains around 1%, compared with the US federal funds target range of 3.50% to 3.75%.  That difference gives investors a financial incentive to sell yen and purchase US dollars to access higher-yielding American assets.  As more investors make that transaction, additional yen enters foreign exchange markets while demand for dollars increases, placing downward pressure on the Japanese currency.  The recent US-Japan intervention changed market psychology, but it did not eliminate this underlying interest-rate differential.

Japan’s fiscal position adds another complication.  The International Monetary Fund (IMF) estimates gross government debt at approximately 204% of GDP in 2026, leaving policymakers with limited room to increase borrowing costs aggressively without consequences elsewhere in the economy.  After decades of exceptionally low rates, households, businesses, financial institutions and the Japanese Government itself have adapted to inexpensive money.  Raising interest rates may support the yen, but doing so too quickly risks creating problems for borrowers, banks, asset prices and government finances.

Why does Japan need to support the yen?

A weaker currency is not inherently bad for Japan.  Historically, depreciation supported major exporters by making Japanese products cheaper overseas and increasing the yen value of foreign earnings.  However, the structure of the Japanese economy has changed as many large companies shifted production overseas, while the country remains heavily dependent on imported energy, food, raw materials and industrial inputs.

At some point, currency weakness therefore becomes inflationary rather than beneficial.  Every barrel of oil, shipment of raw materials or imported component priced in US dollars becomes more expensive when translated back into yen.  Those costs eventually reach Japanese businesses and households, eroding purchasing power and placing political pressure on the government.

Japan has consequently become increasingly willing to intervene directly.  Between 28 April and 27 May 2026 alone, Japanese authorities spent approximately ¥11.7 trillion, equivalent to about USD $73.5 billion at the time, supporting the yen after it moved beyond ¥160 against the US dollar.  The more recent joint intervention was larger again in strategic significance because Washington participated directly.  Japan reportedly deployed approximately ¥8.45 trillion, or USD $53 billion, while the US also purchased yen.

The difficulty is that intervention can influence price without necessarily changing the conditions producing that price.  Selling foreign reserves and purchasing yen reduces the amount of yen circulating and demonstrates that authorities are prepared to defend the currency; however, as long as investors can borrow more cheaply in Japan than in the United States, the incentive underlying the carry trade remains.  Intervention can therefore slow speculation and establish psychological boundaries, but without changes to interest rates it may struggle to permanently reverse the trend.


Why is the United States supporting the Japanese yen?

This is where a Japanese currency problem becomes an American bond market problem.  Japan is one of the largest foreign holders of US government debt, with Treasury holdings exceeding USD $1 trillion.  Those assets provide Japan with a substantial pool of US dollars that can be accessed when it needs to intervene in currency markets.  To strengthen the yen, Japan can sell foreign assets such as US Treasuries, receive US dollars and use those dollars to purchase yen.  Evidence suggests Japan drew heavily on foreign securities during its intervention earlier this year, with holdings falling by approximately USD $75.6 billion during May, broadly matching the scale of its currency intervention.

For Washington, that creates an uncomfortable problem.  If both Japan and America concurrently sell large quantities of U.S. bonds the market can become flooded.  Greater supply can push bond prices lower and yields higher, increasing borrowing costs throughout the American economy and potentially making it more expensive for Washington itself to service and refinance debt.

The US therefore has an interest in preventing Japan from becoming a forced seller of American government bonds.  During the latest intervention, the United States reportedly sold euros from its reserves to purchase yen rather than selling US dollars, helping support the Japanese currency without directly adding pressure to the Treasury market or materially weakening the dollar.

This helps explain why an apparently domestic Japanese currency problem warranted direct American involvement.  Washington is not simply supporting an ally.  It is also protecting the stability of the world’s largest sovereign bond market and, by extension, its own cost of borrowing.

What does the yen intervention mean for global financial markets?

The joint intervention achieved something important.  It demonstrated that Japan and the United States are prepared to act together and temporarily changed the psychology surrounding the yen.  What it has not done is remove the underlying incentive driving the carry trade.  Less than two weeks later, the yen had already surrendered approximately half of the gains achieved through intervention, with markets once again testing the willingness of policymakers to defend the currency.

More importantly, the episode demonstrates just how interconnected modern financial markets have become.  Japanese interest rates influence the yen carry trade.  The carry trade directs capital towards American bonds and equities.  Yen weakness increases Japanese inflation.  Defending the yen can require bond sales.  Bond sales can push American bond yields higher, affecting borrowing costs, equity valuations and ultimately monetary policy throughout the world’s largest economy.  Increased borrowing costs can stall economic growth.  A currency problem that begins in Tokyo can therefore quickly become a financial problem in Washington and, from there, spread throughout global markets.

For precious metals investors, this interconnectedness is precisely what makes physical assets relevant.  Gold and silver do not depend on the solvency of a bank, the repayment of a government bond or the maintenance of an interest-rate differential between two countries.  Their prices will still fluctuate with currencies, yields and investor sentiment, but physical bullion itself exists outside the network of liabilities connecting governments and financial institutions.  The recent intervention does not prove that a wider financial crisis is imminent, but it does seem to be hurtling in this direction.

That raises the more important question.  If the yen carry trade is large enough to connect Japanese monetary policy with trillions of dollars of international assets, what happens if investors are eventually forced to unwind it?  In the second part of this series, we examine how a rising yen could affect Japan, US Treasuries, international equity markets and the enormous pool of leveraged capital built around decades of inexpensive Japanese money.

Posted on

Why Did Gold Rise Overnight? Four Forces Driving the Rally

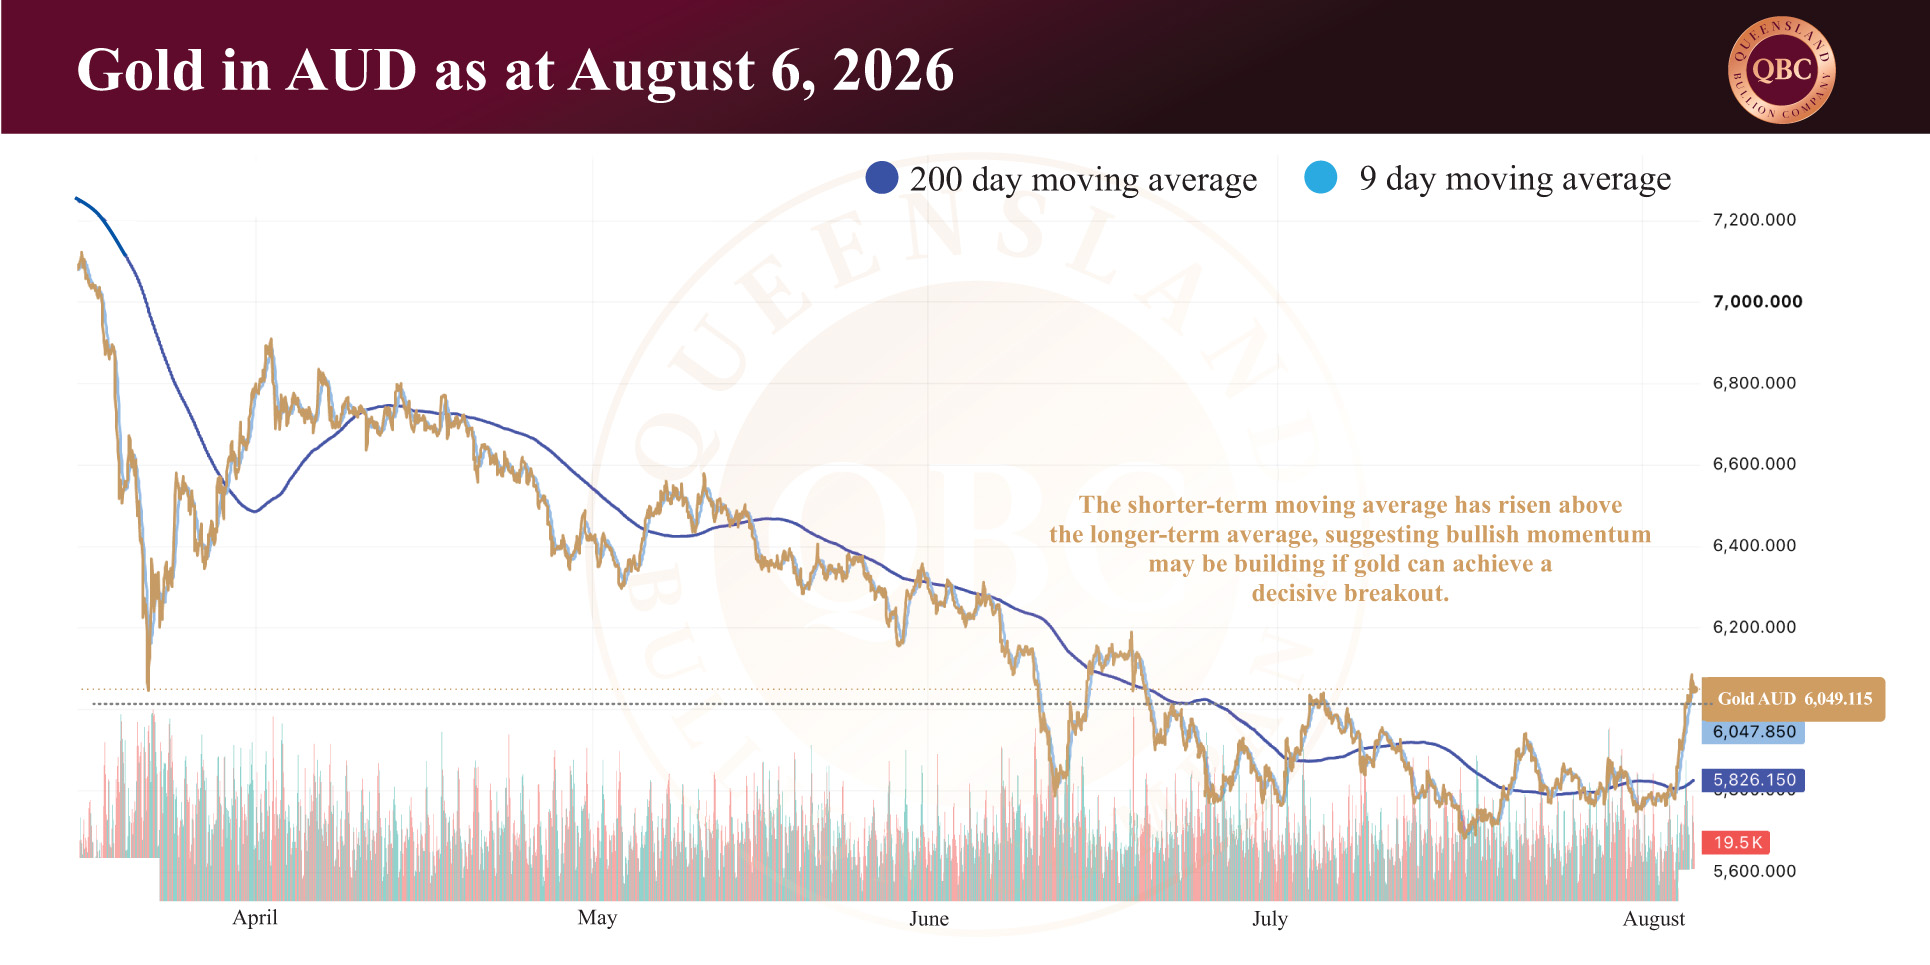
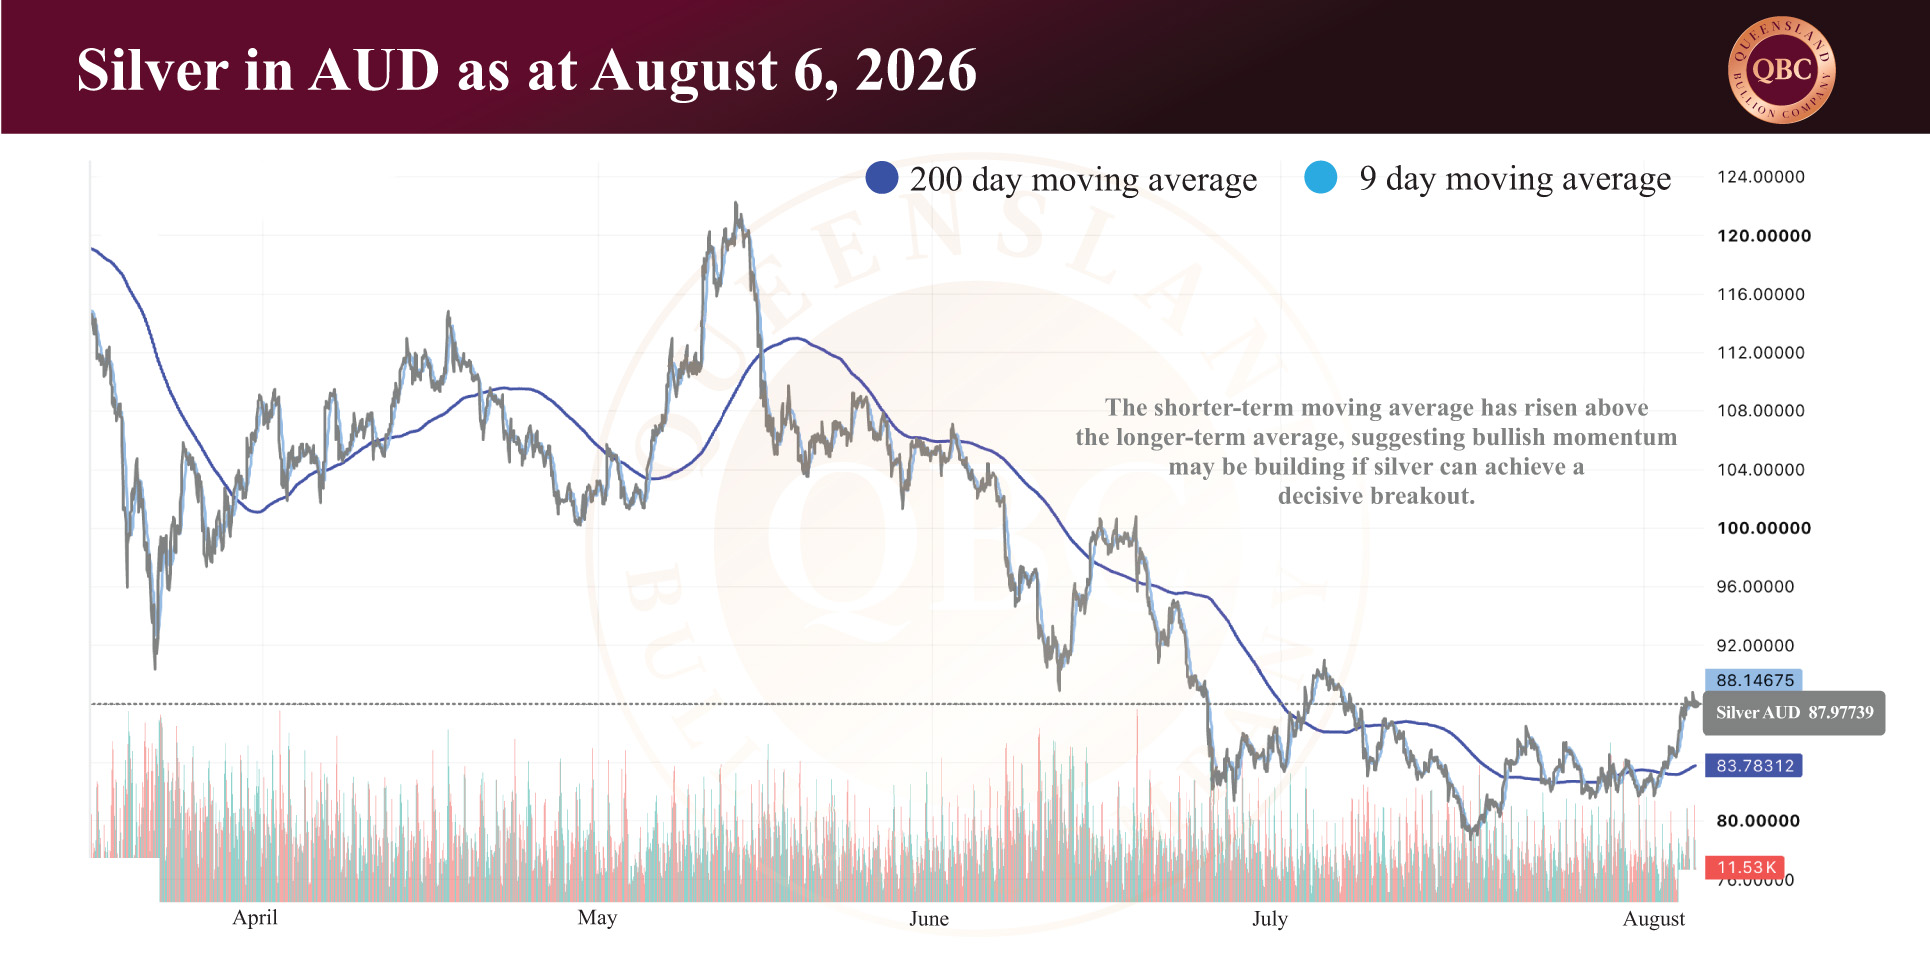
Only days after entering August on uncertain footing, gold and silver delivered one of their strongest single-day advances in weeks.  The move surprised many investors given that precious metals had spent much of the past six months correcting from the extraordinary highs reached earlier this year; however, overnight price action was driven less by any single headline and more by a convergence of monetary policy, economic data and geopolitical developments.  While gold trades at approximately AUD $6,068 per ounce, silver at AUD $88.34 and platinum at AUD $2,509, these developments have eased several of the short-term headwinds that had weighed on precious metals since the beginning of the year.


Has the Federal Reserve become less certain about raising interest rates?

The most significant catalyst remains the US Federal Reserve.  At its July meeting, the Federal Open Market Committee (FOMC) voted to leave the federal funds rate unchanged at 3.50% to 3.75%. While the decision itself was widely anticipated, the voting breakdown was not.  The committee voted nine to three, with Cleveland Fed President Beth Hammack, Minneapolis Fed President Neel Kashkari and Dallas Fed President Lorie Logan all favouring an immediate rate increase.

Three dissents are uncommon in modern Federal Reserve history and typically signal genuine disagreement within the committee rather than minor differences in opinion.  Until recently, financial markets interpreted this division as increasing the likelihood of another rate hike later this year.  Higher interest rates generally support higher bond yields, increasing the opportunity cost of holding non-income-producing assets such as gold and silver.  As a result, expectations of further monetary tightening have remained one of the principal reasons precious metals have struggled to regain the momentum seen throughout 2025.  Importantly, investors are now questioning whether that hawkish outlook remains justified.


Did the latest U.S. jobs data reduce the chances of another rate hike?

The first major test arrived with the latest Job Openings and Labour Turnover Survey (JOLTS).  Job openings declined modestly from 7.6 million to around 7.44 million.  The softer labour market data reinforced evidence that demand for workers is gradually easing, reducing confidence that the economy could withstand a more restrictive monetary environment brought about by higher interest rates.  Because the Federal Reserve has repeatedly emphasised the importance of labour market conditions when setting monetary policy, the report immediately prompted investors to reassess the probability of another rate increase.  The significance of the report lies less in the absolute number and more in its timing.  Following a divided Federal Reserve meeting, the weaker labour data reduced confidence that policymakers will ultimately decide another increase is necessary.  As expectations for tighter monetary policy softened, bond yields have eased (especially the 10 Year Treasury bond) and gold responded positively.

Financial markets are currently treating each major economic release as evidence either for or against another rate rise.  Rather than reacting to individual data points in isolation, investors are attempting to determine whether inflationary pressures continue to justify additional tightening.  For precious metals, every report that reduces those expectations removes another short-term headwind.


Are falling oil prices also supporting gold?

While monetary policy dominated investor attention geopolitics provided a second catalyst.  Oil prices moved lower following comments from US Treasury Secretary Scott Bessent suggesting that an agreement to reopen commercial shipping through the Strait of Hormuz could be reached within days.  Brent crude subsequently declined as investors anticipated that any reduction in regional tensions would improve oil supply and reduce inflationary pressures.

The situation remains far from straightforward.  Within hours of those comments, UK Maritime Trade Operations confirmed that a commercial vessel had been struck by an unidentified projectile in the Strait of Hormuz.  Iran also denied engaging in direct negotiations with Washington, although reports suggest it is the discussion involving Iran and Oman over future shipping arrangements that could be finalised imminently.  The Iran-Oman agreement would see each country controlling different parts of the strait, thus leaving considerable control with Iran.  While the U.S. administration was not directly involved, it and its European counterparts had place considerable pressure on Oman to reach an agreement with Iran.

Despite these contradictions, financial markets responded primarily to the possibility that oil supplies may normalise.  The connection to gold is indirect but important.  Lower oil prices reduce inflation expectations, easing pressure on central banks to continue raising interest rates.  If inflation moderates more quickly than previously expected the case for additional Federal Reserve tightening weakens.  Once again, this reduces upward pressure on bond yields and improves the investment environment for precious metals.


Did a weaker US dollar add further support?

Outside America gold also benefited from renewed weakness in the US dollar.  The US Dollar Index recently traded near its lowest level in almost seven weeks, driven primarily by the Federal Reserve’s decision to leave interest rates unchanged and a decline in U.S. Treasury yields.  Coordinated efforts to support the Japanese yen occurred at the same time, adding to broader shifts in currency markets.  Because gold is priced globally in US dollars, any decline in the currency effectively reduces the purchase price for international buyers using euros, yen, yuan or Australian dollars.

A weaker dollar therefore tends to broaden global demand for physical gold, particularly among central banks and long-term investors already seeking greater diversification away from US financial assets.  While currency movements rarely determine the direction of gold in isolation, they often amplify existing trends already developing elsewhere in financial markets.


Are the short-term headwinds beginning to fade?

No single development explains gold’s overnight rally.  Rather, the move reflects several independent factors beginning to align.  Expectations of another Federal Reserve rate increase have softened following weaker labour market data.  Bond yields have eased accordingly.  Lower oil prices have reduced immediate inflation concerns, while a weaker US dollar has improved purchasing power for international buyers.

From a technical perspective, the recent price action is also becoming more constructive.  After correcting for much of the past seven months and spending July consolidating within a relatively narrow trading range, both gold and silver have begun showing signs that downside momentum may be easing.  Short-term moving averages have strengthened relative to their longer-term counterparts, a development technical analysts often interpret as an early indication that buying interest is improving.  Whether this ultimately develops into a sustained rally will depend on incoming economic data, Federal Reserve expectations and the evolution of geopolitical events.  For now, however, several of the factors that constrained precious metals throughout the first half of 2026 appear to be becoming less restrictive, providing a more supportive backdrop than investors have seen for some time.