Posted on — Leave a comment

The Fed is boxed in while gold and silver look ready to fly.

Overnight gold and silver have experienced a spike in prices worthy of note.  With gold trading at $4,751, silver at $54.01, and platinum at $1,617, volatility seems to be the top concern in the precious metals markets and global economies in general.  While main stream media will emphasis that US President Donald Trump inherited high employment rates, strong GDP growth, low inflation and a soaring stock market, they are quick to dismiss the fact that the Federal Reserve is in a bind with no obvious or effective way to remedy.  Importantly, this bind is one that has been long in the making, independent of which government has held power.

Since the Covid 19 Pandemic America’s monetary base (currency in circulation) is up 60 percent, M2 money supply is up 36 percent in the past four years (cash, checking and savings deposits, etc), and the inflation surge in the same period is cumulatively about 22 percent.  What this means is that too much money has been injected into the American economy since the 2008 Global Financial Crisis (GFC) which has never been addressed.  Adding more money in the system can contribute to rising prices via inflation.  This monetary expansion is now at breaking point and the Federal Reserve has few moves to try and resolve what can no longer be avoided.

Cutting interest rates

When the Fed cuts interest rates it lowers borrowing costs to stimulate the economy.  This is because cutting rates incentivises borrowing via access to easy credit lines.  Consequently institutional investors have not been able to adjust to higher interest rates since the GFC when interest rates were close to zero for ten years straight, and then again for a few years during the Pandemic.  By last year, rates eventually rose to 5.5%.  Because institutional investors are addicted to this easy money, if the Fed does not cut rates it risks an economic slowdown and stock market volatility.  This is why there is a call for a rate cut, regardless of whether it is actually justified.  And while the act of cutting rates is not generally inflationary, it can create inflationary measures which manifest as asset bubbles such as in the real estate, stock, or collectables (eg, art) markets.  Such bubbles tend to burst and this in turn could lead to recession.

Balance sheet manipulation and inflation

While the Fed could be simultaneously cutting rates to stimulate the economy as well as reducing inflation by removing some of the cash in circulation, it is increasingly shy to do so.  And this is where the Fed’s true resolutions become evident.  It has given in to inflation.  To hide this fact the media directs all attention onto the Fed’s rate cutting decisions at each meeting.  In contrast the balance sheet rarely gets a mention; however, it is the state of the assets and liabilities on the balance sheet that dictate how effective rate increases or decreases actually are.  If inflation is not controlled, other instruments can become skewed and somewhat meaningless.

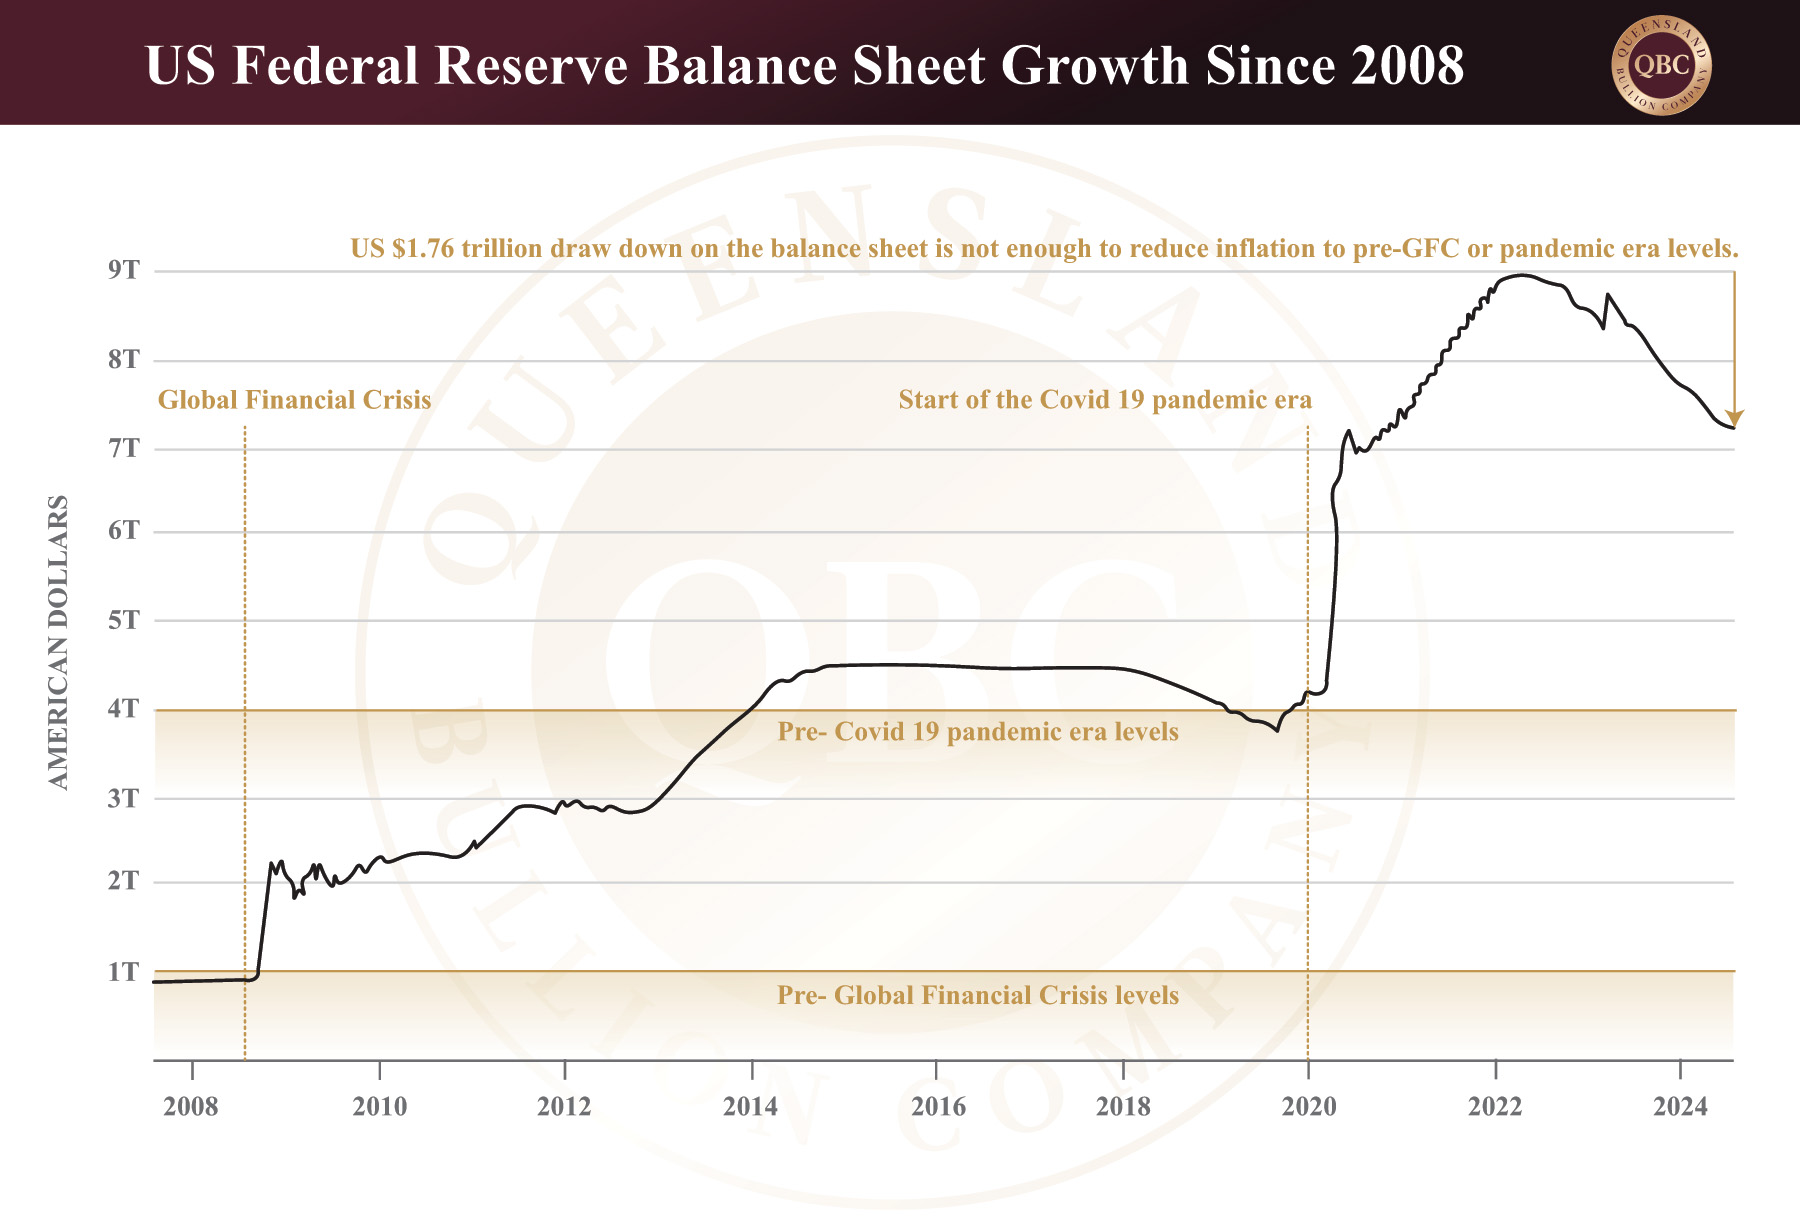
In principal the balance sheet is a list of every asset and liability the Federal Reserve holds.  During periods of quantitative easing, the Fed uses easy money to purchase assets (e.g. Treasury bonds) and therefore inject capital into the market to stimulate the economy.  The result is that for each asset purchased the liabilities grow to equal proportion.  This growing balance is reflective of more money circulating in the economy. Hence, quantitative easing is inflationary by definition.  To put this in perspective, before the GFC the Federal Reserve held assets equivalent to just over US $900 billion.  Just prior to the pandemic era it had ballooned to just under UD $4 trillion.  After the pandemic era, an additional US $5 trillion was introduced putting the balance sheet at US $9 trillion.  Said differently, the Fed effectively circulated an additional US $8 trillion in the economy in fourteen years in an attempt to keep it from collapsing.  This is the ultimate epitome of inflation.

The most effective way to reduce inflation is to decrease the balance sheet by taking money out of the market.  Reducing inflation is the most appropriate way to lower the cost of living for taxpayers.  So in 2022 the Fed started doing just this.  It tightened the balance sheet to the tune of US $1.76 trillion, nowhere near enough to erase the US $5 trillion they injected over Covid.  Below is a graph that tracks the total growth of the Federal Reserve balance sheet since the GFC:


As is evidenced in the above graph the recent tightening is far from enough to getting back to pre-pandemic era levels.  While we progressively slide into another recession, there has been little effort to erase the quantitative easing that occurred during the pandemic era let alone the GFC.  By reducing the speed at which it shrinks its balance sheet the Fed is effectively leaving far too much liquidity in the market.  This flies in the face of any attempt to reduce inflation.  But if the Fed tightens the balance sheet too fast, and hence pulls too much liquidity out of the system, it may exacerbate financial instability and could spark a severe correction.  The takeaway is that there is so much liquidity in the economy now trying to reduce it without affecting the market is a near impossibility.  So inflation is going nowhere fast.  The trouble is that if the balance sheet remains high or increases, at some point the market will lose confidence in the Fed being able to meet its debt obligations.  Again, this could lead to market volatility and recession.

In summary, the Fed is now in a no-win situation.  It cannot effectively fight inflation without triggering an economic collapse.  Volatility is likely to be a key feature this year and investors should ready themselves to buy the dip before gold moves higher in response to renewed inflation concerns.  By this stage we all know what this means for gold and silver.  As the preferred instrument to hedge against inflation, economic volatility, and recession, precious metals will be once again tested and be proven out to be real money as it has been for over 5000 years.
Posted on — Leave a comment

Stocks, Real Estate, and Precious Metals

Even though gold has dipped over the last couple of days, it has continued trading sideways for much of the month and decreased by only $10 from February 10th. This consolidation period is not uncalled for and allows gold to build a more solid foundation for moving forward.  With gold currently trading at $4,625, silver at $50.54, and platinum at $1,530, it could be an opportune time to step back and view two of the fundamentals that support the expected precious metals super cycle that has, essentially, already started.  This article explores the relationship between precious metals and the two main bubbles that are about to burst: stocks and housing.


Stock Market

Leading up to the year 2000 a massive stock market frenzy occurred based on internet-related companies, now referred to as the dot-com bubble.  At the time the psychology was that the newly installed internet was the way of the future and investing in related stocks was a sure bet.  The result was significant over-valuation of said stocks, where they increased in value much faster than the rate of monetary expansion at the time.  When assets outpace the organic monetary expansion within an economy, the inevitable result is a correction.  Today we are experiencing the same phenomena in relation to tech stocks, this time related to social media, smart phones, apps, cloud computing, e-commerce, electric cars, and more recently, artificial intelligence, hence the rise of the Magnificent Seven (Alphabet, Amazon, Apple, Meta Platforms, Microsoft, Nvidia and Tesla).  The difference is this bubble is comparatively much bigger than the dot-com bubble.  And while tech stocks are a bubble in themselves, the stock market in general also hugely overvalued to the tune of 208%.  Read more about this in our previous article.

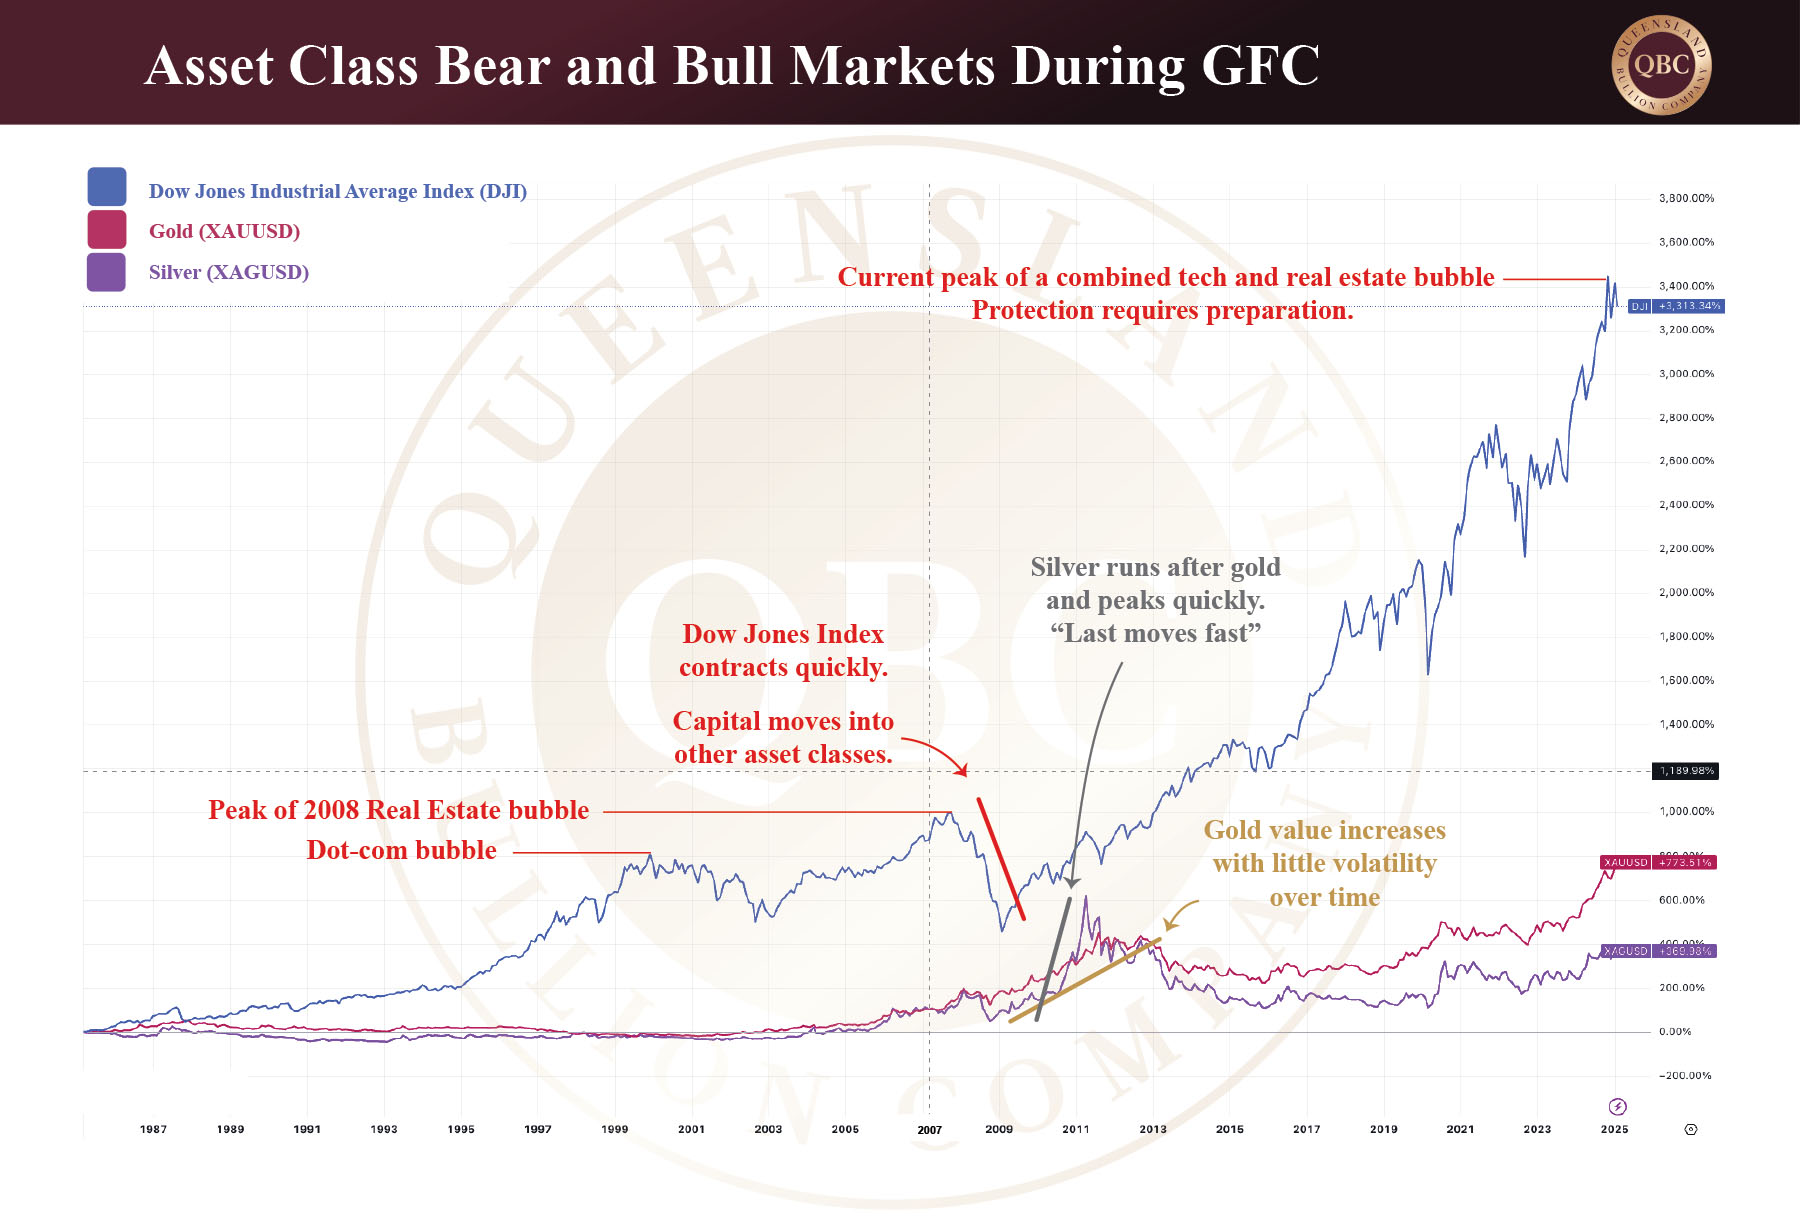
What happens to gold and silver when the stock market is overextended? After the dot-com bubble peaked in 2000, it unravelled into a devastating bear market much to the dismay of the investors involved.  The below graph is based on the Dow Jones Industrial Average Index (which is a broader indicator of the stock market than the NASDAQ).  It illustrates not just how quickly the bear market started and ended, but also how gold and silver started a bull run shortly afterward as money was redistributed into everyone’s favourite safe haven assets. From the bottom of the stock bear market to the next peak in gold, it rose about 151% in value in the American market.  Similarly, silver rose 387%. It made more gains and also fell faster than gold, which speaks to one of the fundamental differences between the two metals.

Real Estate Market

The average real estate retail investor would interpret the current market by its extreme unaffordability in the present moment.  Locally, based on a median income household earning of $112,000 those looking to purchase a property can only afford 14% of what the market offers.  This figure has plummeted from 43% four years ago, even with a slowdown in the market already evident.  In America, 2024 housing sales have fallen to their lowest since 1995 for the second year running. Concurrently homebuilding stocks appear to have peaked and are now rolling over – all these patterns are extremely similar to pre- 2008 Global Financial Crisis conditions.  Because the real estate sector generally leads the economy both into and out of recessions, the slow-down is a good indicator that we are already moving through the beginnings of a major downturn.


What does this mean for gold and silver?

What is important to remember is that stock and real estate bubbles occur independent to the price of gold and silver.  Hence, precious metals do not factor into any bear markets in those sectors.  However, the result is always positive.  Stocks, housing and precious metals compete against each other for capital.  During a bubble capital flows to the asset class experiencing a boom, in the current circumstance that would be stocks and real estate.  When these asset classes crash capital is redirected to safe haven assets such as gold.  Eventually, when retail investors are priced out of gold, silver becomes popular.  This is why gold runs first then silver follows.

To conclude, being able to remove any hype from your assessment of the market (eg, “Bitcoin is going to US $1M”) allows you to identify the top and shift capital to another asset class before a bear market in a methodical and neutral fashion that is proactive as opposed to reactive.  Liquidating stocks and real estate and shifting into precious metals at this point in the economic cycle could be a life changing event for those in a position to do so.

Posted on — Leave a comment

What Does London and Fort Knox Tell Us About Gold Prices?

Tariffs, trade wars and geopolitical turmoil seem to be mentioned in every conversation regarding gold.  More recently rumours swirl around whether both London and Fort Knox actually have the gold holdings they claim.  With gold trading at $4,586, silver $51.65, and platinum at $1515, one wonders how all these pieces fit together in the future and what it means for the price of gold.

In order to make sense of London and Fort Knox, it’s essential to first frame it by considering gold repatriation by country.  After World War 2, the US Dollar held the highest confidence globally and was hence pegged to gold. Storing a country’s gold assets in places more stable such as the United States was a sensible wealth preservation strategy. Today the financial landscape is very different.  While the US Dollar is still strong it is no longer pegged to gold, has been subject to quantitative easing, and also weaponised against other countries.  For various reasons, financial and political, not all countries in the world have viewed America as a safe haven for gold storage.

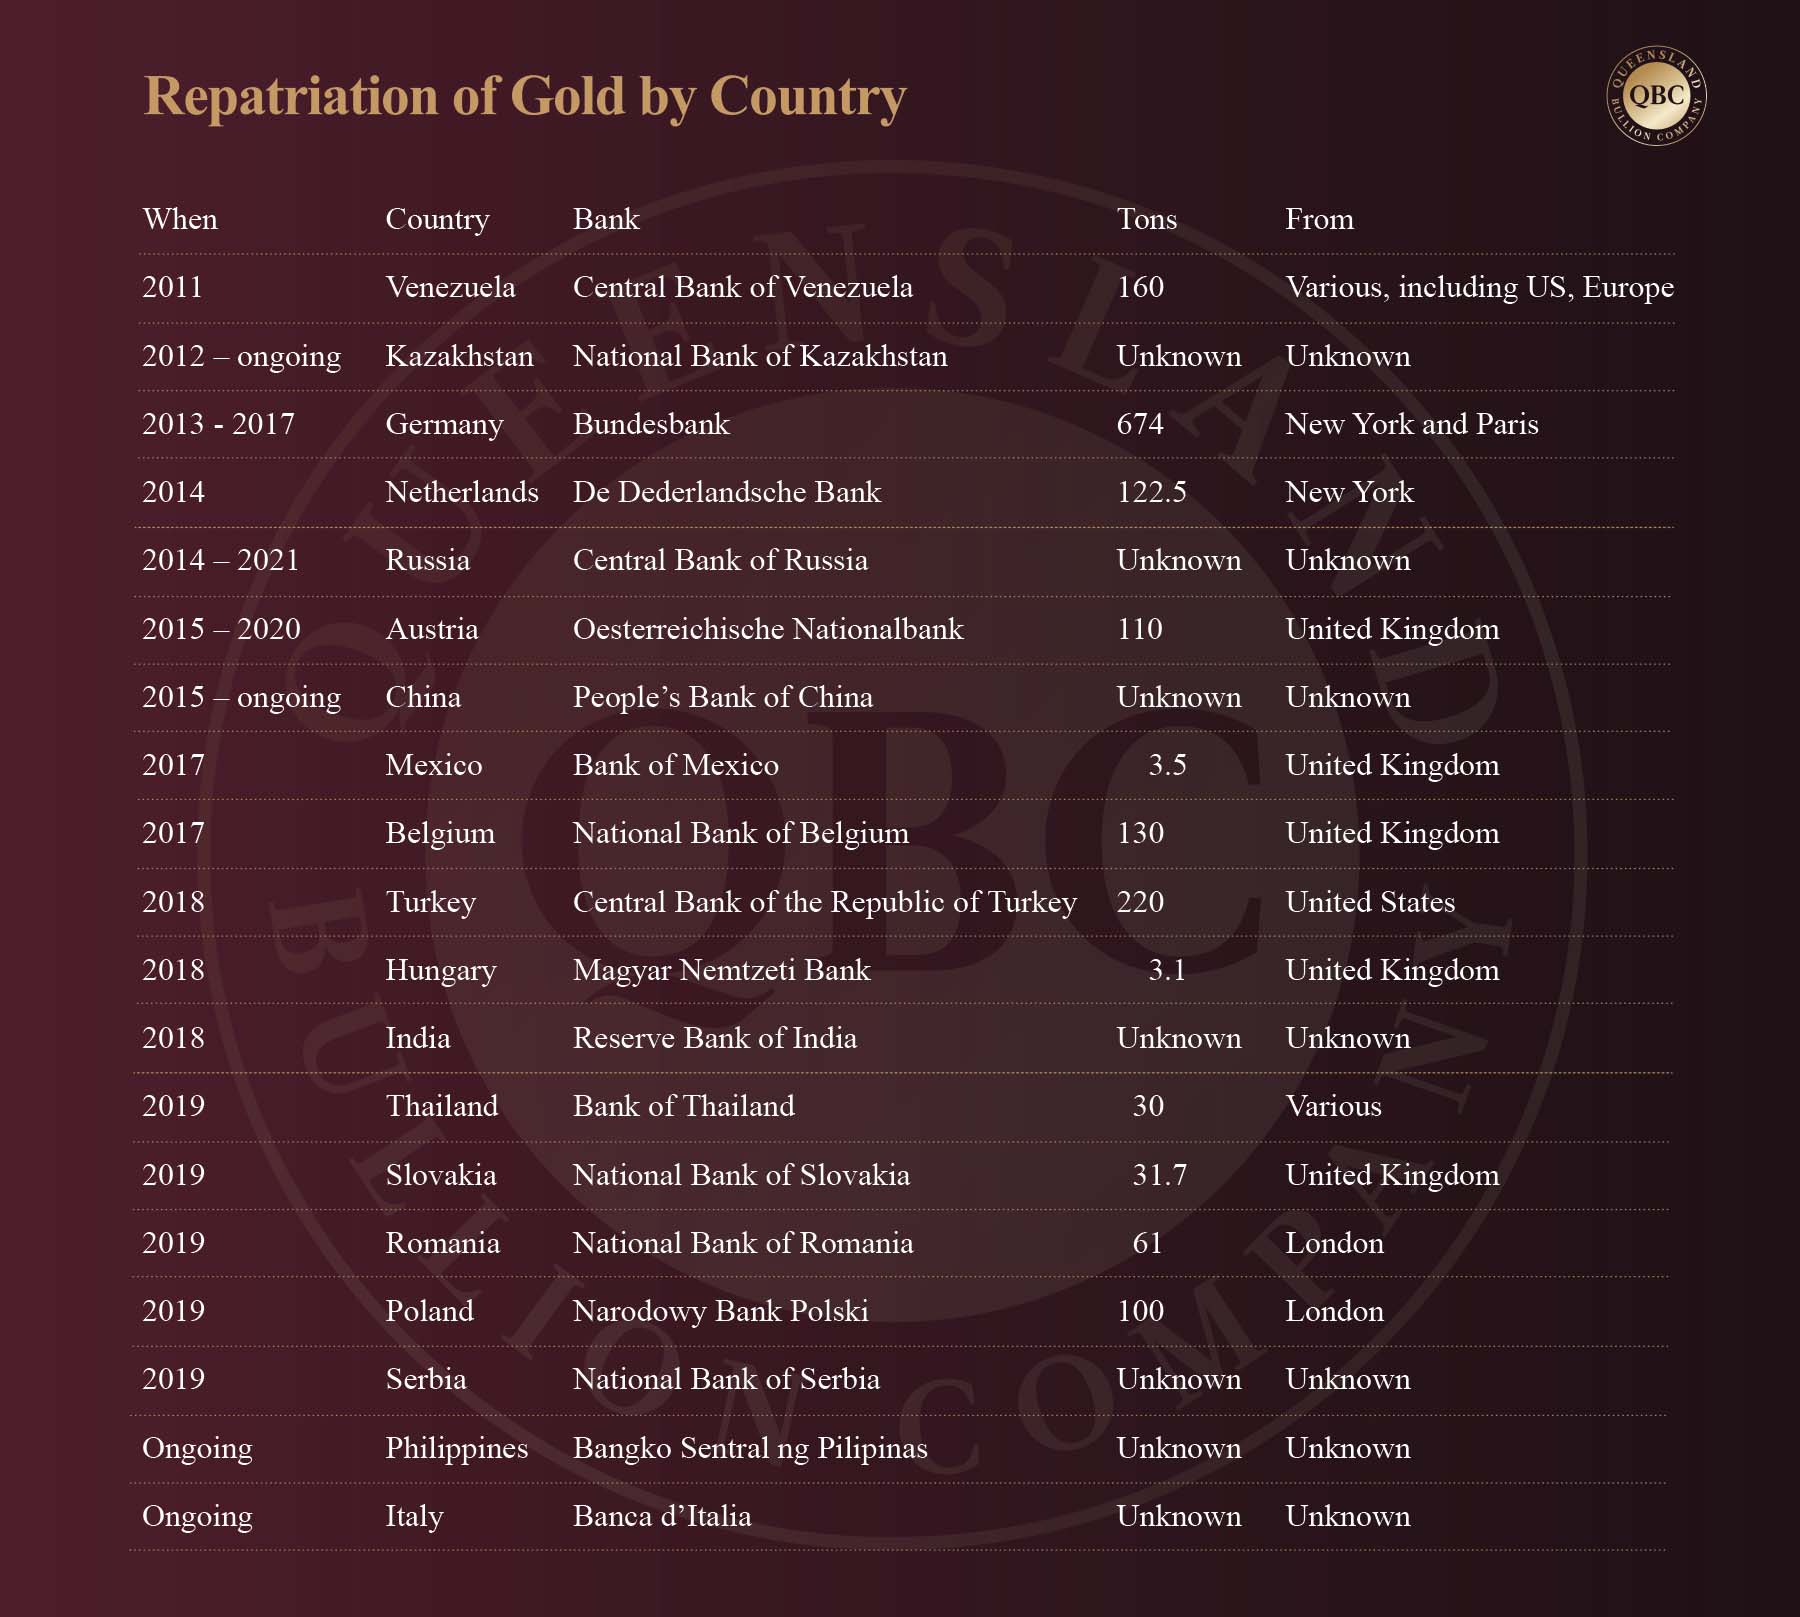
Since the 2008 Global Financial Crisis, reserve banks around the world have not only invested heavily in the precious metals but have also repatriated much of their gold holdings back to their homelands.  Below is a table showing how extensive these moves have been detailing nineteen countries and their holdings.

Note that these nineteen countries repatriated at least a portion if not all of their gold holdings by 2019.  What happened in 2019?  On the 29th of March, 2019, gold became a Tier One Capital Asset.  What happened next was a significant bull run wherein gold went from AU $1819 to $2291, signifying a 25.9% increase in value.

Fast forward now to 2022 (the point when the West sanctioned Russia for their Special Military operation in Ukraine), and we see a similar pattern forming.  In addition to the usual suspects, we also have emerging economies joining the fray such as Nigeria, Hungary, Serbia, and of course Poland who lead the charge in buying and repatriating their gold stores.  Do these central banks know something the public does not?  Are they once again positioning themselves for another massive gold rally as they did in 2019?  It remains to be seen.  But what does this have to do with London, Fort Knox and their ability to supply the gold they say they have stored in their vaults?

Thanks to the tariff and trade war narratives, America has drained London of gold and went from being a net exporter to a net importer.  Said another way, America has received 12.5 million ounces of gold and 40 million ounces of silver since November, while delivery times in London have gone from Trading plus one day to Trading plus eight to twelve weeks.  Concurrently JP Morgan has confirmed they are delivering US $4 billion worth of gold to New York for an unspecified client.  Now Elon Musk has tweeted that he wants to personally conduct an audit of the gold at Fort Knox. All of these events are historic and unprecedented. Fort Knox is said to hold 147.3 million ounces of gold.  Is it possible they needed a little top up before the audit?

So what happens if the gold at Fort Knox is audited?  If it is not there, it will likely cause a run on gold and then silver, and the value of both metals should significantly increase while paper derivative contracts for both should become worthless or near so.  If it is there, one possible scenario could bode very well for gold.  United States Secretary of the Treasury, Scott Bessent (who’s largest position is gold), is on record as saying in the Oval Office that they would “monetise the asset side of the US balance sheet” within the next twelve months as part of the Executive Order for Sovereign Wealth Fund.

A number of analysts suggest that could mean revaluing gold to market value.  The implications would be far reaching.  Using US $2900 as a case study, a revaluation of the Federal Reserve Bank’s gold holdings would swell to $756 billion.  It could also weaken the Greenback, an outcome Trump would welcome if he is to push tariffs seriously.  It could increase volatility in the markets while investors adjust expectations to match the new valuation. And it could inspire a serious upward trend in spot price.

So at this point we come full circle and uncover a potential reason as to why so many central banks are not just buying gold (and even silver) over the counter and by other less transparent means, but also repatriating the metals to their homelands.  If this scenario were to eventuate, the conservative gold bulls could afford to be a little smug as they remind their inner circle that, “If you don’t hold it, you don’t own it.”  No matter how you slice and dice the outcome of a Fort Knox audit, gold and silver are almost assured to come out on top as will those who hold their own.

Posted on — Leave a comment

Is $5,400 Really on the Cards for Gold This Year?

After a brief dip, Gold has maintained its bullish momentum above US $2,900.  Currently trading at $4,634, silver $51.64, and platinum $1,630, many banks have changed their targets for the yellow metal this year.  Those joining the choir of US $3,000 include, Goldman Sachs, Bank of America, JP Morgan, Swiss bank UBS, and locally, Commonwealth Bank of Australia.  CITI Bank and multiple analysts point higher to US $3,300 for 2025.  This is great news if you follow the market in USD, but what does it mean for Australian gold investors that need to factor in a USD to AUD currency exchange?

In short, it means Australian investors can afford to be even more bullish than their American counterparts.  The above targets do not factor in currency exchanges.  While banks and economists are generally mixed on where the AUD to USD exchange will move, geopolitical tensions and trade wars indicate a potential deterioration.  Conjecture aside, the American Greenback has long been used as a safe haven asset globally.  We suggest that last year’s outlook of a decrease in the exchange rate remains a more likely outcome given the global economy and politics.

Let us now take the scenario wherein gold is valued at US $3,300 by the year’s end, and the exchange rate with America sinks to 57 cents.  In that specific case, gold could see $5,543 in local markets.  While this is a bullish outlook, it must be acknowledged as plausible.  Watch to see how close gold comes to this forecast.

So why is the currency exchange with the US likely to drop?  Much of it has to do with China.  Since the Howard era, the value of the Australian Dollar is correlated directly to the success of the Resource Sector (the single most important sector affecting the local economy).  The reason for this is that our service sector is priced out of the international market, and our manufacturing has moved off-shore, leaving the Resource Sector as the only major factor underpinning our economy.  Australia’s largest resource is iron ore.  The result is that the demand for iron ore affects the AUD.

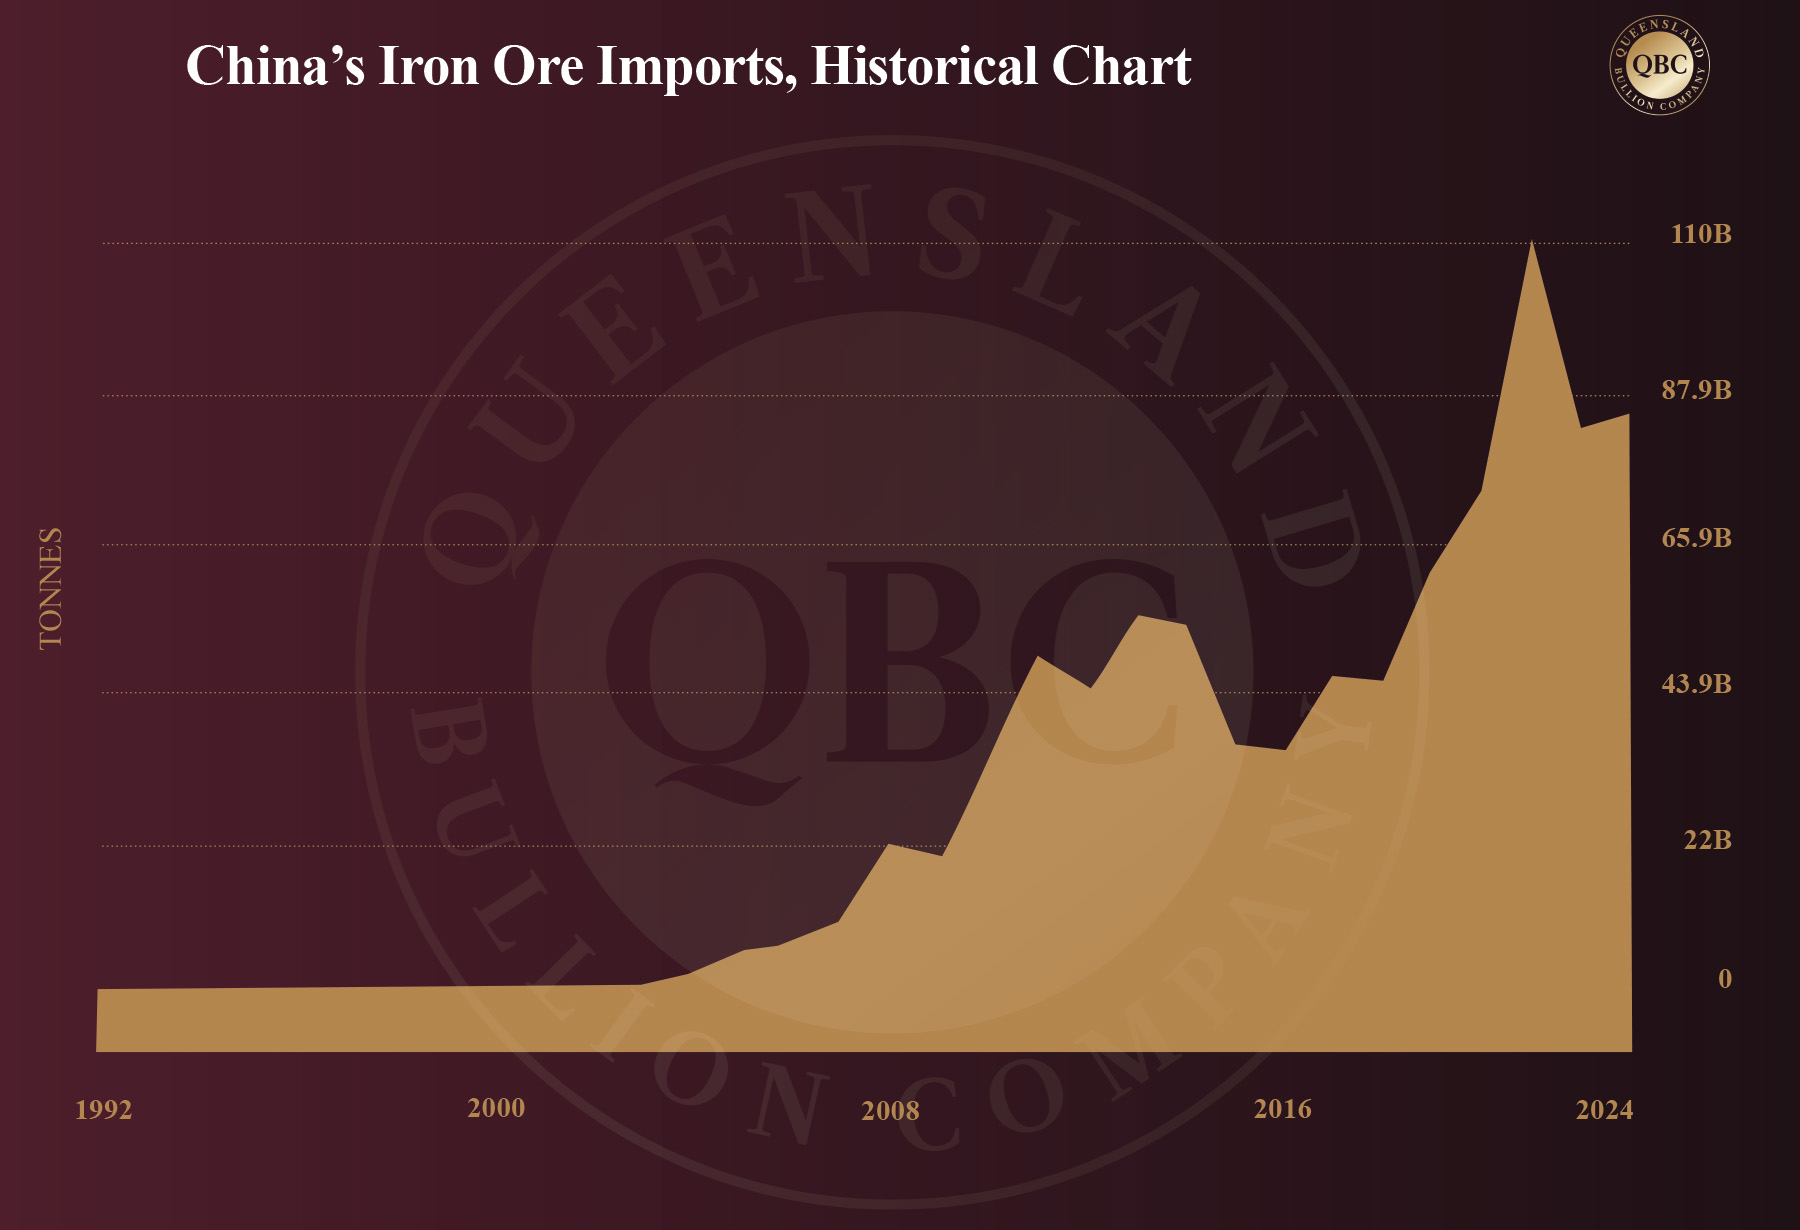
As Australia’s largest importer of iron ore, China has a significant influence over the value of our local currency.  The unfortunate reality is that China is in severe economic turmoil.  In 2023 it imported 1.18 billion tonnes of iron ore. In 2024 it increased to 1.24 billion.  2025 imports are set to be higher again.  Superficially these figures are impressive, until intent is considered.  On the ground, not all the iron ore is being processed, rather a portion is being stockpiled for future use.  The consequences for Australia is that we may see a decrease in iron ore exports in the future, thus affecting our currency lower.

Below is a historical graph of Chinese iron ore imports showing an overall downturn despite the immediate yearly increases.

China’s economy is something akin to the cycle of the 2008 Great Financial Crisis (just a lot worse), hence the anticipated down turn in demand for iron ore.  As a snapshot, an estimated US $18 trillion has been wiped out of household wealth.  Recognising the soft economy, the government has allowed some of their largest insurance houses to invest up to 1% of their overall portfolio in gold.  This could be an injection of US $27.4 billion into the international gold market.  Chinese bonds are at record lows offering small yields, the government may be offering economic stimulus too little too late, and while all this translates to a weak Australian dollar, it also points to a gold bull market taking off in China in their spring.

The other factor affecting China’s demand for iron ore is US President Trumps’ threat of tariffs.  Not only does he technically have 25% tariffs scheduled for Canada and Mexico, and 10% on China, on Wednesday he signed a memorandum directing his administration to threaten reciprocal tariffs on any trading partner that imposes levies on American imports.  Importantly, none have actually been executed, but investors are still acting on the perceived threat and governments around the world are well trained to be ready for anything under Trump 2.0.  If tariffs become real then a global softening in productivity can be expected, compounding Australia’s problem of a decreasing demand for iron ore.

To conclude, gold investors have plenty of reasons to remain bullish moving forward, and to consider adding to their portfolio.  If the currency exchange with America drops, if there is a trade war, or if geopolitical conflict ignites again… gold wins each time.

Posted on — Leave a comment

Silver at USD $50 by Midyear? Find Out Why

While all eyes are on gold, it did not disappoint hitting an all-time American high breaking USD $2900 for over 20 minutes yesterday.  A significant mile stone, it is understandable that investors can’t help but stare at the screen and the price of gold, yet there is a growing number of analysts who are looking the other way at gold’s “poor cousin,” silver.  Many now anticipate that silver will outperform gold on a percentage basis in 2025.  With gold currently trading at $4,551, silver at $51.53, and Platinum at $1,596 let’s examine two pieces of credible evidence behind the claim.


Gold to Silver Ratio 

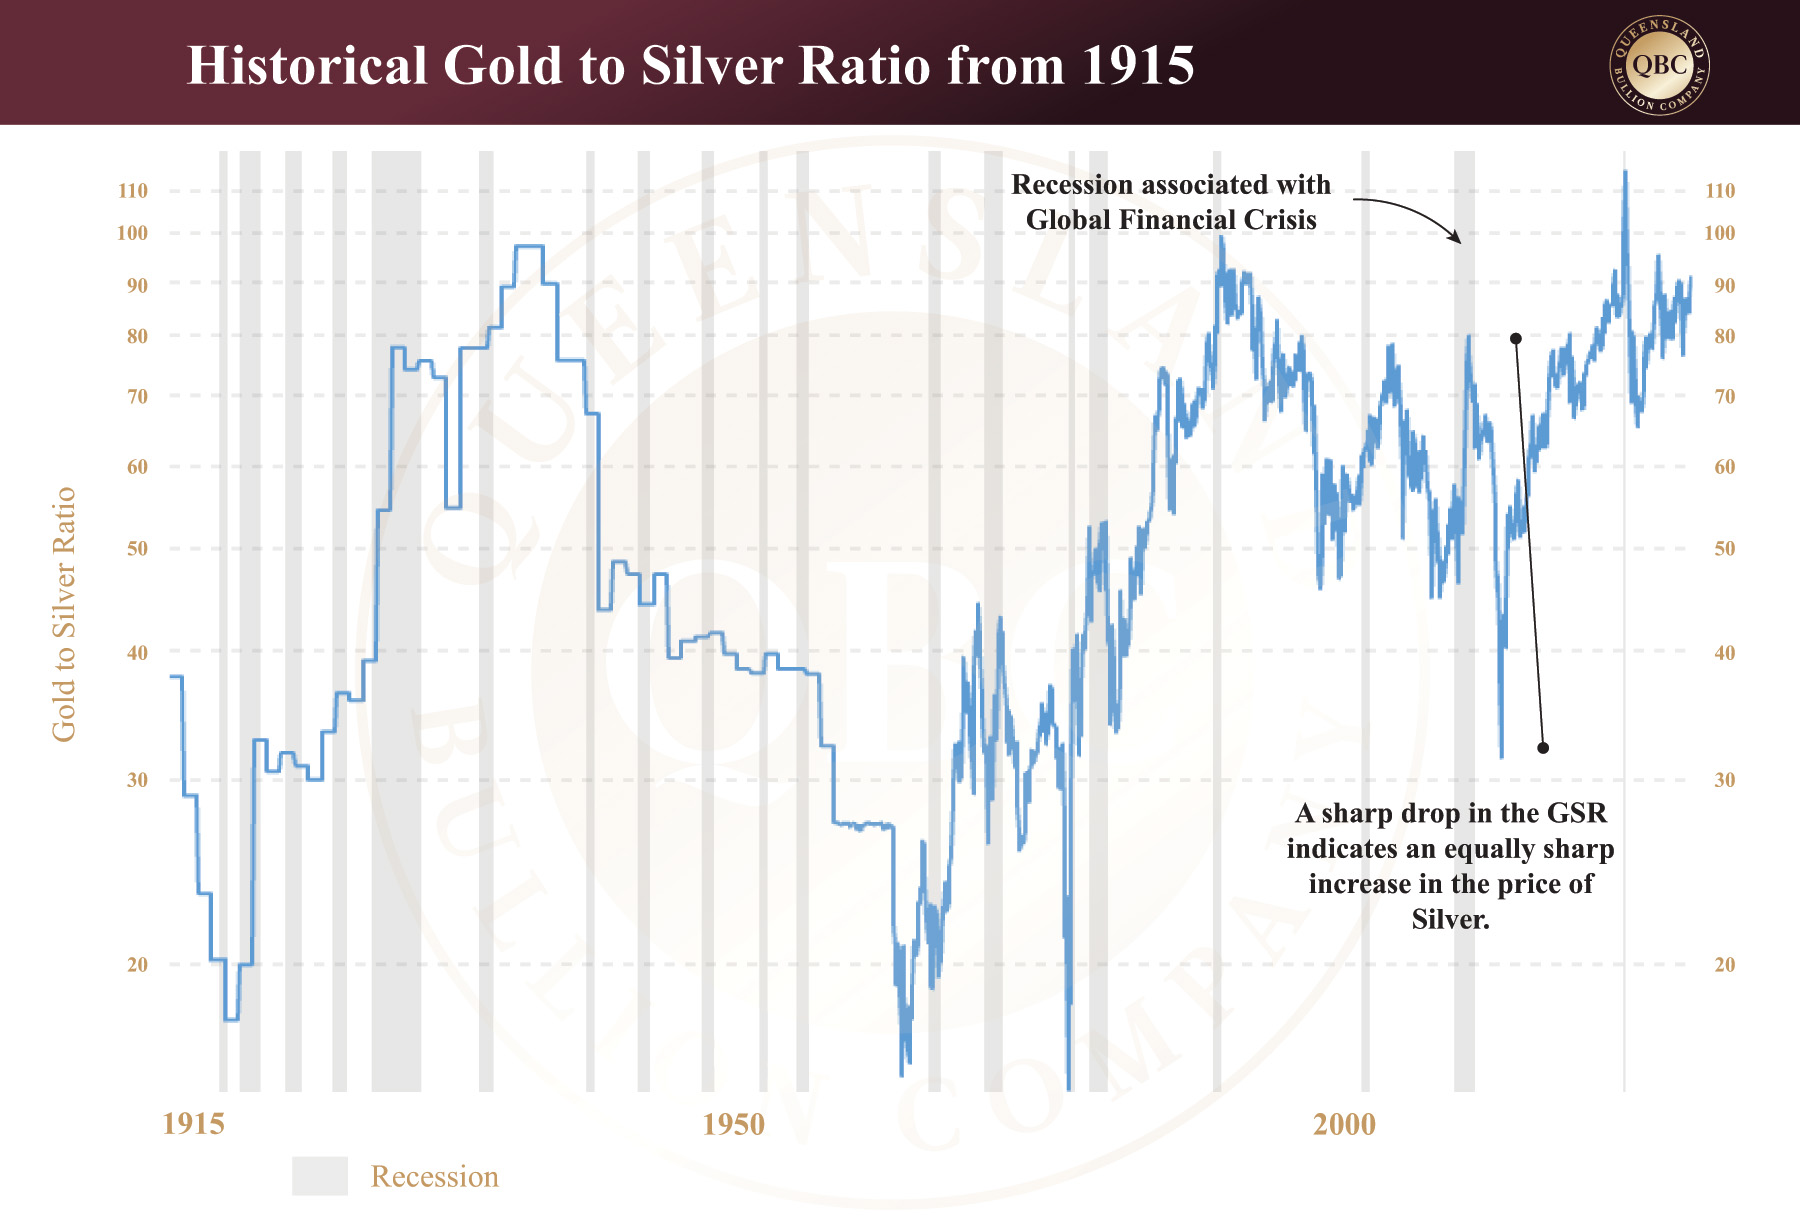
The Gold to Silver Ratio (GSR) has long been a fundamental factor that affects the price of silver.  The GSR has been oscillating between 88 and 90 over the last year.

It is currently 88.78, meaning it takes 88.78 troy ounces of silver to purchase 1 ounce of gold.  Miners are digging 15 ounces of silver out of the ground to 1 ounce of gold, so there is a massive disconnect between the paper markets and the physical reality on and in the ground.  For the whole of the 20th century, the average gold-silver ratio was 47:1. In the 21st century, the ratio has ranged mainly between 50:1 and 70:1, breaking above that point in 2018 with a peak of 104.98:1 in 2020.  So 88.78 indicates there is currently a divergence between the price of gold and silver.  For the GSR to return to a more traditional ratio this divergence would need to snap back closer together, and analysts predict that this will see the price of silver slingshot upward to compliment the price of gold, as opposed to gold dropping down to match silver.

Below is a historical chart of the Gold to Silver Ratio since 1915.  Note how the GSR generally increases during recessions, indicating low silver prices. Then observe how it dropped to 31.6 in April of 2011 after the Global Financial Crisis when silver prices hit all-time highs.  We have already established how current market  trends are mimicking the cycle just before the GFC.  This is why some analysts expect the ratio to drop in the future, citing targets of 1:70 in 2025, then gradually to 1:50, and eventually 1:30 in the long term prior to it rising again.  Let’s step this out to see how it translates to investment figures. If gold prices surge to USD $3000 – 3300, it would put the price of silver between USD $42 – 47 (or AUD $67 – $75 at the current exchange rate).

If you would like an analysis on gold in the Australian market for 2025, stay tuned and look out for next week’s newsletter, or read our past articles on gold.

Industrial use and silver deficits

Silver Bulls know that the grey metal enjoys a dual application of being a store of wealth with industrial use. Currently, industrial use accounts for 55% of the demand for silver.  To this end silver easily overshadows gold which only has 10% of its demand allotted to industrial use.  The use of silver in various industries can be read about in past articles.  What concerns us here are the quantities.  Overall demand for silver in 2024 was in the range of 1.21 billion ounces, the highest recorded quantity in history representing a 7% increase from the year before.

The industrial use of silver accounted for 700 million ounces in 2024.  This amount is set to increase particularly because of silver being the ultimate conductor for electricity.  As such, silver plays an integral role in the all manufacturing involving electronics and energy exchange.  If it has an on-off switch, it likely has silver in it.  As long as first-world lifestyles rely on electricity, industrial demand builds in support for the price of silver in a way that gold does not enjoy.

The final point worth raising is that there is a deficit in silver, meaning demand outstrips supply.  It has for the last four years and 2025 will be no different.  The Silver Institute anticipates an increase in mining production in the coming year pushing total output to a massive 844 million ounces, but compared to last year’s demand of 1.21billion ounces it pales in comparison and points to the fact that silver will become more scarce in the future based on this deficit created by increasing industrial demand.


In summary

At this point we come full circle and link increasing scarcity of silver to the decline in the Gold to Silver Ratio.  Hence, the case for silver is made in 2025.  While more volatile than gold, it has historically outperformed gold in the last five bull runs and has more than earned its place as a viable investment option.  If you are looking to balance your investment in gold with another metal that has a potentially greater upside, consider silver.  Perhaps it is not so much the “poor cousin” after all.

Posted on — Leave a comment

Gold Up More Than $100 Over Tariff Turmoil… Is it Justified

Gold prices soared this week to a new all-time high in Australian markets, increasing by over $100.  While last week’s article celebrated a breakthrough over $4400, this week sees gold currently trading at $4,505.92, silver at $50.95, and platinum at $1,673.93.  These prices are bucking the downward trend that traditionally happens at the end of each month, so what is responsible for the unusual reaction in the markets?  Trump’s threat of 25% tariffs for Canada and Mexico with a deadline of Saturday seems to be enough to put the market into a spin, but is it justified?

The fear that the wide-ranging tariffs on imports could include precious metals is playing out in the market and reflected in the spike in prices.  Regardless of whether tariffs are actually applied to precious metals, traders have been preparing by moving as much stock onto American soil as possible prior to any potential implementation.  While it usually only takes a few days to move bullion held at Bank of England (the UK’s central bank), the wait time has blown out to six to eight weeks.  Since the US election provided a solid win in favour of President Trump, gold traders have moved 12.2 million troy ounces into the Comex commodity exchange in New York, which now has the highest holdings since August of 2022.

Gold is not the only precious metal to get caught up in the hype of the moment, with silver also experiencing a massive trans-Atlantic shift towards New York.  To quote Bank of America, “There has been apprehension that liquidity on London’s physical market has fallen as traders have shipped silver to the US in anticipation of trade [tariff] restrictions, a dynamic worth following.”

The below graph shows gold and silver prices in the Australian market over the last four days.

But has the market taken the time to logically step through the implications of placing tariffs on precious metals and assess the likelihood of The US Government actually following through?  It is well established that the current American President has a tendency to not only keep the world guessing, but also negotiate hard and then pull back.  If a US tariff strategy was developed that included precious metals, the reality would be that the market would be left scrambling to source non-tariffed metals to complete current non-tariffed orders (filling like for like).  No amount of preparation would solve this market problem given the shorting positions on gold and silver.  Eventually it would effectively push money out of the United States and into other markets.  This type of behaviour is not in line with what Trump has outlined for his legacy.  Does incentivising traders to hold gold and silver in New York instead of London complement his intentions?  Clearly Trump would not discourage this.  But pushing money outside America is also not on his radar.

So while the threat of tariffs, in addition to currency exchange, pushes the price of gold and silver up in Australia, local investors can thank Trump for the momentary boost.  It is incumbent upon us to remember that many factors, tariffs included, point to toward a volatile but profitable year in precious metals.  Remaining emotionally neutral to the everyday politics of the market will serve us well in 2025.