Opportunity Costs and Asset Class Investment
by Evie SoemardiOn the back of the US Federal Reserve holding rates steady and the announcement of the post-Brexit US-UK Accord gold has experienced a drop in value of 1.87%, while silver has decreased 0.64%. Notably, gold has still gained upwards of 45% over the last twelve months with silver also gaining more than 18%. With gold currently trading at $5,198.31, silver at $51.07, and platinum at $1,538.49, in addition to the significant volatility seen so far this year, it is timely to explore the concept of Opportunity Costs in the context of asset class performance. A foundational understanding can be integral in developing wealth-building strategies when it comes to timing exits from one asset class and entering another and more.
What is Opportunity Cost?
Simply put an opportunity cost is the potential benefit of one option an investor may forfeit when choosing to invest in another. It is the loss of the opportunity that was left on the table in favour of a different one.
When working out opportunity costs a simple formula can be applied:
Clearly, when choosing which option to invest in there is no absolute certainty because forecasting relies on estimates and assumptions. However, factoring in opportunity costs can generally make for more informed decisions.
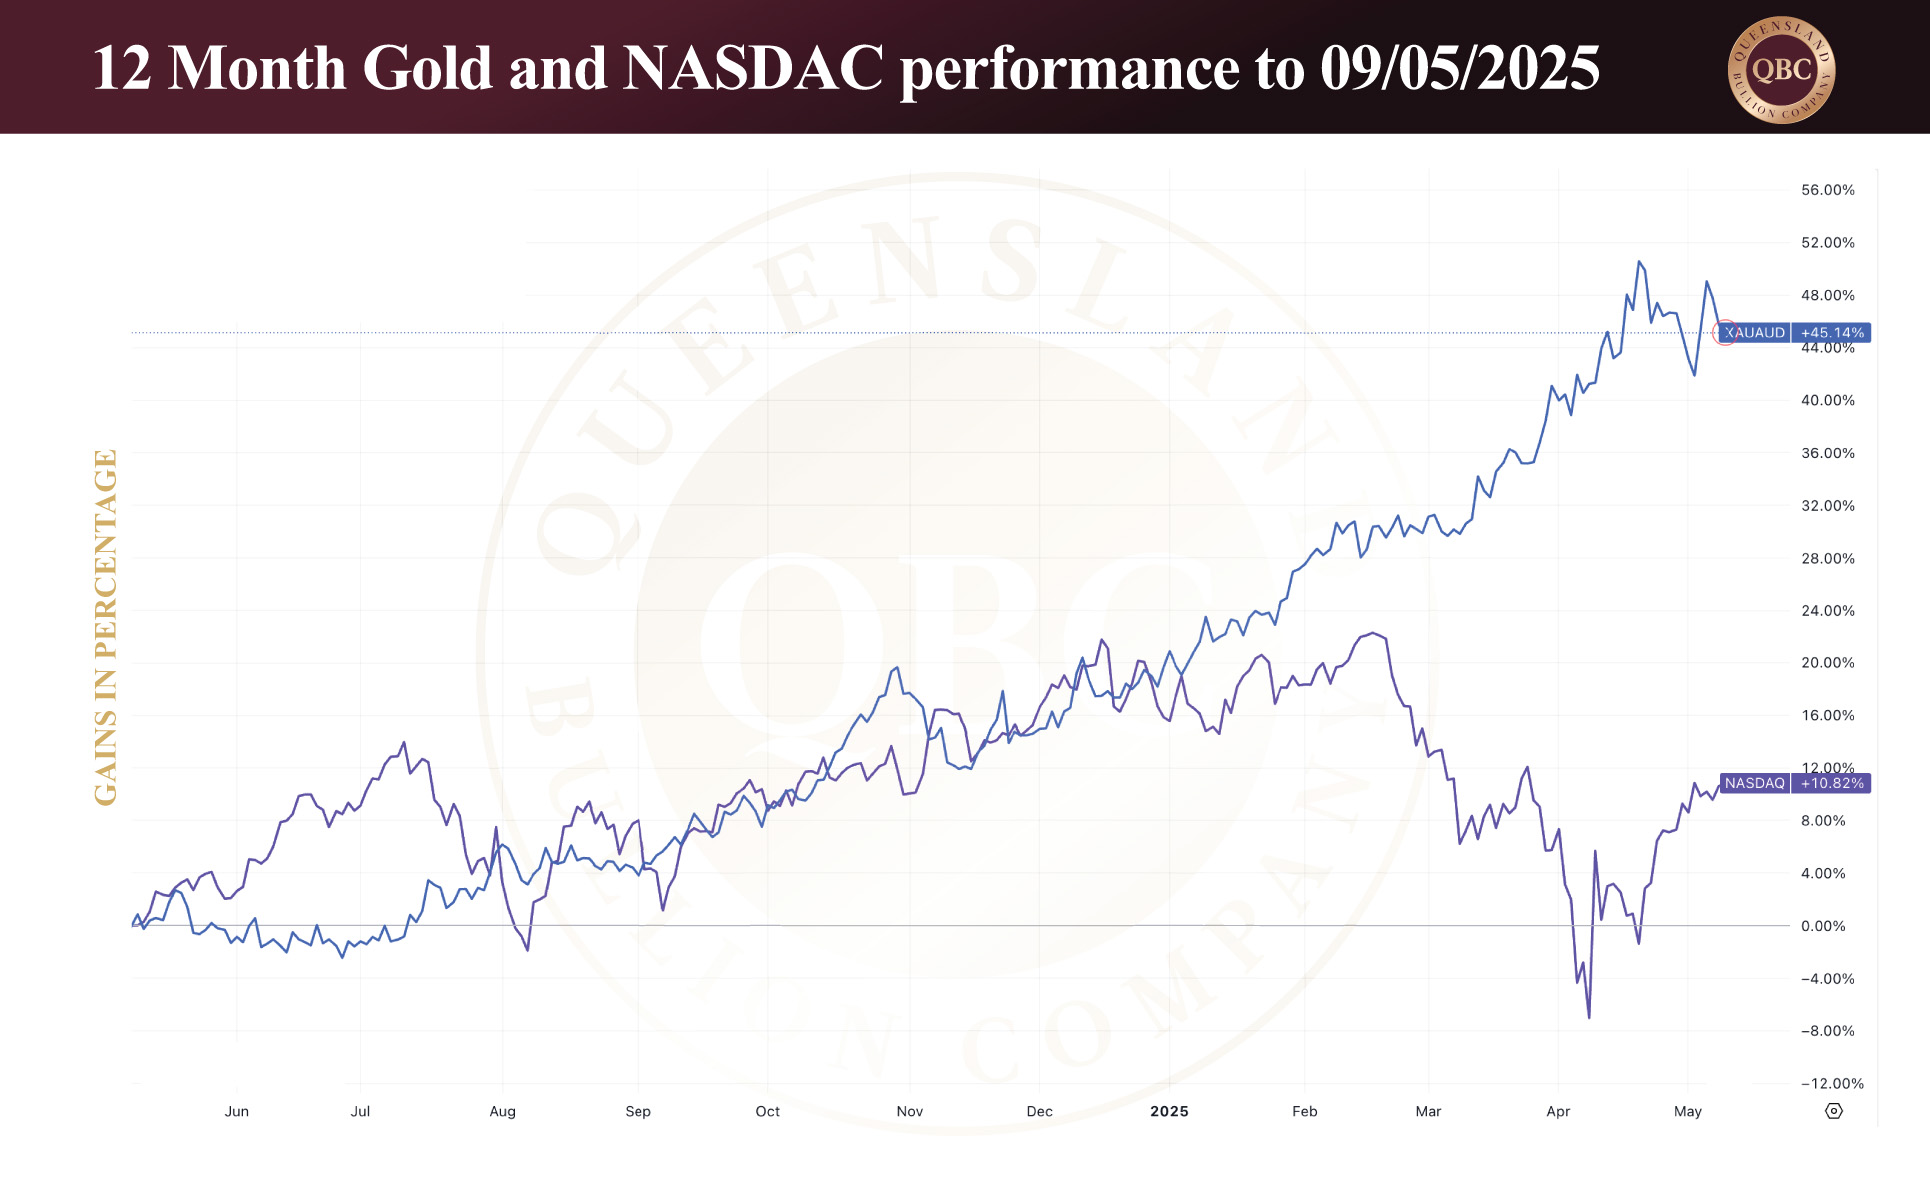
So how does this play out in the context of current events and asset classes? Let us compare technology stocks via the NASDAQ top 100 companies and gold over the past twelve months. The chart below illustrates that in this time the NASDAQ has gained 10.84%. On the other hand, gold has gained 45.04%. Let us assume $10,000 was invested in tech stocks during this period. The investor would have made $1,184 in gains. This presents well until the opportunity cost of investing in gold is considered. If the investor had chosen gold instead of a tech stock they would have made $4,504. Therefore the opportunity cost of choosing a tech stock over gold is $3,320 (the profit they forfeited). Said in terms of percentages, the opportunity cost was 34.2% (45.04 – 10.84 = 34.2%). Playing this out as part of the decision-making process could have redirected the investor to make more profits by diverting the capital to gold instead of tech stocks.
Asset shifting and net purchasing power
The benefits of working out opportunity costs is now evident. Let us extend this further and consider what happens during a stock market crash and the inevitable asset shifting that occurs. Ultimately, all asset classes such as real estate, stocks and precious metals, compete for the same capital in every investor’s pocket. Before a crash there are usually one or more asset classes that are overvalued; currently this would be the stock market (tech stocks in particular) and the real estate market. When these markets crash, generally all asset classes plummet due to the extreme volatility. In the markets that are overvalued, investors wish to preserve their gains and usually sell their assets as fast as possible, hence exacerbating the crash. If they reinvest in a different asset class it is called asset shifting. At this point many investors have exited the overvalued asset and now hold cash, looking for the next place to invest their wealth. Because it is a safe haven asset, gold has historically been the asset to invest in for such circumstances. This is why gold bounces back and experiences a a quicker recovery after a crash.
Consider, now, cost opportunities during these times when all markets pull back. While it is still an exercise in forecasting, assumptions and estimates, it suddenly became a little more complicated.
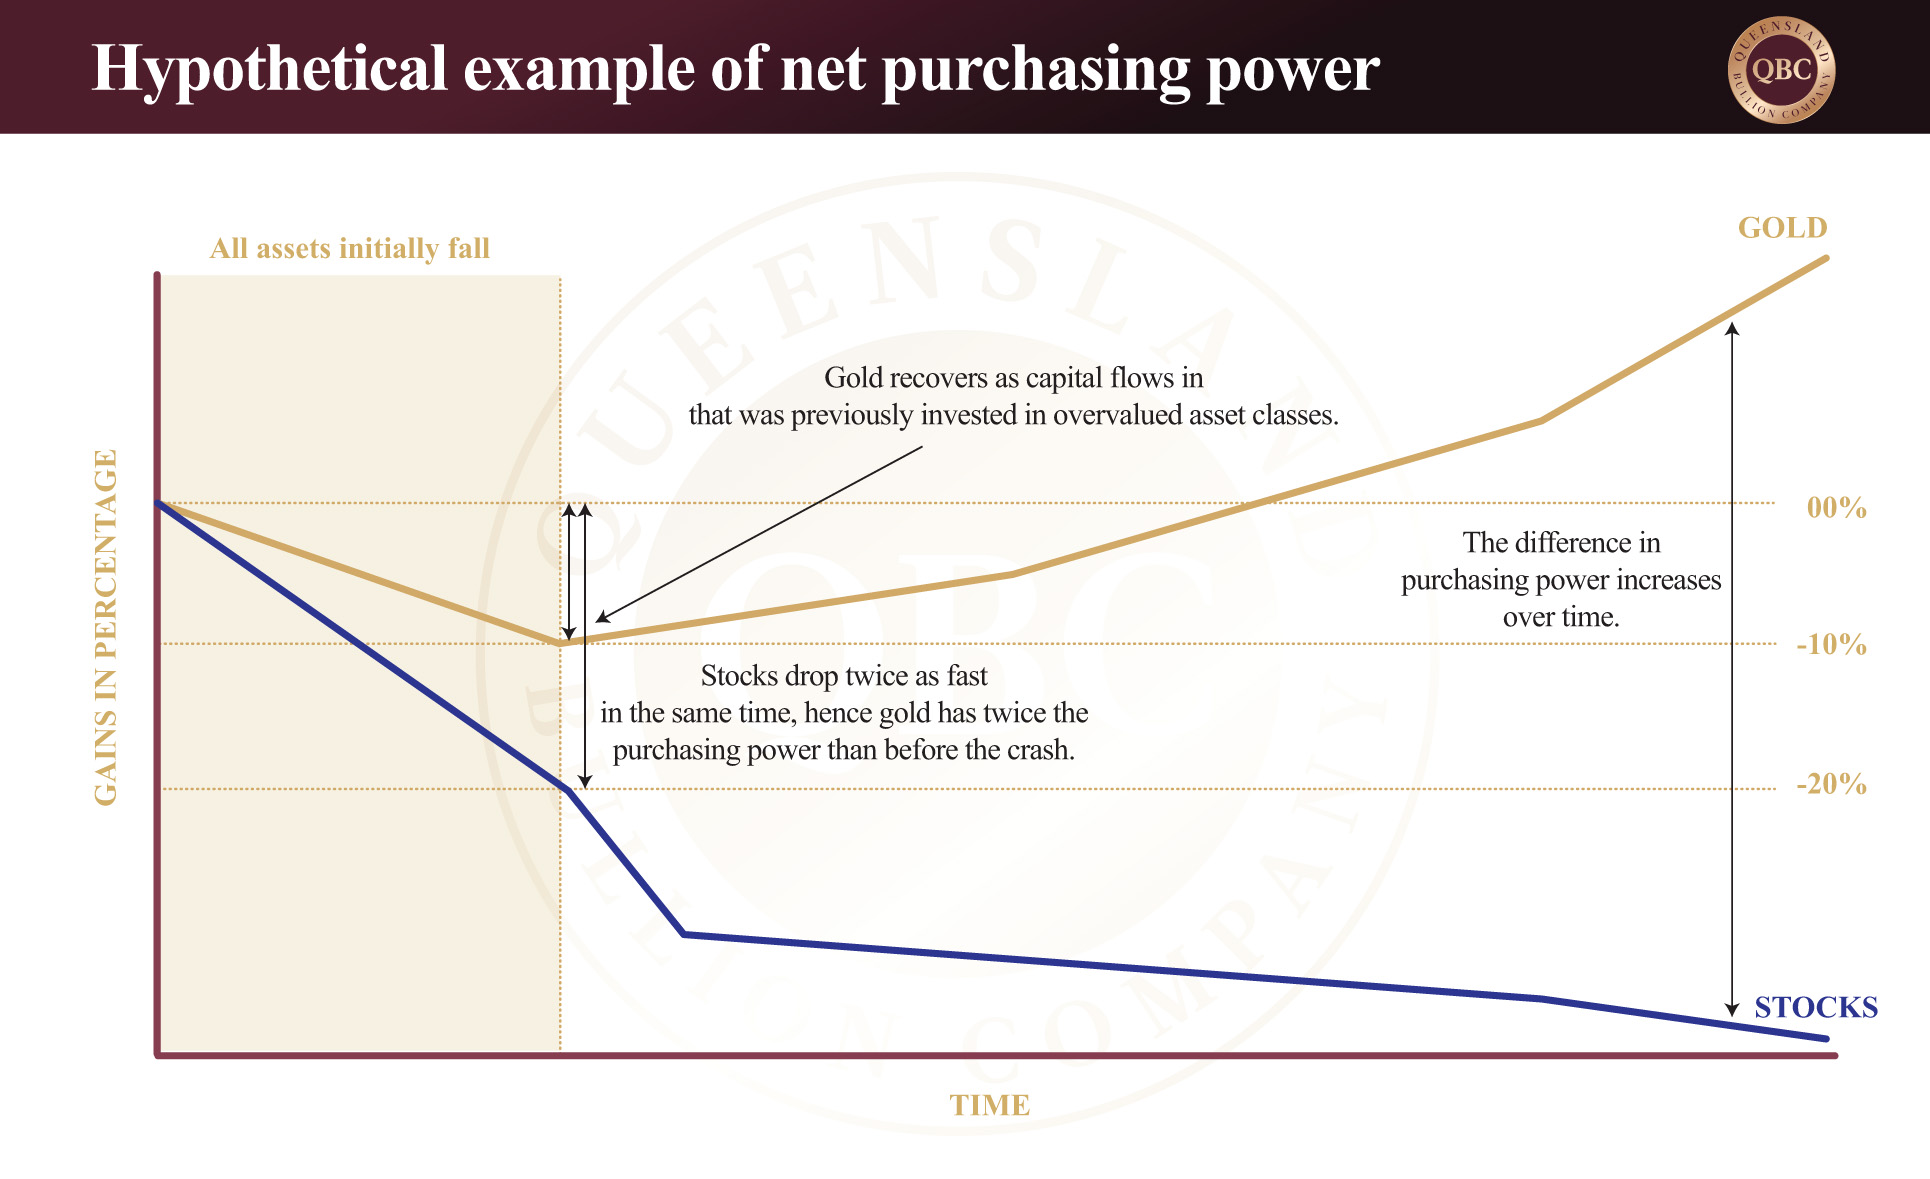
As a hypothetical example, gold may drop 10% at the beginning of a crash before it recovers. At first glance it appears as if value has been lost. But if stocks drop 20% in the same time then the purchasing power of gold is twice that of before the crash. From the perspective of purchasing power gold is the better investment even though it has lost value. When the value of gold starts increasing due to inflow of capital previously invested in an overvalued market the difference in net purchasing power becomes increasingly pronounced. The below graph illustrates how net purchasing power is more important than the value of an asset.
Conclusion
In summary there are various factors that investors need to consider when developing an effective wealth creation and preservation strategy. Potential cost opportunities and net purchasing power are two that forms a well-constructed plan. Knowing some history on the asset classes and how they perform in economic cycles is also essential. Review our previous articles to learn more about economic cycles and how asset classes respond to the current market conditions.


